
How the Cypher Harmonic Dashboard Scans 20 Symbols Across All Timeframes for Fibonacci-Validated XABCD Trade Setups

1. Introduction
You are staring at GBPUSD on the hourly chart, trying to piece together five swing points into a Cypher harmonic pattern. You think you have found X at a swing low, A at the subsequent high, and B at a pullback -- but does B sit between 38.2% and 61.8% of the XA leg? You grab the Fibonacci retracement tool, measure, and get 54.3%. That passes the first check. Now comes the part that makes the Cypher unlike anything else in the harmonic family: you need C to extend beyond A. Not retrace partway like a Bat or Gartley -- extend past it. You measure the XA extension and get 131.7%. Is that within the 127.2%-141.4% range? Close enough with tolerance? And then the final gate: D must retrace exactly 78.6% of the entire XC leg -- not XA, not AB, but XC, the full distance from the starting point to that extended C. By the time you have calculated all three Fibonacci relationships and confirmed the geometry, the D-point entry window has closed.
Now multiply that by twenty symbols across nine timeframes. The Cypher harmonic pattern is one of the most structurally distinctive formations in harmonic trading -- it is the only standard harmonic pattern where the C point extends beyond A, creating a wider geometric footprint that requires measuring an entirely different set of relationships than other XABCD patterns. Each potential Cypher requires identifying five confirmed swing points in the correct alternating sequence, then measuring and validating three separate Fibonacci ratios including an extension at C and a retracement of the unique XC leg at D. Manual scanning for Cypher patterns across a full watchlist is not just slow; it is operationally unfeasible.
The fundamental problem is not understanding the pattern. Most traders who study harmonic analysis can describe the Cypher structure and its Fibonacci requirements from memory. The problem is that no human can scan 180 chart combinations in real time, identify every valid five-point XABCD formation where C extends past A and D retraces 78.6% of XC, validate three ratio conditions simultaneously, and act on them before the entry window at point D closes. You need a system that performs the geometric analysis for you -- continuously, automatically, and across your entire watchlist.
I built the Cypher Harmonic Dashboard to solve this exact problem. It scans up to 20 symbols across nine timeframes, identifies confirmed swing pivots, constructs potential Cypher XABCD patterns, validates them against three Fibonacci ratio requirements with configurable tolerance, and presents every valid pattern in a compact six-column dashboard with real-time alerts. No manual measuring. No missed patterns. One glance tells you which symbols have active Cypher harmonic setups right now.
The indicator is available on the MQL5 Market for both platforms:
- MetaTrader 4: Cypher Harmonic Dashboard MT4
- MetaTrader 5: Cypher Harmonic Dashboard MT5
2. What Is Harmonic Pattern Trading?
Harmonic pattern trading is a methodology based on the idea that price movements form geometric structures defined by specific Fibonacci ratios between their legs. When those ratios align within acceptable tolerances, they identify high-probability reversal zones where price is statistically likely to change direction.
The concept traces back to H.M. Gartley's 1935 book Profits in the Stock Market, where he described a specific five-point price pattern that offered favorable risk-to-reward entries. Larry Pesavento later refined the Gartley pattern with strict Fibonacci measurements. Scott Carney then systematized harmonic trading further, publishing a series of books beginning in the late 1990s that defined a complete family of harmonic patterns -- including the Bat, Butterfly, Gartley, and Crab -- with precise ratio requirements.
The Cypher pattern has a distinctive origin within this history. It was identified by Darren Oglesbee as a distinct harmonic structure that did not fit neatly into the existing pattern classifications. While Carney's patterns focused on retracements (Bat, Gartley) and extensions beyond X (Butterfly, Crab), Oglesbee recognized that a recurring price formation existed where the C point extended beyond A while D retraced a precise percentage of the XC leg. This created a pattern with a unique geometric fingerprint -- wider at the C point than any retracement pattern, yet with D completing inside the structure rather than extending beyond X. The Cypher occupies its own category in harmonic trading: it is neither a pure retracement pattern nor an extension pattern in the traditional sense.
What makes harmonic patterns different from standard chart patterns like head and shoulders or double tops is their mathematical precision. A head and shoulders pattern is identified visually -- there is no universally agreed-upon ratio defining how deep the neckline should be relative to the head. Harmonic patterns, in contrast, require specific Fibonacci relationships between each leg. A pattern either meets the ratio criteria or it does not. This binary validation removes much of the subjectivity from pattern identification.
Why do these geometric structures repeat? The Fibonacci sequence and its derived ratios (0.382, 0.50, 0.618, 0.786, 0.886, 1.272, 1.414) appear throughout natural systems. In financial markets, these ratios manifest in the way crowds of traders react to price swings. Retracements and extensions tend to find support or resistance at Fibonacci levels because large numbers of participants use these same ratios for entries, stops, and targets. The self-reinforcing nature of this behavior is what gives harmonic patterns their predictive power.
The Cypher pattern occupies a unique position within the harmonic family because of its C-point extension. In the Bat pattern, C stays below A and D retraces 88.6% of XA. In the Butterfly, D extends beyond X with XAB fixed at 78.6%. In the ABCD pattern, there are only four points and no X point at all. The Cypher stands apart: its XAB range of 38.2%-61.8% allows a moderate B-point retracement, its C point extends 127.2%-141.4% of XA beyond the origin -- past A -- and its D point retraces 78.6% of the full XC leg. This combination of a moderate retracement at B, an extension at C, and a specific XC retracement at D creates a geometric structure that no other harmonic pattern shares.
3. The Cypher Pattern Explained
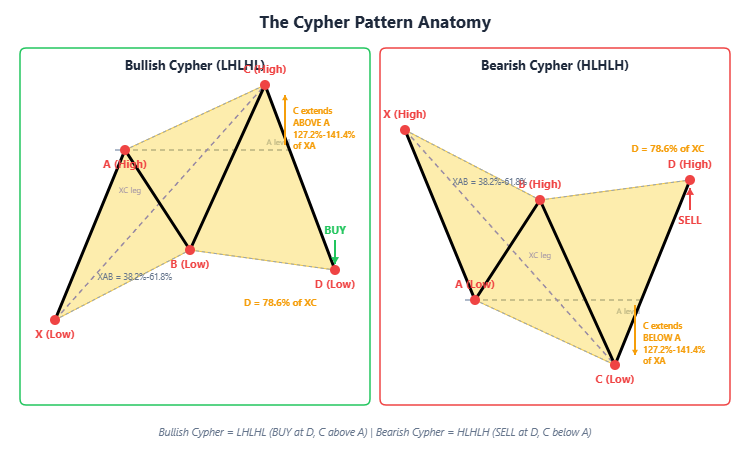
The Cypher pattern consists of five consecutive swing points -- labeled X, A, B, C, and D -- that form a specific geometric structure with three Fibonacci relationships between its legs. What fundamentally distinguishes the Cypher from other harmonic patterns is the behavior of the C point: it extends beyond A. In a Bat or Gartley, C stays between B and A. In a Cypher, C overshoots A entirely, creating a wider structure that looks different from any other XABCD formation on a chart.
There are two types of Cypher patterns:
Bullish Cypher (LHLHL -- Low, High, Low, High, Low)
In a bullish Cypher, the five points form this structure:
- X is a swing low -- the starting point of the pattern
- A is a swing high -- price rises from X to A (this is the XA leg)
- B is a swing low -- price retraces downward from A, and B retraces 38.2%-61.8% of the XA leg
- C is a swing high -- price moves upward from B, and C is above A (extending 127.2%-141.4% of XA beyond X)
- D is a swing low -- price drops from C to D, and D is above X (retracing 78.6% of the XC leg)
The D point is where the pattern completes, and it represents a BUY entry. Notice the critical structural details: C extends above A, which is the opposite of what happens in a Bat or Gartley where C must remain below A. And D stays above X -- unlike the Butterfly where D drops below X. The Cypher creates a distinctive visual shape where the pattern widens at C before contracting back to D, forming a structure that is broader at its midpoint than at either end.
Bearish Cypher (HLHLH -- High, Low, High, Low, High)
In a bearish Cypher, the structure mirrors the bullish version:
- X is a swing high -- the starting point
- A is a swing low -- price drops from X to A
- B is a swing high -- price retraces upward from A, and B retraces 38.2%-61.8% of the XA leg
- C is a swing low -- price moves downward from B, and C is below A (extending 127.2%-141.4% of XA beyond X)
- D is a swing high -- price rises from C to D, and D is below X (retracing 78.6% of the XC leg)
The D point completes the pattern and signals a SELL entry. Price has retraced 78.6% of the XC leg to a Fibonacci-defined resistance zone. The requirement that C extends below A and D stays below X confirms the Cypher structure. The bearish Cypher creates the same distinctive widening-then-contracting geometry, but inverted.
The key structural constraints that define the Cypher are:
- C extends beyond A -- In a bullish Cypher, C is above A. In a bearish Cypher, C is below A. This is the Cypher's signature feature and what makes it visually distinct from all other harmonic patterns.
- D stays within the XC range -- D retraces 78.6% of XC but does not extend beyond X. In a bullish Cypher, D is above X. In a bearish Cypher, D is below X.
Compare this to other patterns: the Bat keeps C between A and B with D retracing 88.6% of XA. The Butterfly has D extending beyond X with XAB fixed at 78.6%. The ABCD pattern has only four points with no X. The Cypher's C-point extension and XC-leg retracement at D create a geometry that belongs to no other harmonic family member.
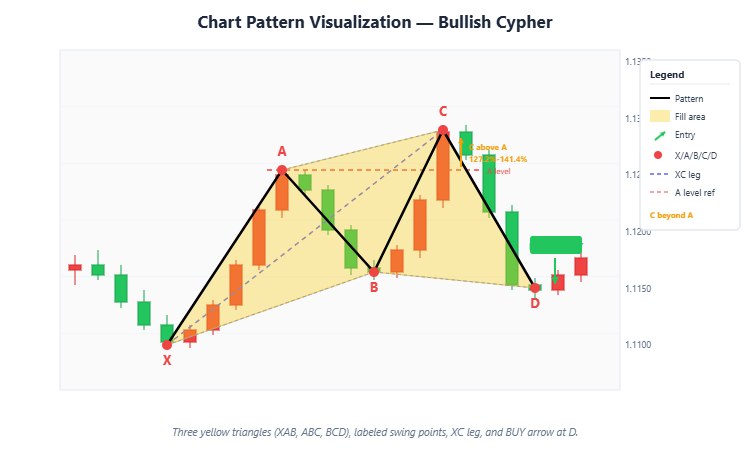
Figure 1. Bullish Cypher forms as LHLHL with C above A and BUY at D (above X); Bearish Cypher forms as HLHLH with C below A and SELL at D (below X). Note how C extends beyond A, creating the distinctive Cypher widening structure.
4. Fibonacci Ratios: The Validation Engine
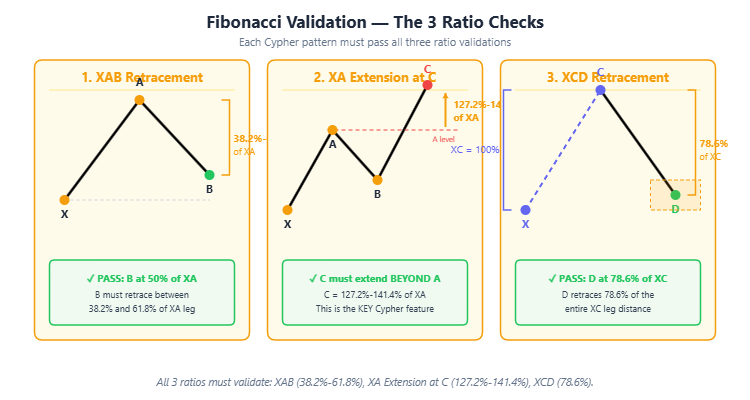
The Fibonacci ratios are what transform a random five-point price swing into a validated Cypher harmonic pattern. Without ratio validation, you would be trading every zigzag in price, and most of those would be meaningless noise. The Cypher pattern requires three separate ratio checks -- fewer than the Butterfly's four, but with a unique twist: the final ratio measures D's position relative to the XC leg rather than the XA leg.
XAB Retracement -- The First Gate (B retraces 38.2%-61.8% of XA)
The XAB retracement measures how much of the initial XA leg is retraced by the move from A to B:
XAB Retracement = |B - A| / |A - X|
The valid range is 0.382 to 0.618. This is a moderate retracement window that distinguishes the Cypher from other harmonic patterns at the very first checkpoint. The Butterfly requires a fixed 78.6% XAB -- much deeper. The Bat uses 38.2% to 50% -- overlapping but narrower. The Cypher's 38.2%-61.8% range centers around the golden ratio of 0.618, allowing B to sit at any of the primary Fibonacci retracement levels within this band.
This moderate retracement at B is what sets up the possibility of C extending beyond A. Because B does not retrace deeply into the XA leg, the subsequent move from B to C has enough momentum to carry past the A level and reach the 127.2%-141.4% extension of XA.
ABC Extension -- The Cypher's Signature (C extends 127.2%-141.4% of XA)
The ABC extension is where the Cypher reveals its true identity. This ratio measures how far C extends relative to the original XA leg, measured from X:
For Bullish Cypher (X=Low, A=High):
  C extension = (C - X) / (A - X)
  Must be between 1.272 and 1.414

For Bearish Cypher (X=High, A=Low):
  C extension = (X - C) / (X - A)
  Must be between 1.272 and 1.414
The target range is 1.272 to 1.414, with a configurable tolerance of plus or minus 5% (default). This means the effective valid range is:
Effective ABC Min = 1.272 x (1 - 0.05) = 1.2084 Effective ABC Max = 1.414 x (1 + 0.05) = 1.4847
The 127.2% level is the square root of 1.618 (the golden ratio), and 141.4% is the square root of 2.0. These are deeply rooted Fibonacci extension numbers. The fact that C must fall between these two specific extensions -- not just "past A" but at a precisely defined Fibonacci zone beyond A -- is what gives the Cypher its mathematical rigor.
This is the ratio that makes the Cypher visually and structurally unique. In every other standard harmonic pattern (Bat, Gartley, Butterfly), C stays between B and A -- it retraces part of AB but never exceeds A. In the Cypher, C blows past A to a Fibonacci-defined extension zone. This creates the characteristic "wider in the middle" shape that distinguishes a Cypher from all other XABCD formations on a chart.
XCD Retracement -- The Completion Ratio (D retraces 78.6% of XC)
The XCD retracement is the final validation gate and the one that makes the Cypher's completion zone unique among harmonic patterns. It measures D's position as a retracement of the full XC leg -- not the XA leg, not the CD leg, but the distance from X all the way to C:
XCD Retracement = |D - C| / |C - X|
The target ratio is 0.786, with a configurable tolerance of plus or minus 5% (default). This means the effective valid range is:
Effective XCD Min = 0.786 x (1 - 0.05) = 0.7467 Effective XCD Max = 0.786 x (1 + 0.05) = 0.8253
The 78.6% level is the square root of 0.618 -- the same Fibonacci ratio used as the fixed XAB level in the Butterfly pattern. In the Cypher, this ratio is applied to a different leg: XC instead of XA. Because C extends beyond A, the XC leg is longer than the XA leg. This means D's absolute position is different from where it would be if you measured 78.6% of XA. The D point in a Cypher occupies a zone that is determined by the full span of the pattern from X to C, creating a completion zone that no other harmonic pattern shares.
This XC-based retracement is what makes the Cypher computationally demanding to validate manually. You cannot simply draw a Fibonacci retracement from X to A or from A to B -- you need to measure the full XC distance and then calculate 78.6% of it. This requires tracking the extended C point and measuring backward from it to X, a calculation that involves more steps than the retracement-based patterns where D is defined relative to XA.
Figure 2. A valid Cypher pattern requires three Fibonacci ratios: XAB (0.382-0.618), ABC Extension (1.272-1.414 with 5% tolerance), and XCD (0.786 with 5% tolerance). The XCD measurement from X to C -- not X to A -- is the Cypher's defining computational feature.
5. Why Manual Pattern Scanning Fails
Even experienced harmonic traders face three critical operational problems when scanning for Cypher patterns manually. These problems are amplified for the Cypher because the C-point extension beyond A creates a visual signature that is easily confused with other pattern types, and the XC-leg retracement at D requires a measurement that most charting tools do not facilitate directly.
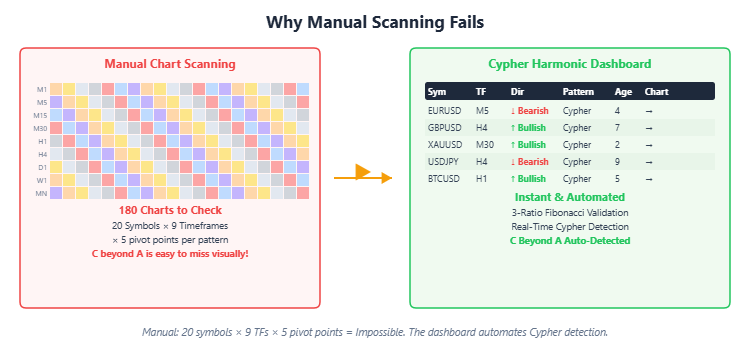
Problem 1: Volume of Chart Combinations
A typical multi-asset trader monitors 20 symbols -- major and minor forex pairs, gold, silver, crypto assets, and indices. With nine available timeframes (M1 through Monthly), that produces 180 possible chart combinations. Scanning each chart for five-point Cypher patterns requires identifying alternating swing highs and lows, verifying that C has extended past A, then measuring three separate Fibonacci ratios including the XC-based retracement at D. At even 45 seconds per chart (the three-ratio validation is somewhat faster than the Butterfly's four ratios, but the XC measurement adds mental overhead), a full scan takes over two hours -- by which time the majority of the setups you were looking for have already played out or disappeared entirely.
Problem 2: Pattern Confusion with Other Harmonics
The Cypher is one of the most frequently misidentified harmonic patterns. When traders see five alternating swing points with C above A (in a bullish context), they often confuse it with a failed Bat or an emerging Butterfly. The Bat keeps C below A -- so a Cypher that extends past A looks like a Bat that "broke." The Butterfly has D extending beyond X -- so a Cypher where D stays above X looks like an incomplete Butterfly. Traders who are scanning for multiple harmonic patterns simultaneously face constant classification ambiguity. After thirty minutes of distinguishing Cyphers from Bats, Butterflies, and Gartleys across different symbols, accuracy drops dramatically. The human eye starts misclassifying valid Cyphers as other patterns, or it dismisses genuine Cypher formations because the C-point extension "looks like a failed pattern."
Problem 3: Real-Time Pattern Completion
Cypher patterns complete when the D point forms at the 78.6% retracement of the XC leg. Because D sits within a relatively narrow Fibonacci zone (78.6% with 5% tolerance is an effective range of just 74.67%-82.53% of XC), the completion window is precise and brief. The price action at the D-point zone often shows rapid movement as the XC retracement reaches its target level. If you are still scanning EURUSD on the M15 chart when a valid bullish Cypher completes on XAUUSD H1, you miss the entry entirely. And because the stop loss for a Cypher is typically placed beyond the D point (or beyond X for a wider stop), late entries after D significantly degrade your risk-to-reward ratio.
The result is that most harmonic traders either limit themselves to a handful of symbols and timeframes (missing the majority of Cypher setups) or spend so much time scanning that they cannot act on what they find. The scanning process itself becomes the bottleneck, not the strategy.
Figure 3. The dashboard automates Cypher pattern detection across 180 symbol-timeframe combinations, eliminating the manual scanning bottleneck.
6. Introducing the Cypher Harmonic Dashboard
The Cypher Harmonic Dashboard is a professional multi-symbol, multi-timeframe indicator that automates the entire Cypher harmonic pattern detection process. Instead of manually scanning 180 charts, identifying five swing points, verifying that C extends past A, and measuring three Fibonacci ratios including the XC retracement, you get a single dashboard that continuously monitors all your symbols across all enabled timeframes and alerts you the moment a valid Cypher pattern completes.
Core Features:
- Automated Cypher Detection -- Identifies both Bullish (LHLHL) and Bearish (HLHLH) Cypher patterns with full three-ratio Fibonacci validation (XAB 0.382-0.618, ABC extension 1.272-1.414, and XCD 0.786)
- 6-Column Dashboard -- Symbol, Timeframe, Direction, Pattern, Age, and one-click Chart navigation
- Multi-Symbol Scanning -- Monitor up to 20 instruments simultaneously (forex, metals, crypto, indices)
- Multi-Timeframe Coverage -- Scan M1 through Monthly (9 timeframes, individually toggleable)
- Non-Repainting Signals -- Patterns are based on confirmed swing pivots with right-bar validation
- Yellow Triangle Fill -- Completed patterns are drawn with three filled yellow triangles (XAB, ABC, BCD) and labeled X/A/B/C/D points
- 4-Channel Alerts -- Popup, sound, email, and push notifications with pattern details
- Configurable Fibonacci Ranges -- Adjust XAB range, ABC extension tolerance, and XCD tolerance to match your trading style
The indicator handles all the geometric analysis automatically, including the C-point extension verification and the XC-leg retracement calculation at D that make manual Cypher identification so demanding. You configure your symbols, preferred timeframes, and Fibonacci tolerance ranges, and the dashboard does the rest -- scanning, measuring, validating, and alerting in real time.
Download the free demo or purchase the full version:
- MetaTrader 4: Cypher Harmonic Dashboard MT4
- MetaTrader 5: Cypher Harmonic Dashboard MT5
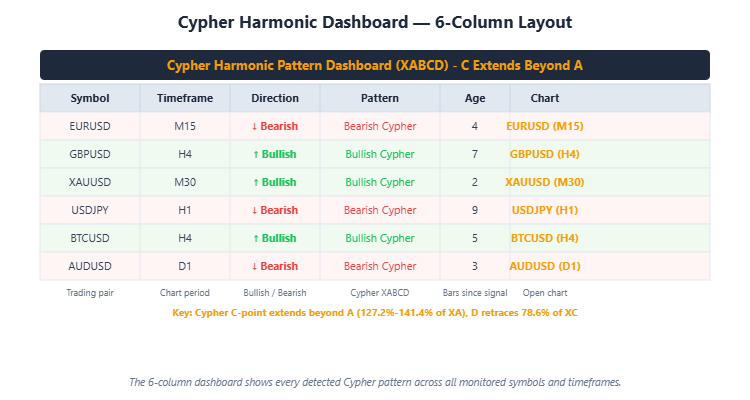
Figure 4. The 6-column dashboard shows every detected Cypher pattern across all monitored symbols and timeframes.
7. How the Detection Engine Works
The detection engine operates in three stages on every new bar: pivot identification, pattern construction, and Fibonacci validation.
Stage 1: Pivot Identification
The engine first identifies confirmed swing highs and swing lows across the price history. A swing high is a bar whose high is greater than the highs of a specified number of bars to its left and to its right. Similarly, a swing low is a bar whose low is lower than the lows of bars on both sides.
The key parameters are Pivot Left Bars and Pivot Right Bars , both defaulting to 5. This means a swing high requires 5 bars with lower highs on both the left and right sides before it is confirmed. This right-side confirmation is what makes the signals non-repainting -- a pivot cannot be identified until enough future bars have confirmed it.
Stage 2: Pattern Construction
Once pivots are identified, the engine searches for valid five-point alternating sequences. This is where the Cypher's structural requirements differ critically from other harmonic patterns:
-
For Bullish Cypher: it looks for a Low (X), then a subsequent High (A), then a Low (B), then a High (C) that is above A (the defining Cypher extension), then a Low (D) that is above X. This LHLHL sequence with C above A and D above X ensures the correct Cypher geometry -- C has extended past the first high, and D has retraced back within the pattern without breaking below the starting point.
-
For Bearish Cypher: it looks for a High (X), then a subsequent Low (A), then a High (B), then a Low (C) that is below A (the mirror extension), then a High (D) that is below X. This HLHLH sequence with C below A and D below X mirrors the bullish structure with C extending past A to the downside.
Note the C-point constraint: in a Bat, C must stay between B and A. In a Butterfly, C stays below A (for bullish) and the extension happens at D beyond X. In a Cypher, C is the point that extends past A, creating the pattern's characteristic wide shape. This single structural difference at C is what separates the Cypher from every other harmonic pattern in the XABCD family.
The engine scans up to 500 bars of history (configurable via Max History Bars ) to find the most recent valid pattern for each symbol-timeframe combination.
Stage 3: Three-Ratio Fibonacci Validation
Every candidate pattern is validated against all three Fibonacci ratio criteria:
- Calculate XAB retracement: |B - A| / |A - X| -- must fall within [0.382, 0.618]
- Calculate ABC extension: (C - X) / (A - X) for bullish, (X - C) / (X - A) for bearish -- must fall within [1.272, 1.414] with plus or minus 5% tolerance (effective range: 1.2084 to 1.4847)
- Calculate XCD retracement: |D - C| / |C - X| -- must equal 0.786 within plus or minus 5% tolerance (effective range: 0.7467 to 0.8253)
Only patterns that pass all three ratio checks are displayed on the dashboard. This rigorous three-gate validation ensures that every signal represents a geometrically valid Cypher harmonic structure -- not just any random five-point zigzag where C happened to extend past A.
Non-Repainting Guarantee
The indicator evaluates only confirmed pivots -- pivots where the required number of right-side bars have already formed. Because the D point must be a confirmed pivot (with Pivot Right Bars bars to its right), the signal cannot appear until the pattern is fully confirmed. Once displayed, it never changes or disappears. This non-repainting behavior means you can trust the dashboard signals for backtesting and live trading alike -- what you see on historical charts is exactly what the indicator showed in real time.
8. The 6-Column Dashboard
The dashboard presents all detected Cypher patterns in a compact, scrollable table with six columns:
| Column | Content | Description |
|---|---|---|
| Symbol | e.g., EURUSD | The instrument where the pattern was detected |
| Timeframe | e.g., H1, M15 | The chart timeframe of the pattern |
| Direction | Bullish / Bearish | Green for Bullish (BUY at D), Red for Bearish (SELL at D) |
| Pattern | Cypher | The pattern type |
| Age | e.g., 3 | Number of bars since the pattern completed |
| Chart | Click to navigate | Opens the corresponding chart for visual confirmation |
The dashboard displays in a separate indicator window below your main chart. It supports scrolling when there are more signals than visible rows (configurable, default 12 rows). Each row is color-coded by direction -- green background tint for Bullish, red for Bearish -- making it easy to scan for the type of setup you want.
Clicking the Chart column on any row switches your main chart to that symbol and timeframe, where the full Cypher pattern is drawn with three yellow triangle fills (XAB, ABC, and BCD), X/A/B/C/D labels, solid black lines connecting X-A-B-C-D, dashed lines connecting X-B, A-C, and B-D (dotted), and a dashed X-C line that shows the XC leg from which D's 78.6% retracement is calculated. A BUY ENTRY or SELL ENTRY arrow appears at the D point. The three triangles visually decompose the five-point structure into its component parts, while the X-C dashed line makes the retracement reference leg visually explicit.
The Age column tells you how fresh each signal is. An age of 1 means the pattern just completed on the most recent confirmed bar. Higher ages indicate older patterns that may still be valid if price has not moved significantly from the D point.
Figure 5. The indicator draws three yellow-filled triangles (XAB, ABC, BCD), labels each swing point, and places BUY/SELL arrows at point D. Dashed lines show the X-B, A-C, B-D, and X-C connections.
9. 4-Channel Alert System
The Cypher Harmonic Dashboard supports four independent alert channels, any combination of which can be enabled simultaneously:
| Channel | Parameter | Default | Description |
|---|---|---|---|
| Popup | Enable Popup Alerts | ON | Standard MetaTrader popup dialog |
| Sound | Enable Sound Alerts | ON | Plays a WAV file (default: alert2.wav) |
| Enable Email Alerts | OFF | Sends to the email configured in MT4/MT5 settings | |
| Push | Enable Push Notifications | ON | Sends to MetaTrader mobile app |
Alert Message Format:
When a new Cypher pattern is detected, the alert message includes the essential details:
Cypher Harmonic Dashboard: EURUSD BULLISH CYPHER (BUY) pattern on H1
The message tells you the symbol, pattern direction (Bullish or Bearish), the trading action (BUY or SELL), and the timeframe. This gives you enough information to immediately pull up the chart and evaluate the setup.
Alerts fire only once per pattern per symbol-timeframe combination to prevent duplicate notifications. The alert title is configurable via the Alert Title parameter, which defaults to "Cypher Harmonic Dashboard".
For email and push notifications to work, you need to configure the respective settings in your MetaTrader terminal options (Tools > Options > Notifications for push, Tools > Options > Email for email).
10. Practical Trading Workflow
Here is a systematic six-step workflow for trading with the Cypher Harmonic Dashboard:
Step 1: Setup
Configure the indicator with your preferred symbols (up to 20) and enable the timeframes you trade. Set your Fibonacci ranges based on how strict you want pattern validation to be. The default XAB range of 0.382-0.618 covers the standard Cypher retracement zone. Pay particular attention to the ABC extension tolerance -- the default 5% works well for most instruments, allowing C to extend between 1.2084 and 1.4847 of XA. Also consider the XCD tolerance -- the default 5% keeps D close to the ideal 78.6% of XC, producing high-quality entries at the Fibonacci-defined completion zone.
Step 2: Scan
Let the dashboard run. It continuously monitors all symbol-timeframe combinations and populates the table with every valid Cypher pattern it detects. Fresh patterns appear with low Age values. The three-ratio validation ensures that every pattern in the table is a geometrically valid Cypher pattern with C extending beyond A and D completing at 78.6% of XC -- not just a five-point zigzag with a coincidental C-point extension.
Step 3: Validate the Fibonacci Ratios
When a new pattern appears (Age = 1 or 2), note the direction. Bullish Cypher patterns indicate a BUY opportunity at the D point. Bearish Cypher patterns indicate a SELL opportunity. The dashboard has already validated all three Fibonacci ratios (XAB, ABC extension, and XCD retracement), but you can click through to the chart to visually confirm the structure and verify that C has genuinely extended beyond A and D sits at the 78.6% XC level.
Step 4: Confirm on Chart
Click the Chart column to open the corresponding chart. Verify that the three yellow triangles and five labeled points (X, A, B, C, D) form a clean Cypher structure. Confirm visually that C has extended past A -- above A for bullish, below A for bearish. Verify that the X-C dashed line shows a clear extension leg and that D sits at its 78.6% retracement level. Look for additional confluence -- does the D point align with a support/resistance level, a round number, a moving average, or a higher-timeframe structure? The Cypher's D point, derived from the XC retracement, often lands at levels that coincide with other technical features.
Step 5: Enter the Trade
If the pattern passes your visual confirmation:
- For a Bullish Cypher (BUY): Enter long near the D point. Place your stop loss below D by a buffer (e.g., 1x ATR below D) or below X for a wider stop. Set take profit at the A level initially, with an extended target at the C level. The C level is often a strong target because price has already demonstrated it can reach that extension.
- For a Bearish Cypher (SELL): Enter short near the D point. Place your stop loss above D by a buffer or above X. Set take profit at the A level or the C level, depending on your risk-reward preference.
Step 6: Manage the Position
Monitor the trade. Cypher patterns, because D forms at the precise 78.6% retracement of the XC leg, often produce well-defined reversals from the D point. Consider moving your stop to breakeven once price has moved in your favor by 1R (one times your initial risk). The natural targets at A and C provide logical levels for scaling out of the position.
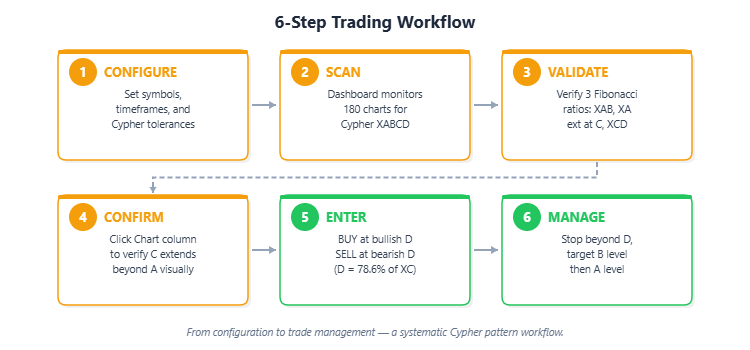
Figure 6. From setup to trade management -- a systematic workflow using the Cypher Harmonic Dashboard.
11. Real Trade Examples
The following examples are taken from live charts with the Cypher Harmonic Dashboard active. Each screenshot shows the completed pattern with three yellow triangle fills, X/A/B/C/D labels, and the dashboard running in the indicator window. The examples span forex, metals, crypto, and indices to demonstrate the Cypher pattern's universal applicability.
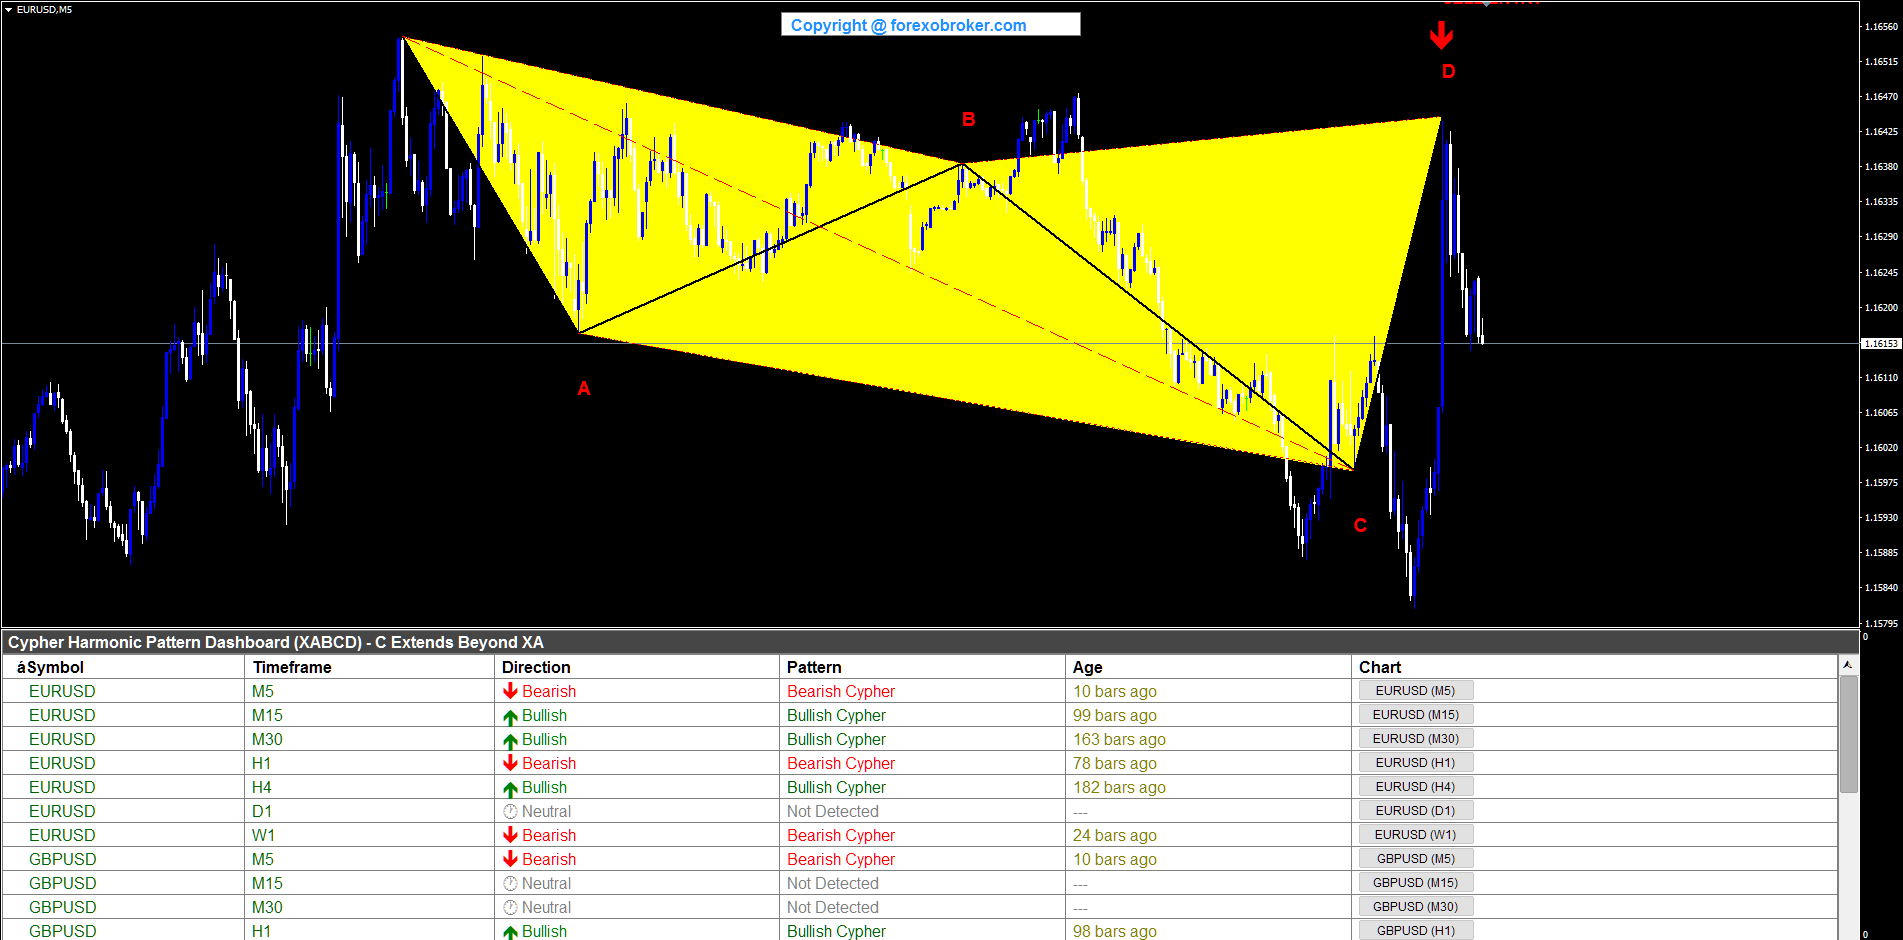
EURUSD M5 -- Bearish Cypher
EURUSD on the M5 timeframe produced a bearish Cypher signaling a fast-timeframe reversal opportunity. The X point formed at a swing high, with A dropping to a swing low below. B retraced upward, sitting within the 38.2%-61.8% XAB retracement zone. C then dropped below A -- this is the Cypher's defining extension, with C reaching the 127.2%-141.4% zone of XA measured from X. D completed at a swing high, retracing 78.6% of the full XC leg, but staying below X as required for a bearish Cypher. The SELL arrow appeared at D, and the three yellow triangles (XAB, ABC, BCD) clearly outlined the five-point Cypher geometry. The dashed X-C line showed the extended leg from which D's retracement was calculated, and the dashboard row displayed EURUSD on M5 with Bearish direction in red.
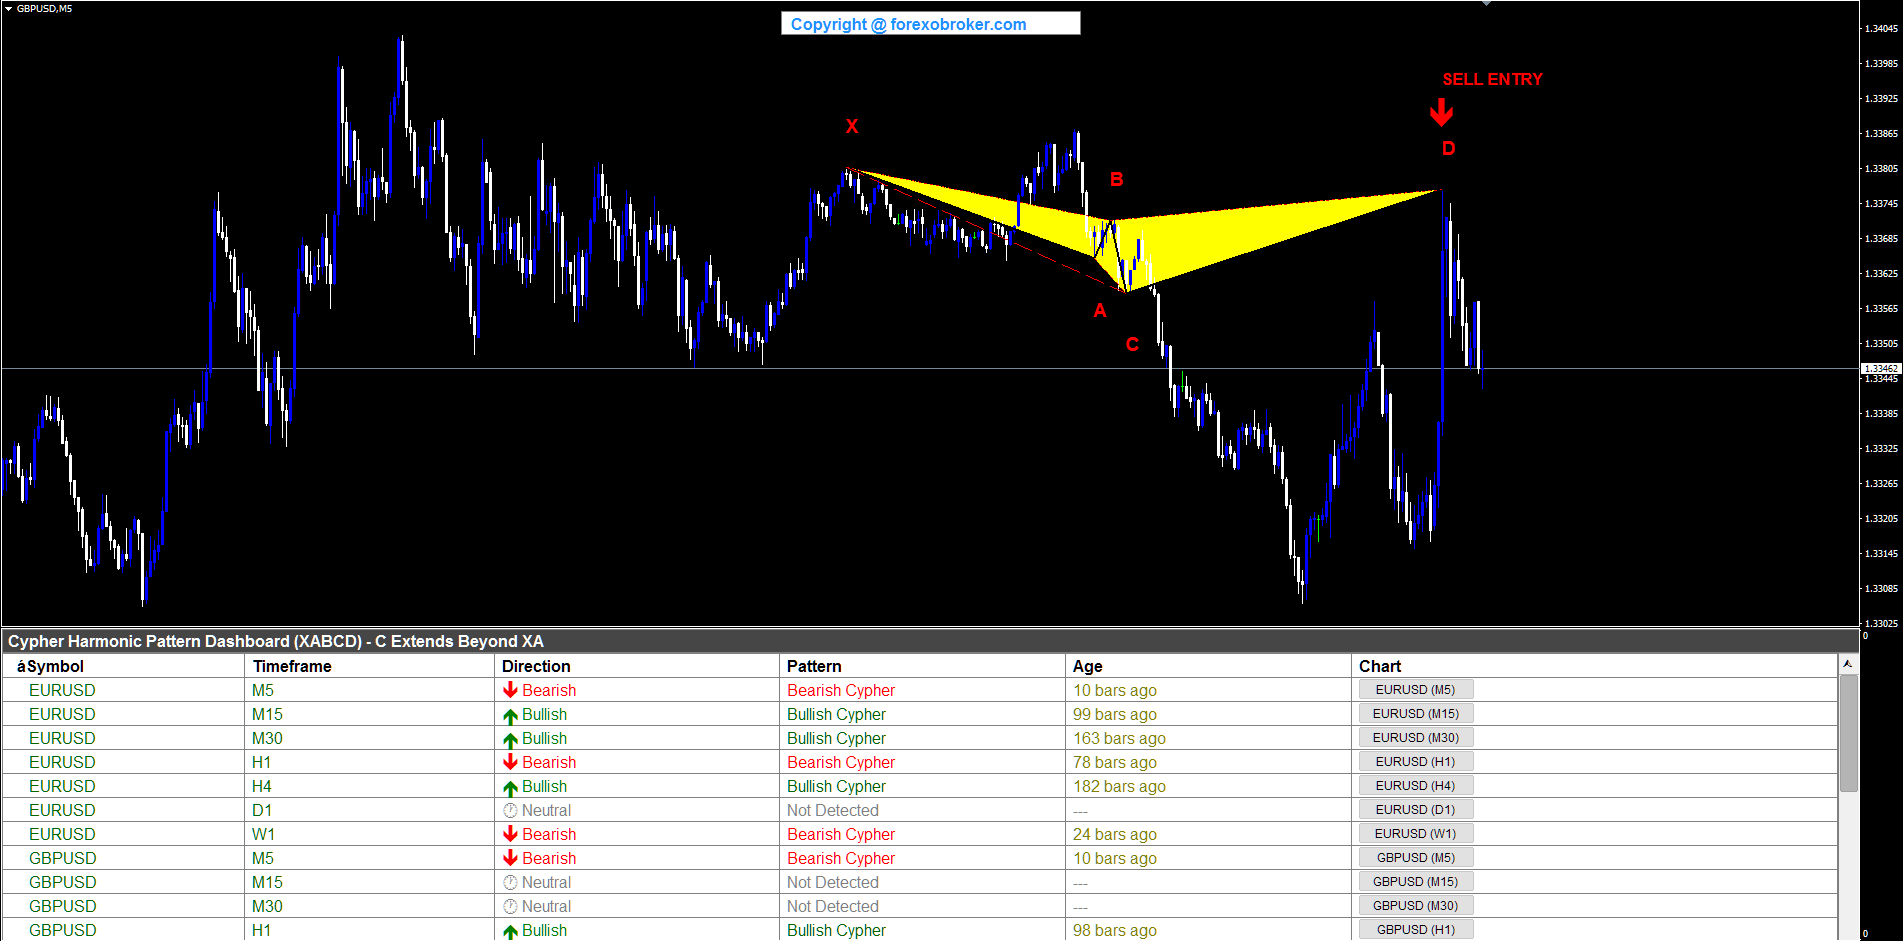
GBPUSD M5 -- Bearish Cypher
Cable on the M5 chart displayed a bearish Cypher with clean Fibonacci geometry on the short timeframe. X established at a swing high, A at the subsequent swing low. B retraced upward within the 38.2%-61.8% XAB range, and C extended below A into the 127.2%-141.4% XA extension zone -- the unmistakable Cypher signature where C overshoots the A level. D completed as a swing high at the 78.6% retracement of the XC leg, generating a SELL ENTRY signal. The three yellow triangles showed the characteristic Cypher widening at C, where the middle triangle (ABC) extends beyond the first triangle's (XAB) boundary. The pattern demonstrated the Cypher's suitability for short-term reversal trading on fast timeframes.
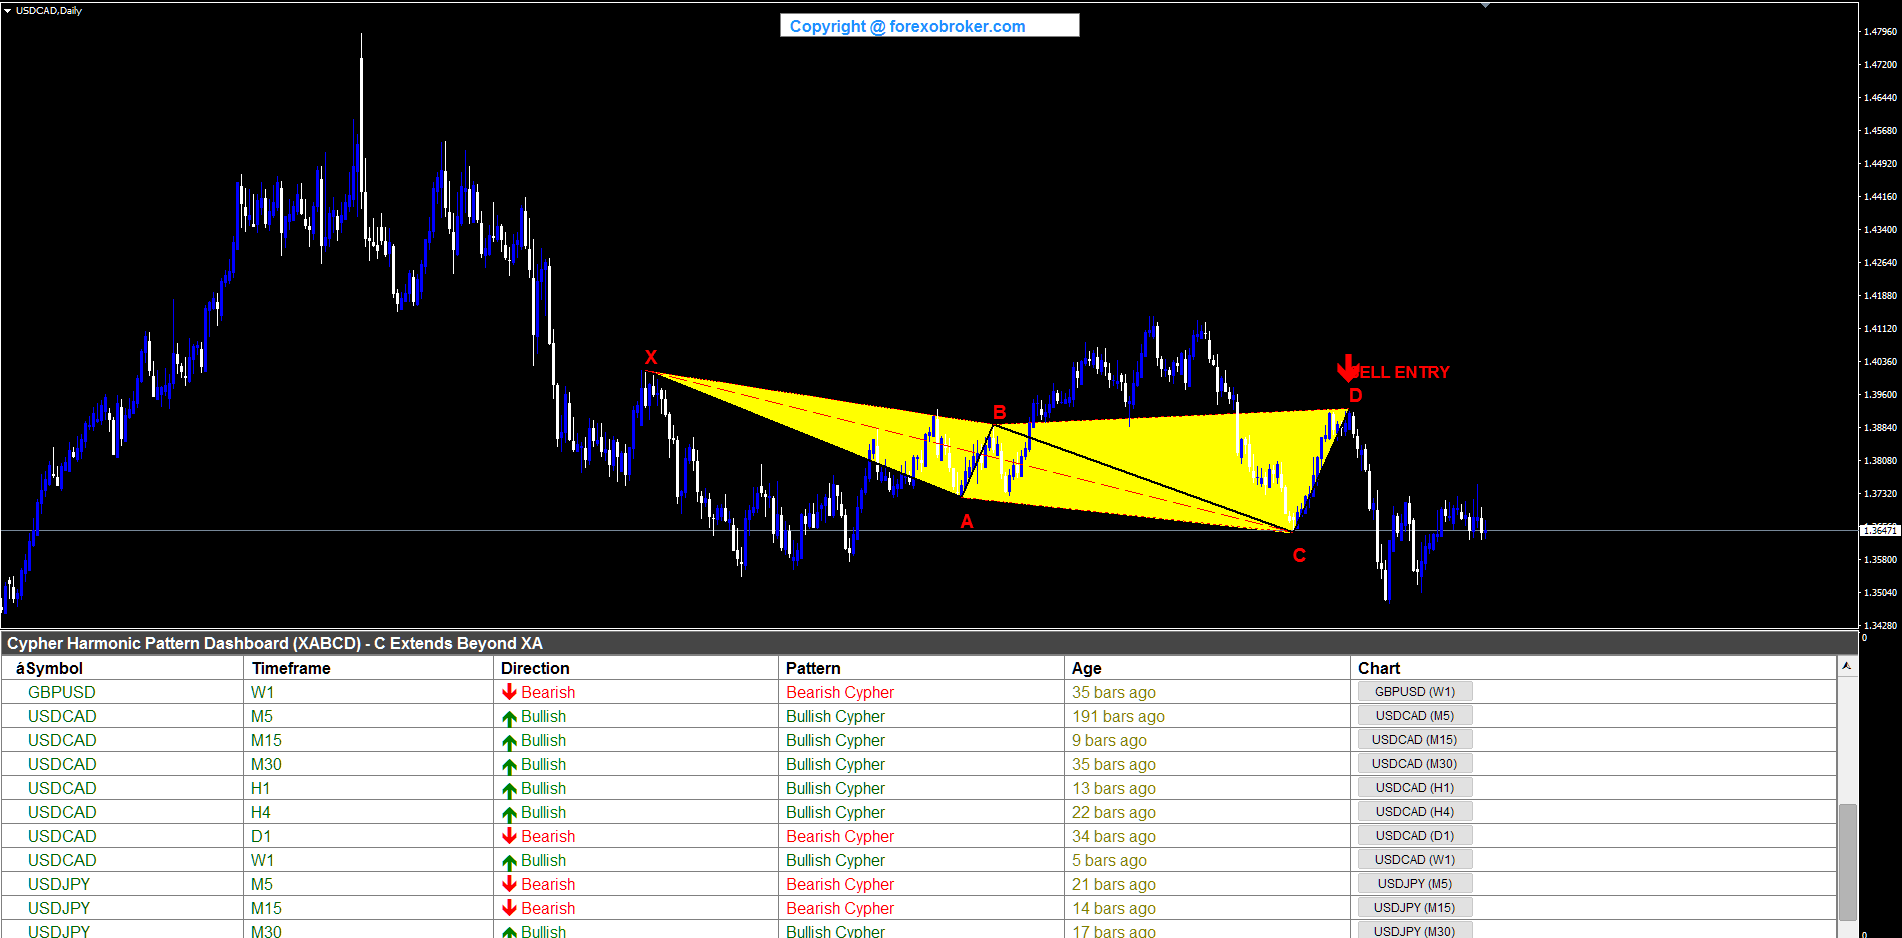
USDCAD Daily -- Bearish Cypher
USDCAD on the Daily chart formed a large-scale bearish Cypher suitable for position trading. X was identified at a swing high, A at a deep swing low creating a substantial XA leg. B retraced upward within the 38.2%-61.8% range, and C extended below A into the Fibonacci extension zone -- on the daily timeframe, this extension represented a significant price move below the initial swing low. D completed at a swing high, retracing 78.6% of the full XC leg, generating a SELL ENTRY at a Fibonacci-validated resistance zone. The large-scale three yellow triangles spanned many daily bars, and the pattern demonstrated the Cypher's ability to identify major reversal opportunities on higher timeframes with the same geometric precision as on intraday charts.
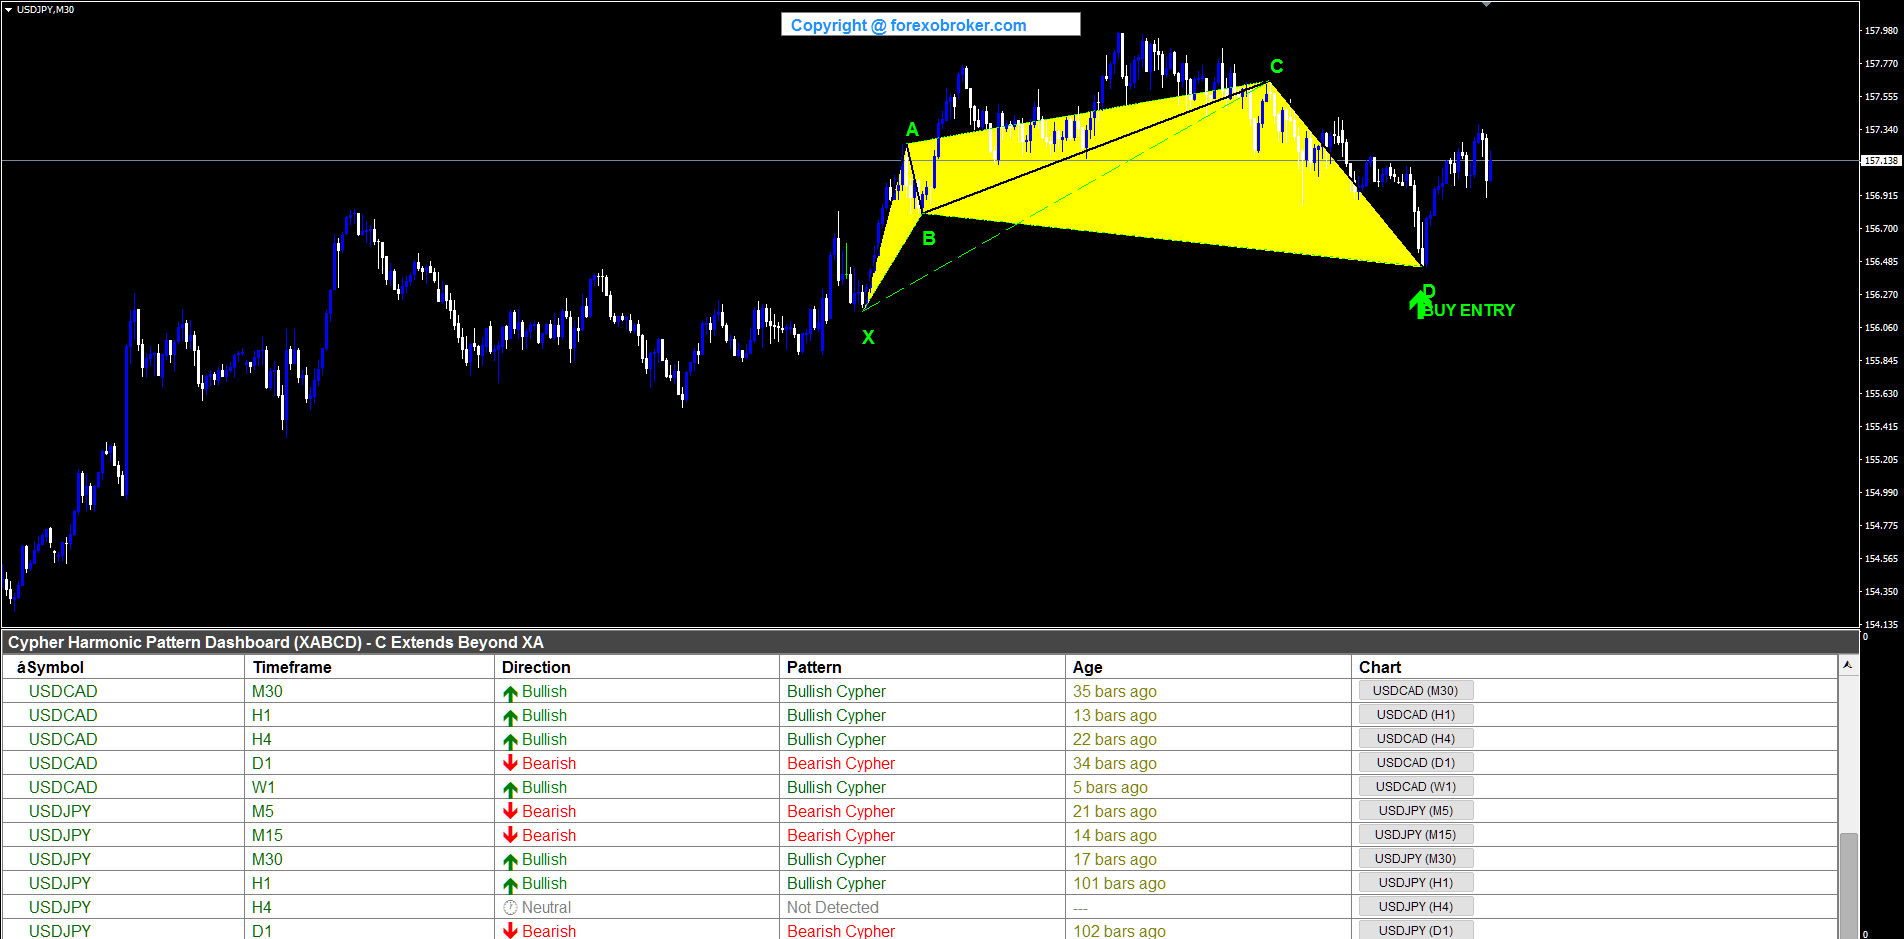
USDJPY M30 -- Bullish Cypher
The yen pair on the M30 chart produced a bullish Cypher offering an intraday long entry. X formed at a swing low, A at a swing high. B retraced downward within the 38.2%-61.8% XAB zone. C then extended above A -- the critical Cypher requirement -- reaching the 127.2%-141.4% extension of XA. D completed at a swing low, retracing 78.6% of the XC leg and staying above X, generating a BUY ENTRY signal. The pattern showed the characteristic Cypher shape where the ABC triangle widened beyond the XAB triangle due to C's extension past A. The dashboard captured this M30 setup alongside patterns on other timeframes, demonstrating the multi-timeframe scanning capability.
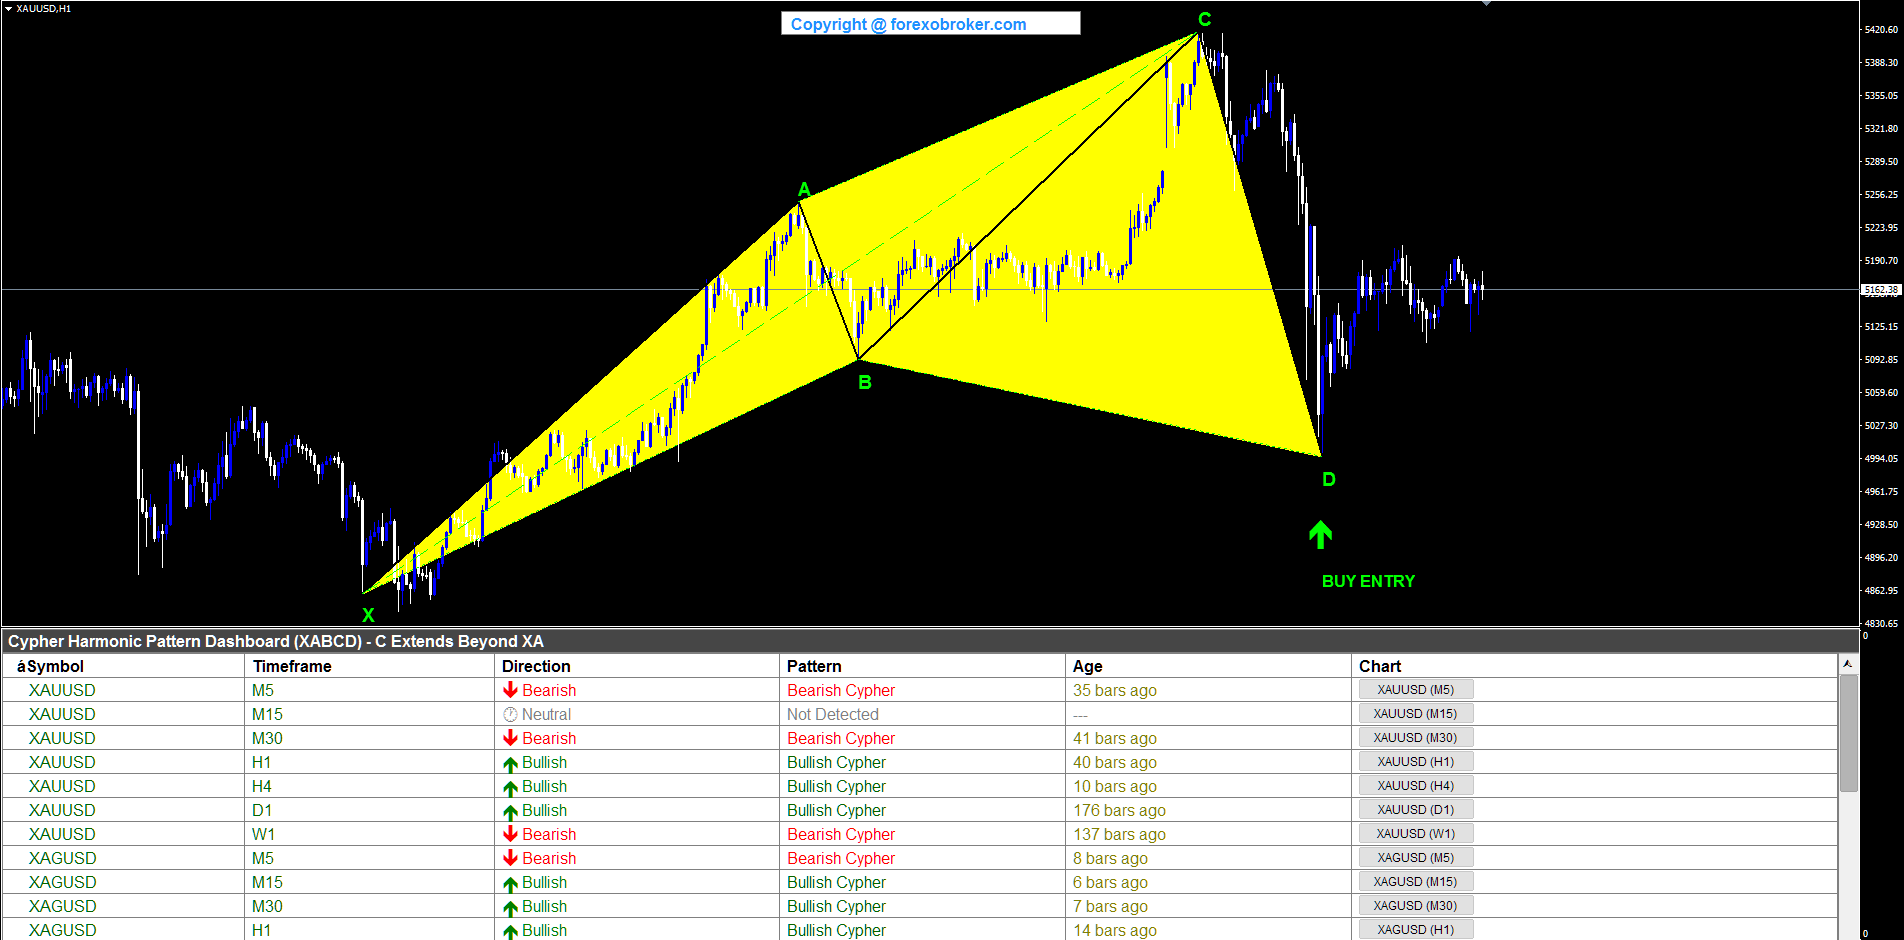
XAUUSD H1 -- Bullish Cypher
Gold on the H1 chart displayed a bullish Cypher with clearly defined extension geometry. X established at a swing low, A surged to a swing high. B retraced to the 38.2%-61.8% zone of XA, and C extended above A into the 127.2%-141.4% Fibonacci extension zone. The gold market's tendency to produce extended moves made the C-point extension particularly prominent on the chart. D completed at a swing low, retracing 78.6% of the full XC leg, with the BUY ENTRY arrow marking the completion point. The three yellow triangles were prominently visible on the gold chart, and the dashed X-C line clearly showed the extended leg used for D's retracement calculation. The pattern offered a long entry at a zone where the Fibonacci-defined 78.6% XC retracement coincided with a natural support level.
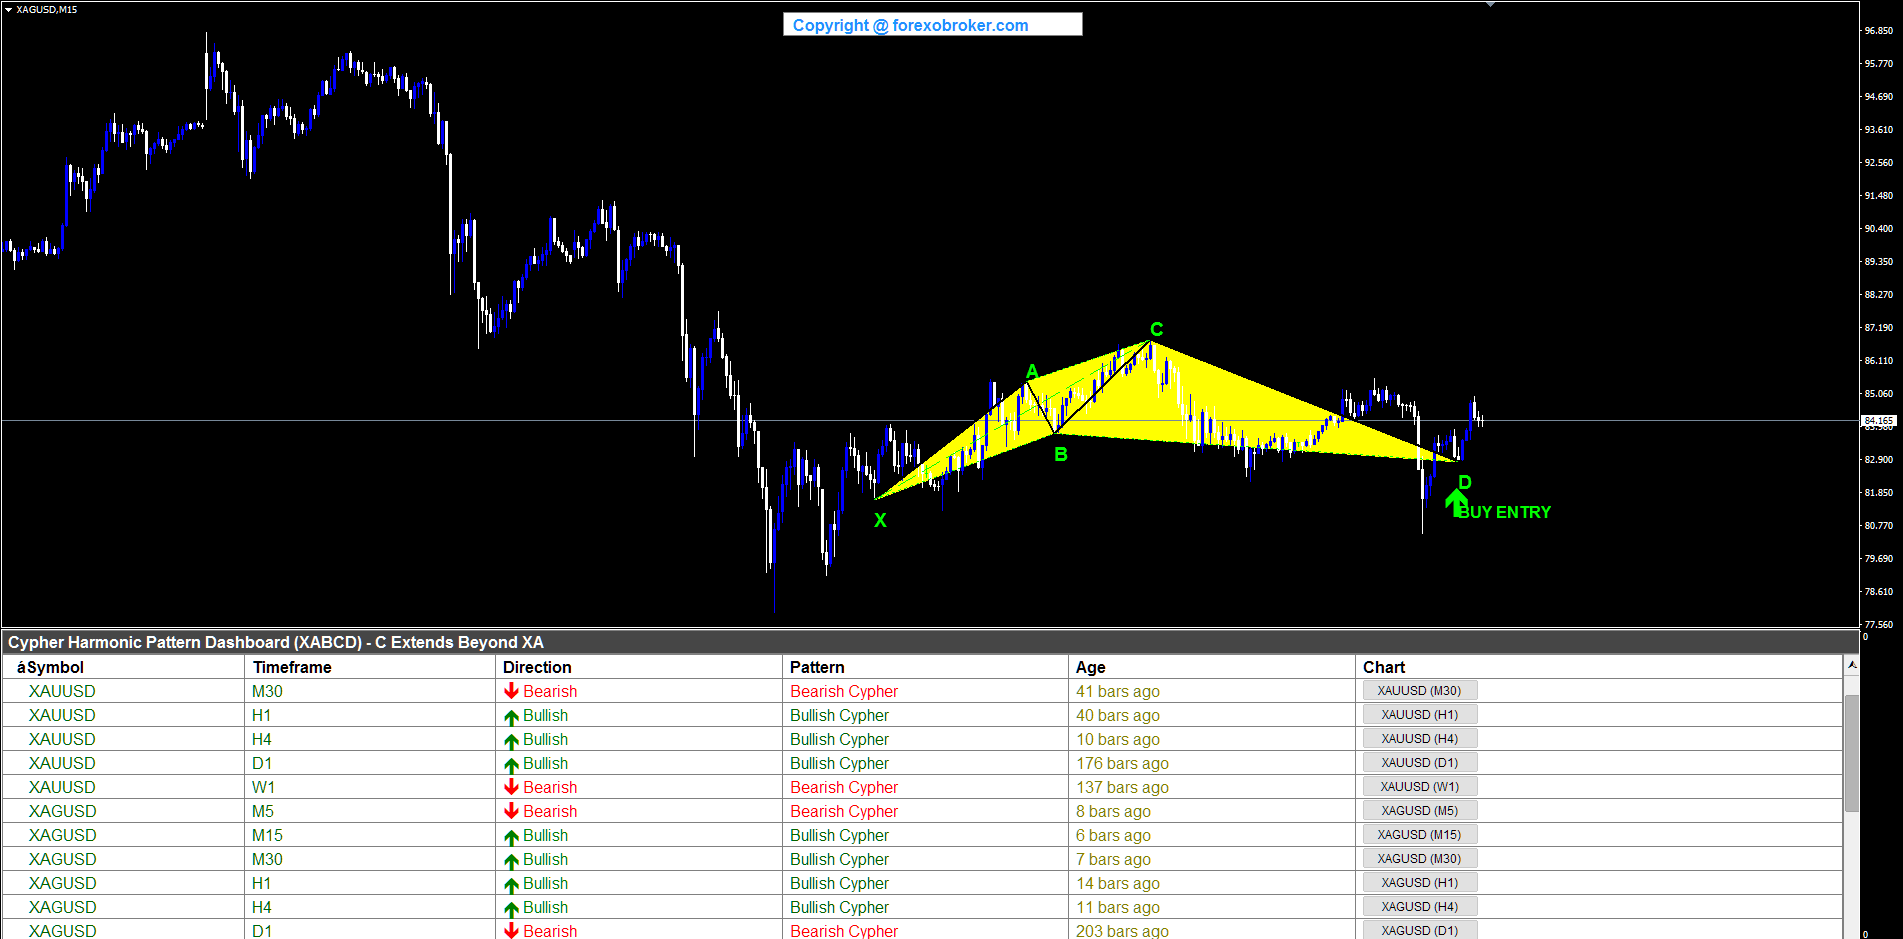
XAGUSD M15 -- Bullish Cypher
Silver on the M15 timeframe formed a bullish Cypher signaling an intraday long opportunity. X was identified at a swing low, A at a swing high. B retraced within the 38.2%-61.8% XAB range, and C extended above A to the 127.2%-141.4% extension zone. The silver market's volatility produced a clear C-point extension that made the Cypher structure immediately recognizable on the chart. D completed at a swing low at the 78.6% XC retracement level, with D staying above X as required for a bullish Cypher. The BUY ENTRY at D marked the pattern completion, and the dashboard displayed the XAGUSD M15 row alongside other active Cypher patterns, demonstrating the indicator's cross-asset scanning capability.
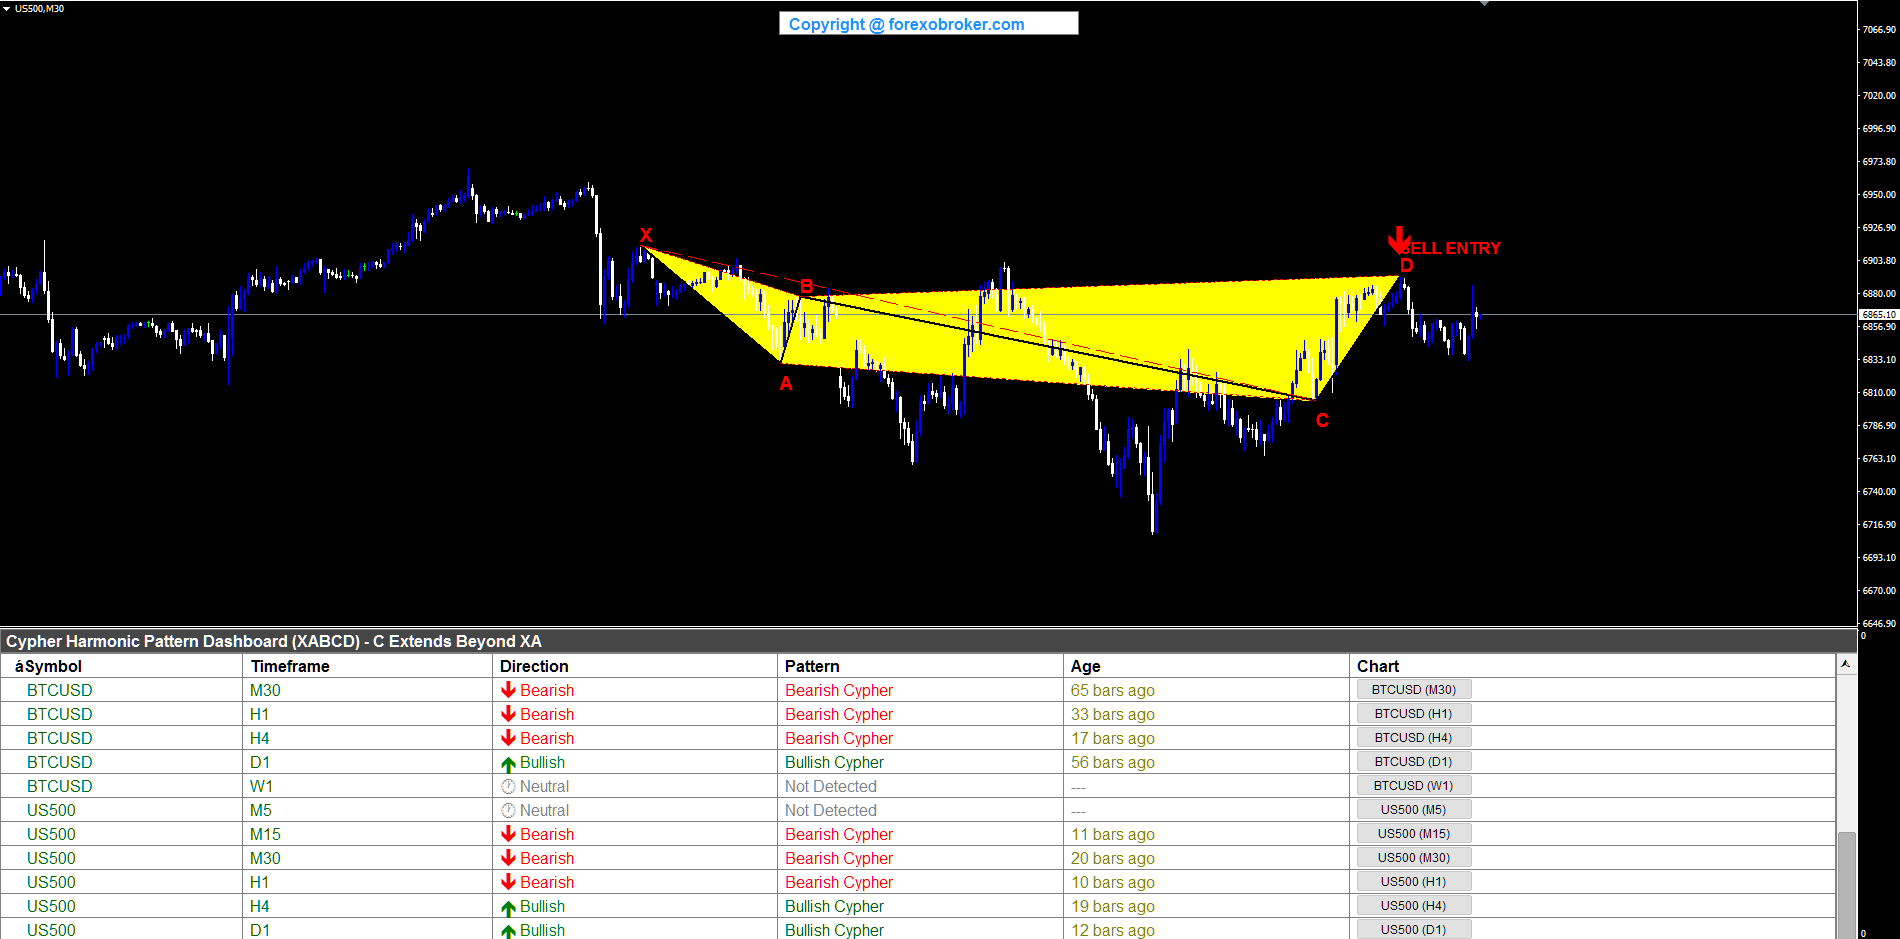
US500 M30 -- Bearish Cypher
The S&P 500 index on the M30 chart produced a bearish Cypher demonstrating that harmonic patterns occur across all asset classes. X formed at a swing high, A at a swing low. B retraced upward within the 38.2%-61.8% zone, and C extended below A into the Fibonacci extension zone -- on the index, this represented a measured overextension below the initial swing low. D completed at a swing high, retracing 78.6% of the XC leg and staying below X, generating a SELL ENTRY signal. The three yellow triangles on the index chart showed the same geometric precision as on forex pairs. The dashboard displayed the US500 row alongside forex and metals patterns, confirming the multi-asset capability.
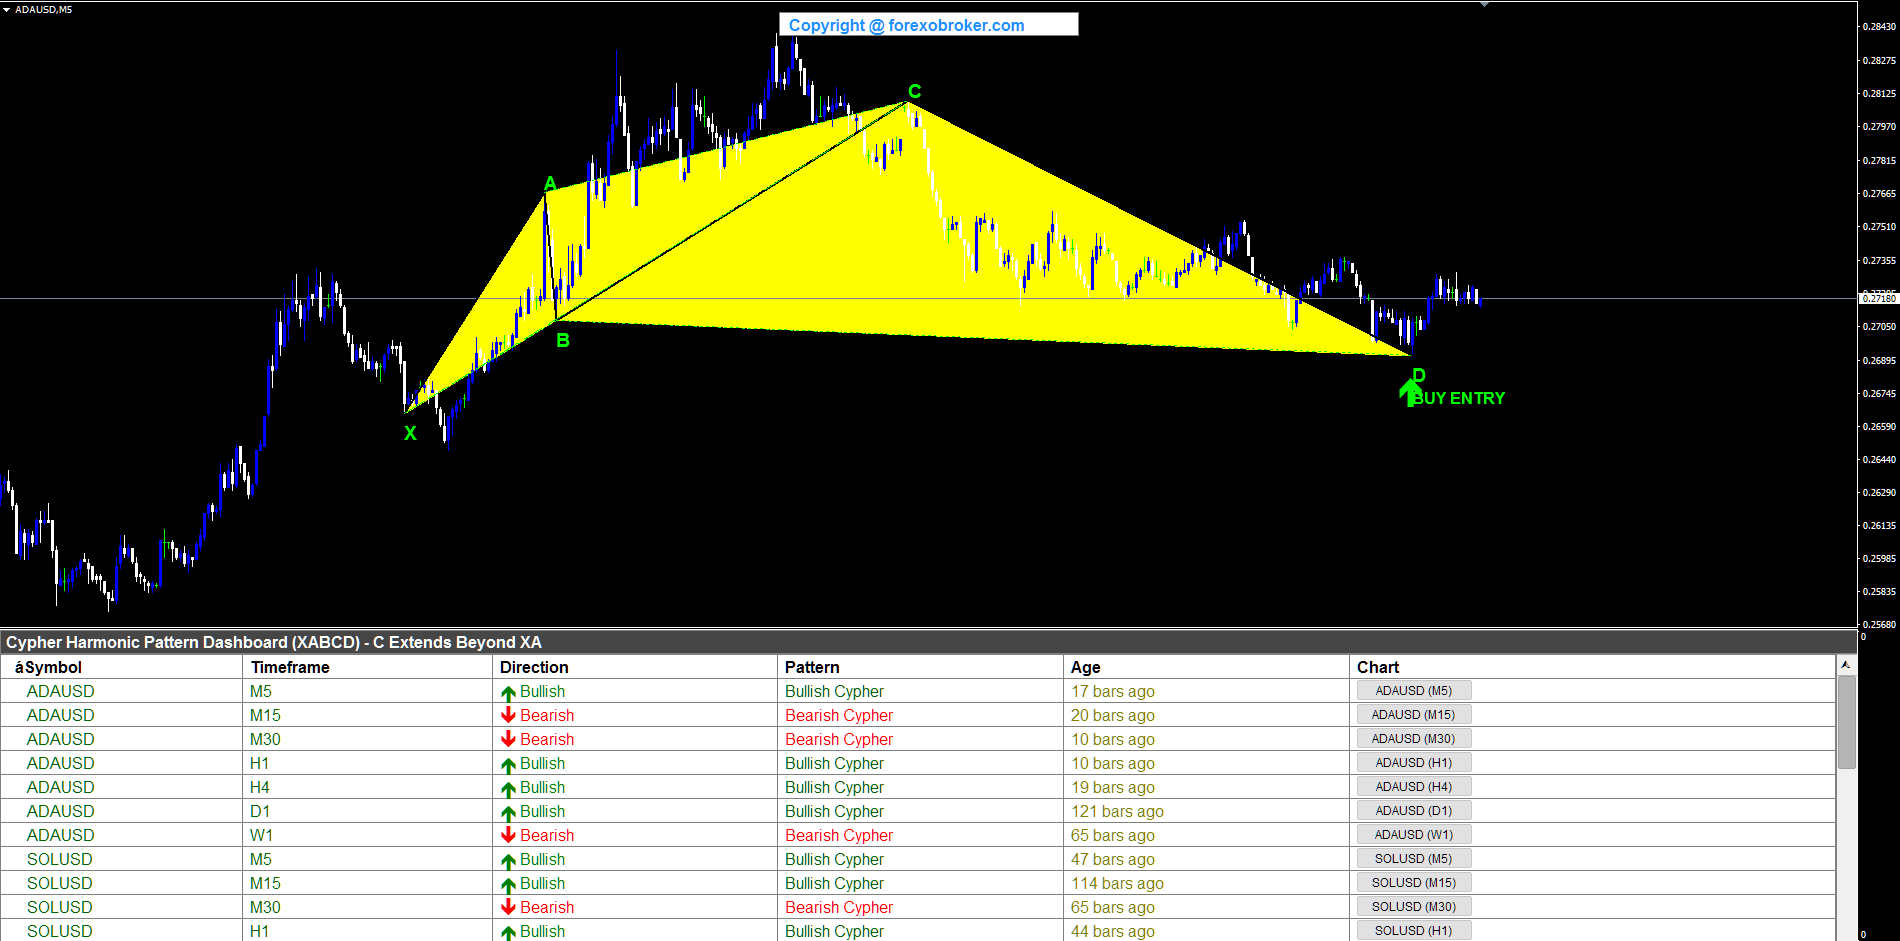
ADAUSD M5 -- Bullish Cypher
Cardano on the M5 chart formed a bullish Cypher demonstrating the pattern's applicability to cryptocurrency markets. X was established at a swing low, A at a swing high. B retraced within the 38.2%-61.8% range, and C extended above A into the 127.2%-141.4% extension zone. Crypto assets, with their higher volatility, often produce clear C-point extensions that make Cypher patterns particularly visible. D completed at a swing low at the 78.6% XC retracement, generating a BUY ENTRY. The fast M5 timeframe combined with crypto volatility produced a well-defined Cypher structure, and the dashboard captured the signal alongside patterns from traditional markets.
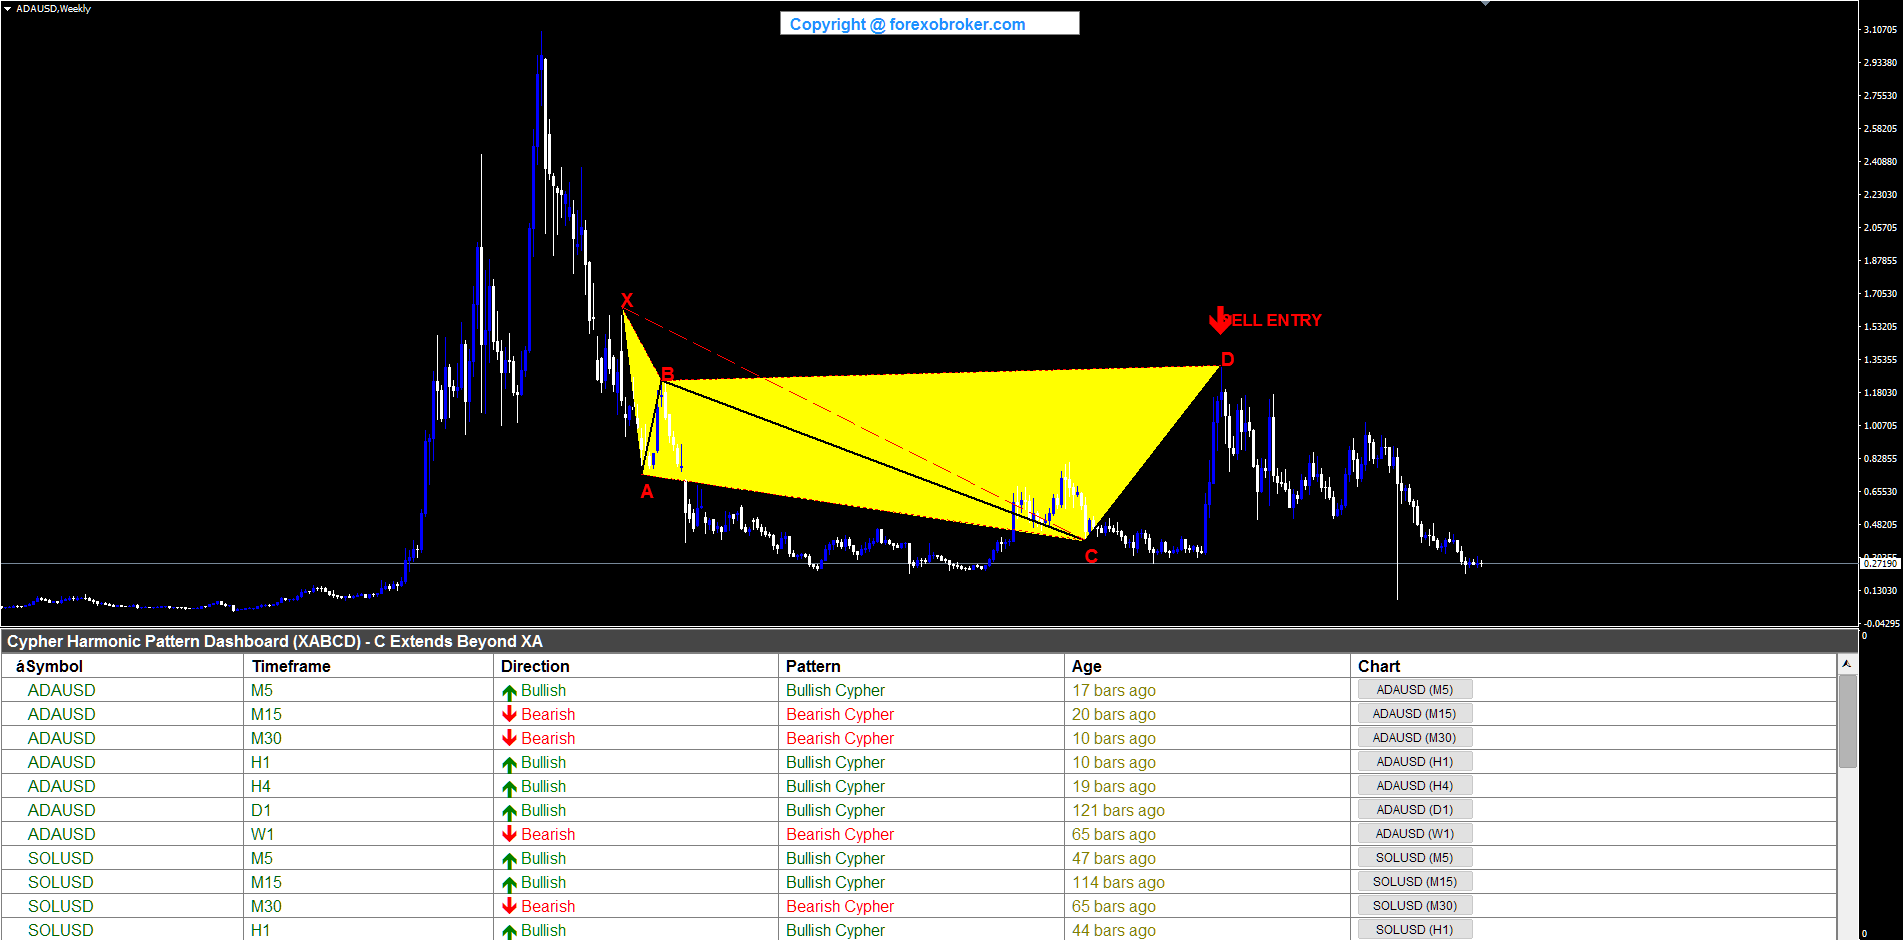
ADAUSD Weekly -- Bearish Cypher
Cardano on the Weekly chart produced a large-scale bearish Cypher spanning months of price action. X formed at a swing high, A at a deep swing low. B retraced upward within the 38.2%-61.8% XAB range, and C extended below A into the Fibonacci extension zone -- on the weekly timeframe, this C-point extension represented a significant multi-week price move below the initial swing low. D completed at a swing high, retracing 78.6% of the full XC leg, generating a SELL ENTRY at a major resistance zone. The same ADAUSD instrument producing valid Cypher patterns on both the M5 and Weekly timeframes demonstrates the fractal nature of harmonic geometry -- the mathematical relationships hold regardless of the timeframe being analyzed.
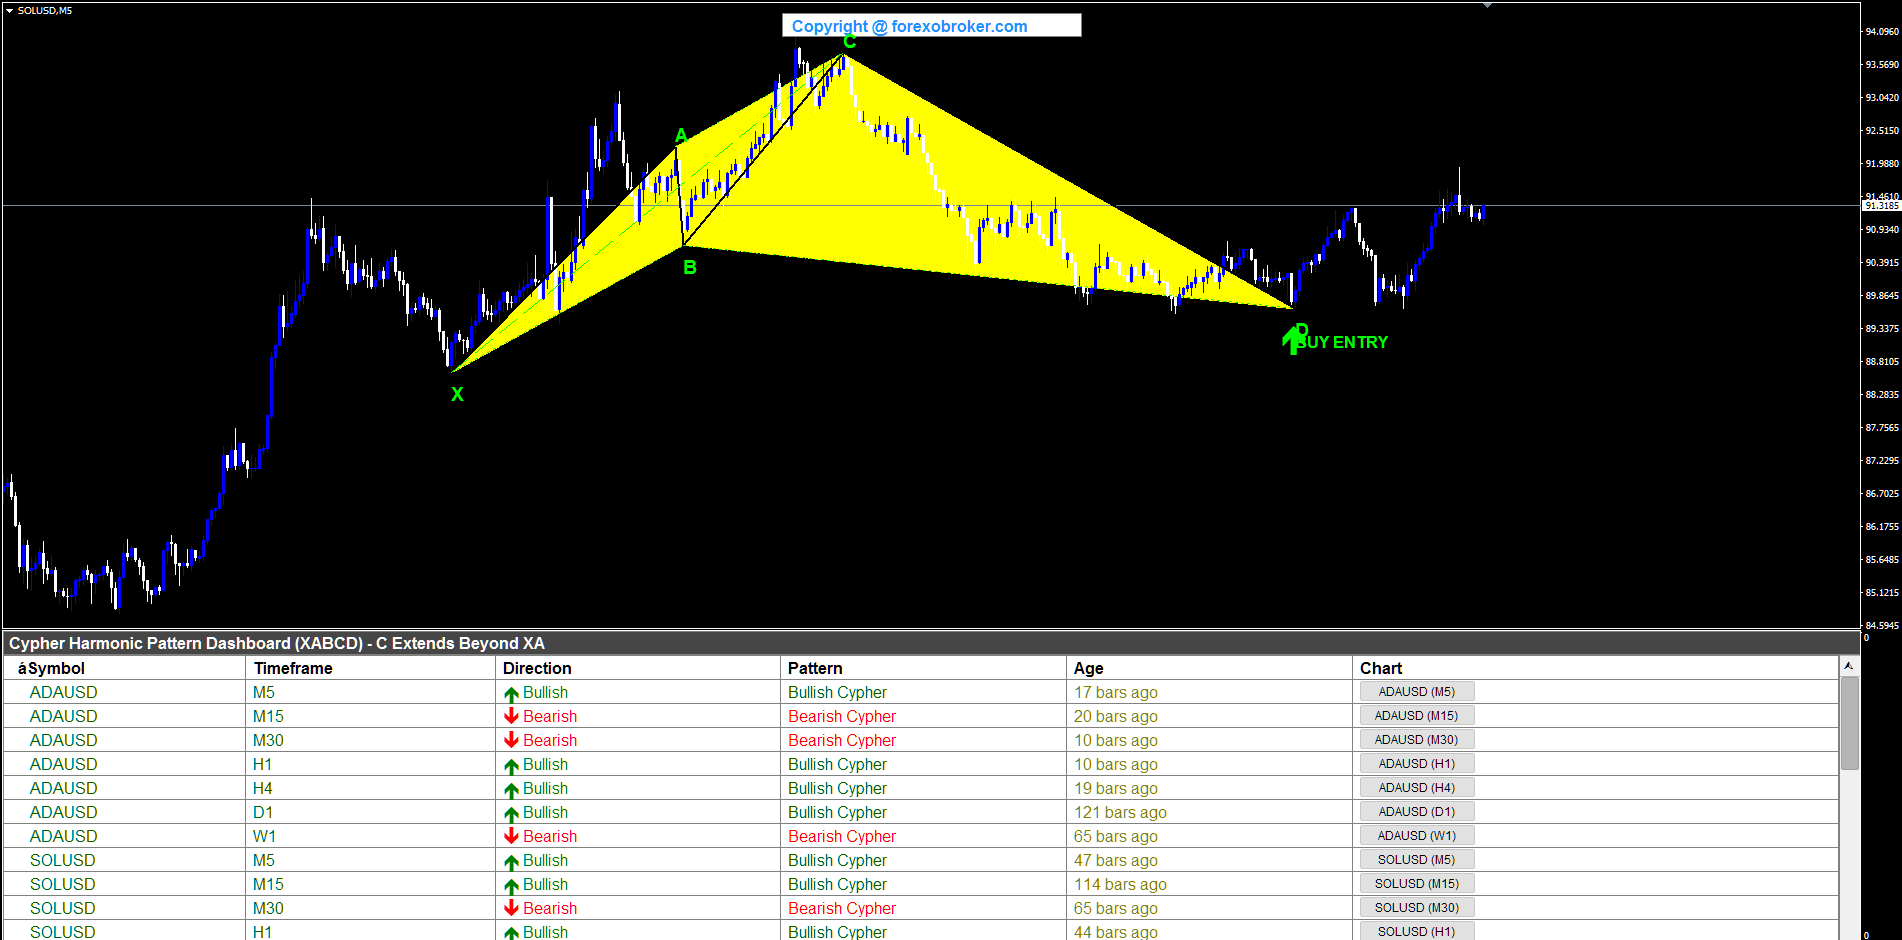
SOLUSD M5 -- Bullish Cypher
Solana on the M5 chart formed a bullish Cypher on the fast timeframe, showing the pattern's effectiveness for short-term crypto trading. X was identified at a swing low, A at a swing high. B retraced within the 38.2%-61.8% XAB zone, and C extended above A into the 127.2%-141.4% Fibonacci extension zone. D completed at a swing low at the 78.6% XC retracement level, with D staying above X. The BUY ENTRY at D offered a fast-timeframe long entry on Solana at a Fibonacci-validated support zone. The dashboard displayed the SOLUSD M5 row alongside detections from forex, metals, indices, and other crypto assets, demonstrating the indicator's comprehensive multi-asset coverage.
12. Pivot & Fibonacci Tuning Guide
The Cypher Harmonic Dashboard provides several parameters for fine-tuning pattern detection to match your trading style and the instruments you trade.
Pivot Sensitivity
| Parameter | Default | Effect of Increase | Effect of Decrease |
|---|---|---|---|
| Pivot Left Bars | 5 | Requires more bars before the pivot, finds major swings only | Finds minor swings, more patterns but lower quality |
| Pivot Right Bars | 5 | More confirmation bars needed, fewer but more reliable non-repainting patterns | Faster pattern detection, more patterns but higher false-positive risk |
For scalping on M1-M5, consider reducing pivot bars to 3-4 for faster pattern detection. For swing trading on H4-D1, the default 5 or even 7-8 gives higher-quality patterns based on significant swing points.
Cypher-Specific Fibonacci Range Tuning
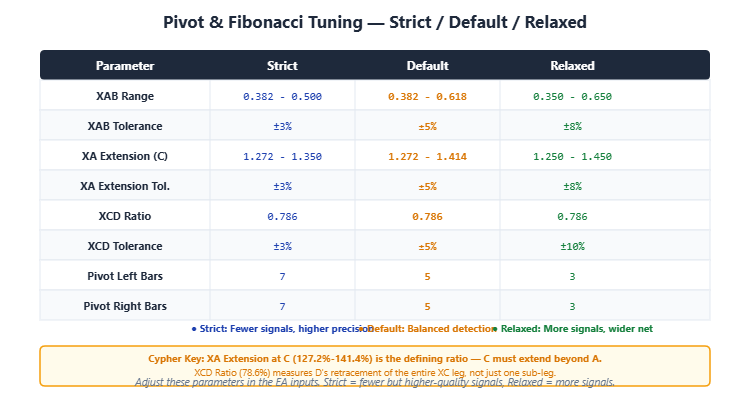
| Trading Style | XAB Range | ABC Extension Tolerance | XCD Tolerance | Patterns |
|---|---|---|---|---|
| Strict (fewer, higher-quality) | 0.45 - 0.55 | 3% | 3% | Few, high quality |
| Default (balanced) | 0.382 - 0.618 | 5% | 5% | Balanced |
| Relaxed (more patterns) | 0.35 - 0.65 | 8% | 8% | Many, wider net |
Strict settings narrow the XAB range to 0.45-0.55 (centering on the golden ratio) and tighten both the ABC extension and XCD tolerances to just 3%. For ABC extension, this creates an effective range of 1.2338 to 1.4564. For XCD, this creates an effective range of 0.7624 to 0.8096. You will see fewer signals, but each one is a near-textbook Cypher where B sits near the 50% retracement, C extends precisely to the 127.2%-141.4% zone, and D retraces almost exactly 78.6% of XC. Use this approach for major forex pairs on higher timeframes where price behavior tends to be more geometrically precise.
Default settings cover the standard Cypher ranges and work well across most instruments and timeframes. The XAB range of 0.382-0.618 allows B at any primary Fibonacci retracement level, the 5% ABC extension tolerance (effective range: 1.2084 to 1.4847) accommodates moderate variation around the ideal extension zone, and the 5% XCD tolerance (effective range: 0.7467 to 0.8253) keeps D close to the target 78.6% of XC. This is recommended for most traders starting out with the indicator.
Relaxed settings cast a wider net. The XAB range of 0.35-0.65 accepts B-point retracements further from the core Fibonacci levels, and 8% tolerances for both ABC extension (effective range: 1.1702 to 1.5271) and XCD (effective range: 0.7231 to 0.8489) allow more variation at C and D. You will see more patterns, but some will be at the edges of what would be considered valid Cypher geometry. Use this when scanning instruments with irregular price behavior (crypto assets, exotic currency pairs) where patterns tend to be less geometrically precise.
Max History Bars
The Max History Bars parameter (default: 500) controls how far back the indicator looks for pivots. Reducing this value speeds up calculation but may miss larger patterns that span many bars. Increasing it to 1000 or more allows detection of major Cypher patterns on higher timeframes but increases computation time. For most trading scenarios, 500 bars provides sufficient lookback depth to capture Cypher patterns across all enabled timeframes.
Figure 7. Pivot points require confirmation bars on each side, ensuring patterns are based on confirmed swings rather than noise.
13. Parameter Reference
Dashboard Settings
| Parameter | Default | Description |
|---|---|---|
| Symbols | EURUSD,GBPUSD,USDCAD,USDJPY | Comma-separated list of symbols to monitor (up to 20) |
| Symbol Prefix | (empty) | Broker prefix, e.g., "x" for xEURUSD |
| Symbol Suffix | (empty) | Broker suffix, e.g., ".pro" for EURUSD.pro |
| Enable M1 | false | Toggle M1 timeframe scanning |
| Enable M5 | true | Toggle M5 timeframe scanning |
| Enable M15 | true | Toggle M15 timeframe scanning |
| Enable M30 | true | Toggle M30 timeframe scanning |
| Enable H1 | true | Toggle H1 timeframe scanning |
| Enable H4 | true | Toggle H4 timeframe scanning |
| Enable D1 | true | Toggle D1 timeframe scanning |
| Enable W1 | true | Toggle W1 timeframe scanning |
| Enable MN | false | Toggle Monthly timeframe scanning |
| Visible Rows | 12 | Number of rows displayed in the dashboard |
Cypher Pattern Settings
| Parameter | Default | Description |
|---|---|---|
| Pivot Left Bars | 5 | Number of bars to the left for swing detection |
| Pivot Right Bars | 5 | Number of bars to the right for confirmation |
| XAB Min | 0.382 | Minimum XAB retracement ratio (B retraces at least 38.2% of XA) |
| XAB Max | 0.618 | Maximum XAB retracement ratio (B retraces at most 61.8% of XA) |
| ABC Min Extension | 1.272 | Minimum ABC extension ratio (C extends at least 127.2% of XA) |
| ABC Max Extension | 1.414 | Maximum ABC extension ratio (C extends at most 141.4% of XA) |
| ABC Tolerance | 0.05 | Tolerance for ABC extension range (plus or minus 5%) |
| XCD Ratio | 0.786 | Target XCD retracement ratio (D retraces 78.6% of XC leg) |
| XCD Tolerance | 0.05 | Tolerance for XCD ratio (plus or minus 5%) |
| Max History Bars | 500 | Number of historical bars to scan per symbol-timeframe |
Chart Display Settings
| Parameter | Default | Description |
|---|---|---|
| Show Cypher Pattern | true | Draw the pattern overlay on chart |
| Show BUY/SELL Arrows | true | Display entry arrows at point D |
| Show Pattern Labels | true | Display X, A, B, C, D text labels |
| Bullish Pattern Color | Lime | Color for bullish (BUY) patterns |
| Bearish Pattern Color | Red | Color for bearish (SELL) patterns |
| Pattern Fill Color | Yellow | Color for the triangle fills |
| Pattern Line Color | Black | Color for the X-A-B-C-D connecting lines |
| Arrow Size | 4 | Size of entry arrows (1-5) |
| Arrow Gap (ATR mult.) | 0.8 | Distance of arrow from price (ATR multiplier) |
Alert Settings
| Parameter | Default | Description |
|---|---|---|
| Alert Title | "Cypher Harmonic Dashboard" | Title for alert messages |
| Enable Popup Alerts | true | Show MetaTrader popup dialog |
| Enable Sound Alerts | true | Play alert sound |
| Sound File | alert2.wav | WAV file for sound alerts |
| Enable Email Alerts | false | Send email notification |
| Enable Push Notifications | true | Send mobile push notification |
14. Conclusion
The Cypher harmonic pattern is one of the most structurally distinctive formations in technical analysis. Its effectiveness comes from the convergence of three Fibonacci ratio relationships -- XAB between 38.2% and 61.8%, the ABC extension at 127.2%-141.4% of XA, and the defining XCD retracement of 78.6% of the XC leg -- that together identify high-probability reversal zones at mathematically precise locations. The C-point extension beyond A is the Cypher's signature feature, creating a geometric structure that no other harmonic pattern shares. The 78.6% XCD retracement -- the square root of 0.618 -- places the D-point completion zone at a Fibonacci level derived from the full span of the pattern, from X all the way to the extended C.
Try the free demo or get the full version on the MQL5 Market:
- MetaTrader 4: Cypher Harmonic Dashboard MT4
- MetaTrader 5: Cypher Harmonic Dashboard MT5


")

")