
Adaptive Trend Trading with Built-In Entry, Stop Loss & Take Profit: How the Volumatic VIDYA Dashboard Scans 20 Symbols

1. Introduction
You spot a clean pullback on EURUSD H1. Price just bounced off a moving average and the candle closed bullish -- a textbook entry. Now the real work begins. Where exactly do you enter? What stop loss gives you enough room without blowing the risk budget? Where is the realistic take profit? You grab a Fibonacci tool, measure the last swing, switch to an ATR indicator, calculate a multiple, scribble numbers on a notepad, and by the time you have your levels figured out, the candle that triggered the setup is three bars in the past and price has already moved twenty pips.
Now multiply that by twenty symbols across nine timeframes. Every signal you catch requires the same manual process: identify the setup, calculate the entry price, compute the stop loss, determine the take profit. Most traders either skip the math entirely -- placing stops and targets by feel -- or they burn so much time on calculations that they miss half the signals that fire across their watchlist.
The core problem is not finding signals. Indicators can do that. The problem is that almost no indicator tells you where to get in, where to get out if wrong, and where to take profit. Those three numbers -- Entry, Stop Loss, Take Profit -- are the operational backbone of every trade, and they are almost always left to the trader to figure out manually.
I built the Volumatic VIDYA Dashboard to eliminate this gap. It applies an adaptive VIDYA algorithm with ATR-based bands across all your symbols and timeframes simultaneously, detects two-bar confirmation pullback entries, and delivers every signal with pre-computed Entry, Stop Loss, and Take Profit prices directly in the dashboard. No manual calculation. No switching charts. One glance gives you everything you need to act.
The indicator is available on the MQL5 Market for both platforms:
- MetaTrader 5: Volumatic VIDYA Dashboard MT5
- MetaTrader 4: Volumatic VIDYA Dashboard MT4
2. What Is Adaptive Moving Average Trading?
Moving averages are the foundation of trend trading. They smooth price data, reveal direction, and provide dynamic support and resistance levels. But traditional moving averages -- Simple (SMA), Exponential (EMA), Weighted (WMA) -- all share the same fundamental limitation: they use a fixed smoothing factor.
A 20-period EMA applies the same weighting to every bar regardless of whether the market is trending aggressively or grinding sideways. During a strong trend, that fixed smoothing is too slow -- the average lags behind price and signals arrive late. During a choppy range, that same smoothing is too fast -- the average whipsaws back and forth, generating false crossovers that lead to losing trades.
This is not a minor inconvenience. It is a structural flaw in the way fixed moving averages interact with real market conditions. Volatility is not constant. A forex pair might trend smoothly for three weeks and then chop sideways for two. An index might consolidate for a month and then break out with explosive momentum. A fixed-period MA cannot adapt to these regime changes because its responsiveness is locked in at the time you choose the period.
Traders have tried to work around this in several ways. Some use multiple MAs at different periods and look for crossovers. Some switch periods manually depending on the "feel" of the market. Some abandon MAs entirely and use oscillators or price action alone. None of these approaches solve the underlying problem: the smoothing factor needs to change automatically based on current market conditions.
This is exactly what adaptive moving averages were designed to do. Instead of a fixed smoothing constant, an adaptive MA adjusts its responsiveness dynamically. When the market is trending strongly, the average speeds up to follow price closely. When the market is choppy or directionless, the average slows down to avoid reacting to noise.
Tushar Chande introduced one of the most elegant solutions to this problem in 1992: the Variable Index Dynamic Average (VIDYA). VIDYA is an exponential moving average whose smoothing constant is scaled by the Chande Momentum Oscillator (CMO) -- a measure of directional momentum. When momentum is high, VIDYA tracks price aggressively. When momentum is low, VIDYA barely moves. The result is an average that inherently adapts to whatever the market is doing, without any manual intervention from the trader.
3. The VIDYA Algorithm Explained
VIDYA is built on a simple but powerful idea: use an EMA as the base, but multiply its smoothing constant by a momentum ratio so the average automatically speeds up or slows down depending on how directional the market is.
The calculation proceeds in three steps:
Step 1 -- Calculate the Chande Momentum Oscillator (CMO)
The CMO measures the ratio of net momentum to total momentum over a lookback period. For each bar, compute the price change from the previous bar. Sum all positive changes ( sumPositive ) and all negative changes in absolute value ( sumNegative ) over the lookback window. Then:
CMO = |100 x (sumPositive - sumNegative) / (sumPositive + sumNegative)|
The absolute value ensures CMO ranges from 0 to 100. A CMO of 100 means all price changes over the lookback were in the same direction -- pure trend. A CMO near 0 means positive and negative changes were roughly equal -- a choppy, directionless market.
Step 2 -- Calculate the adaptive smoothing constant (alpha)
The base alpha is derived from the VIDYA EMA period, just like a standard EMA:
alpha = 2 / (VidyaLength + 1)
With the default VidyaLength = 5 , alpha equals approximately 0.333. This is the maximum possible smoothing -- the speed VIDYA would run at if market momentum were at 100%.
Step 3 -- Apply the adaptive weighting
The final VIDYA value combines the base alpha with the CMO ratio:
VIDYA = alpha x (CMO / 100) x Price + (1 - alpha x CMO / 100) x previousVIDYA
When CMO is high (strong trend), the term alpha x (CMO / 100) approaches its maximum, and VIDYA closely tracks the current price. When CMO is low (choppy market), that term approaches zero, and VIDYA stays close to its previous value -- effectively freezing in place and refusing to react to noise.
This is the key insight. VIDYA does not just smooth price data. It decides how much to smooth on every single bar based on empirical momentum. A fixed EMA with period 5 would be extremely responsive all the time -- great in trends, terrible in ranges. VIDYA with period 5 is responsive only when the CMO confirms that price is actually moving directionally. The rest of the time, it acts like a much longer-period average.
Figure 1. The three-step VIDYA calculation: CMO measurement, adaptive alpha, and the final weighted average.
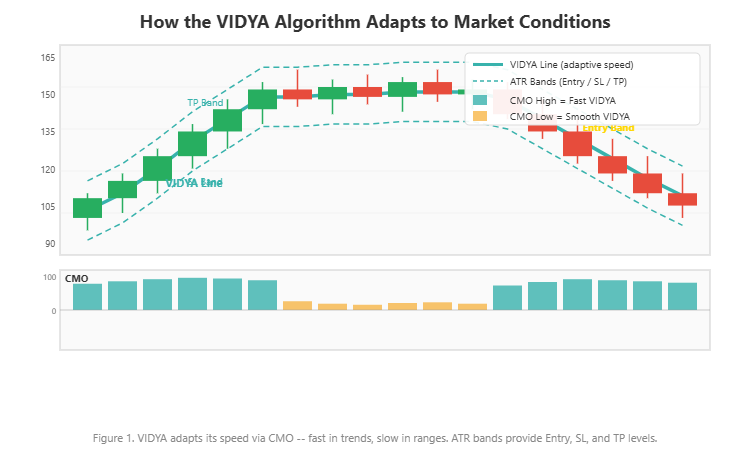
In the Volumatic VIDYA Dashboard, the default parameters are VidyaLength = 5 and CMO Lookback = 20 . The short EMA base gives VIDYA the potential for fast response, while the 20-bar CMO window provides a stable momentum reading that prevents the average from overreacting to single-bar spikes.
4. CMO: The Intelligence Behind VIDYA
The Chande Momentum Oscillator deserves closer attention because it is the component that makes VIDYA adaptive. Without it, VIDYA would simply be a standard EMA. The CMO is what gives VIDYA its ability to distinguish trending markets from ranging ones.
CMO works by comparing the total upward movement against the total downward movement over a fixed lookback period. If price has been rising consistently -- most bars closing higher than the previous bar -- then sumPositive will be much larger than sumNegative , and the CMO will be close to 100. If price has been moving erratically, with roughly equal numbers of up and down bars, the two sums will be similar, and the CMO will be close to 0.
The lookback period (default: 20 bars) controls how far back the CMO measures momentum. A shorter lookback, say 10 bars, makes the CMO more reactive to recent momentum shifts. This means VIDYA will speed up and slow down more frequently. A longer lookback, say 40 bars, smooths out the momentum reading and makes VIDYA's adaptive behavior more gradual.
Consider a practical example. EURUSD has been trending upward for 15 bars, with 13 of those bars closing higher. The CMO over 20 bars reads approximately 75. VIDYA's effective smoothing is 0.333 x 0.75 = 0.25 -- roughly equivalent to a 7-period EMA. VIDYA tracks price closely and provides a tight dynamic support level.
Now the trend stalls. Over the next 10 bars, price chops sideways with 5 up bars and 5 down bars. The CMO drops to around 15. VIDYA's effective smoothing becomes 0.333 x 0.15 = 0.05 -- equivalent to approximately a 39-period EMA. VIDYA barely moves, refusing to chase the noise. Any pullback to this now-flat VIDYA level represents a much more significant touch -- one that is worth paying attention to.
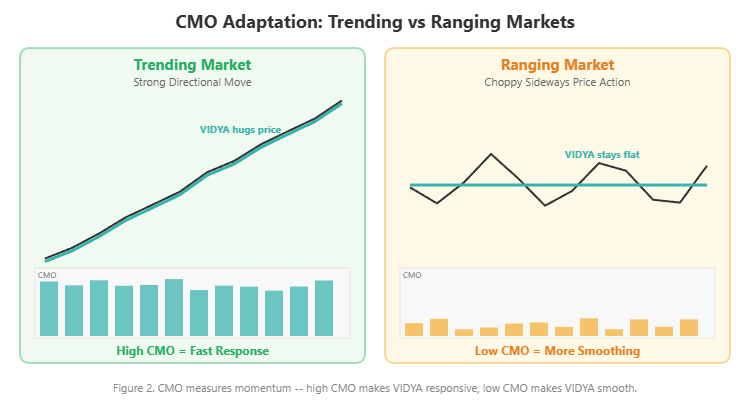
This dynamic behavior is precisely what makes VIDYA-based signals more reliable than fixed-MA signals. The indicator automatically tightens during trends (providing close support/resistance for pullback entries) and flattens during ranges (avoiding the false signals that plague fixed averages).
Figure 2. CMO values near 100 produce fast VIDYA response (trending); values near 0 produce slow response (ranging).
5. Why Manual Scanning Fails
Understanding VIDYA theory is one thing. Applying it across a full watchlist is entirely another.
Suppose you monitor 20 symbols across 9 timeframes. That is 180 individual chart views. For each one, you would need to: (1) apply the VIDYA indicator, (2) check if the current trend is up or down, (3) determine if a pullback to the VIDYA band just occurred, (4) verify the two-bar confirmation pattern, and if all conditions are met, (5) calculate the Entry price from the VIDYA band level, (6) compute the Stop Loss from the extended ATR band, and (7) determine the Take Profit from the opposite ATR band.
That is seven steps per chart and 180 charts to check. Even at two minutes per chart -- and that is optimistic once you factor in the calculations -- you are looking at six hours of scanning. No trader has that kind of time, so compromises get made. You check your favorite pairs on your favorite timeframes and ignore the rest. The GBPUSD H4 pullback that would have been a clean 3:1 winner goes unnoticed because you never looked at it.
But the chart scanning is only half the problem. The other half is the level calculation. Even if you could scan all 180 charts instantly, every signal still requires you to compute three prices: Entry, Stop Loss, and Take Profit. These are not arbitrary numbers. They depend on the current VIDYA value, the current ATR, and specific multipliers that determine how far from VIDYA each level sits. Getting them wrong -- placing a stop too tight or a target too far -- directly impacts your win rate and reward-to-risk ratio.
Most traders who use VIDYA or similar adaptive averages end up "eyeballing" their levels. They see price pull back to the average, enter at the current market price (not the band level), set a stop loss at some round number below the recent swing low, and use a fixed pip target. This ad-hoc approach throws away the mathematical precision that VIDYA's ATR bands are designed to provide.
Figure 3. Manual process: 7 steps per chart across 180 combinations, plus level calculations for every signal.
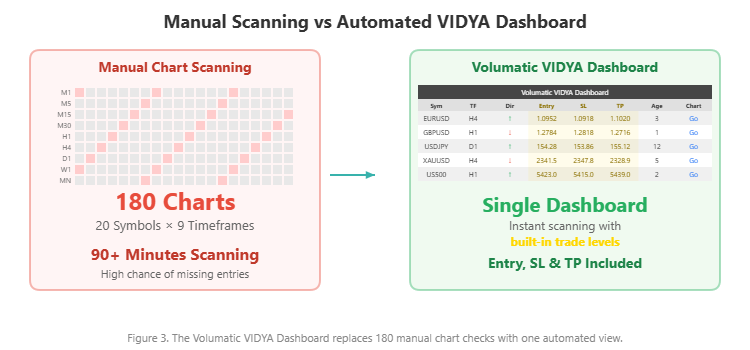
The Volumatic VIDYA Dashboard was built specifically to solve both problems simultaneously: automate the scanning across all symbol/timeframe combinations AND deliver pre-calculated Entry, Stop Loss, and Take Profit prices for every signal that fires.
6. Introducing the Volumatic VIDYA Dashboard
The Volumatic VIDYA Dashboard is a multi-symbol, multi-timeframe adaptive trend scanner that combines VIDYA-based pullback detection with built-in trade level computation. It monitors up to 20 symbols across 9 timeframes and displays every confirmed signal in an interactive 8-column dashboard -- complete with Entry, Stop Loss, and Take Profit prices.
Key features:
- VIDYA-based adaptive detection: Uses the Variable Index Dynamic Average with CMO weighting for intelligent trend identification
- Built-in Entry, SL, and TP prices: Every signal comes with pre-computed trade levels based on ATR band distances
- Two-bar confirmation: Requires a pullback to the VIDYA band followed by a confirming close -- no single-bar triggers
- Non-repainting signals: Evaluates bar 1 only (last fully closed bar) -- signals never disappear once confirmed
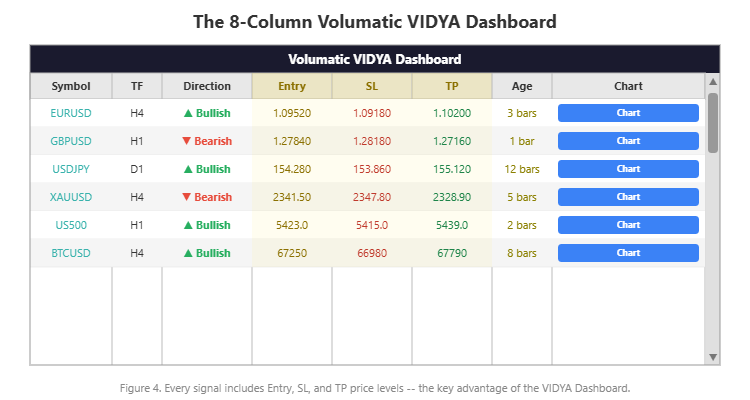
- 8-column interactive dashboard: Symbol, Timeframe, Direction, Entry, SL, TP, Age, Chart
- One-click chart navigation: Click any "Chart" button to switch your chart to that signal with arrows drawn at the entry point
- Filter & Sort mode: Optionally sort signals by recency to surface the freshest setups first
- 4-channel alerts: Popup, sound, email, and push notifications -- each alert includes Entry, SL, and TP values in the message
- Broker prefix/suffix support: Works with any broker naming convention
The indicator is available on the MQL5 Market with a free demo download:
- MetaTrader 5: Volumatic VIDYA Dashboard MT5
- MetaTrader 4: Volumatic VIDYA Dashboard MT4
Figure 4. The Volumatic VIDYA Dashboard with 8 columns including Entry, SL, and TP for every signal.
7. How the Detection Engine Works
Under the hood, the Volumatic VIDYA Dashboard runs a complete VIDYA calculation with ATR band computation independently for each symbol/timeframe combination. Here is how the engine operates step by step.
VIDYA Calculation: For each combination, the engine computes the CMO over the InpVidyaMomentum lookback period (default: 20 bars), then applies the adaptive EMA formula with InpVidyaLength as the base period (default: 5). This produces the central VIDYA line -- the adaptive moving average that speeds up in trends and slows down in ranges.
ATR Band Construction: A 200-period ATR is calculated for each symbol/timeframe. Three sets of bands are constructed around the VIDYA line:
- Entry Band: VIDYA +/- ATR x InpBandDistance (default: 2.0). This is where pullback entries are detected.
- Stop Loss Band: VIDYA +/- ATR x InpExtraMultiplier (default: 2.0). This defines the protective stop level beyond the entry band.
- Take Profit Band: VIDYA +/- ATR x InpTPMultiplier (default: 4.0). This sets the profit target on the opposite side.
Trend Detection: The engine determines the prevailing trend by checking whether price has broken above the upper Entry Band (uptrend) or below the lower Entry Band (downtrend). Once a trend break occurs, the trend direction remains active until the opposite break happens.
Two-Bar Confirmation: This is the signal trigger. For a BUY signal: the previous bar's low must touch or penetrate the lower VIDYA band (the pullback), AND the current bar must close bullish (close > open), AND an uptrend must be active. For a SELL signal: the previous bar's high must touch or penetrate the upper VIDYA band, AND the current bar must close bearish, AND a downtrend must be active.
This two-bar pattern ensures that signals are not generated on random bar closes. Price must first demonstrate a pullback into the VIDYA band zone and then show a confirming reversal candle. This dramatically reduces false signals compared to single-bar triggers.
Non-Repainting Mechanism: All signal detection is performed on bar 1 -- the last fully closed bar. Since a closed bar's OHLC values never change, the signal is permanent once it appears. The dashboard never evaluates bar 0 (the currently forming bar), so there is no possibility of a signal appearing and then vanishing.
Level Assignment: When a signal is confirmed, the engine records the Entry price (the VIDYA band level that was touched), the Stop Loss price (the extended ATR band beyond the entry), and the Take Profit price (the opposite ATR band). These three values are displayed directly in the dashboard columns and included in any alert messages.
8. The 8-Column Dashboard
The dashboard displays eight columns of information for each confirmed signal:
| Column | Content | Purpose |
|---|---|---|
| Symbol | Instrument name (e.g., EURUSD) | Identifies the market |
| Timeframe | Period (e.g., H4, M15) | Identifies the chart timeframe |
| Direction | BUY or SELL with arrow icon | Shows the signal direction |
| Entry | Computed entry price | The VIDYA band level where the pullback was detected |
| SL | Computed stop loss price | The extended ATR band beyond the entry |
| TP | Computed take profit price | The opposite ATR band target |
| Age | Number of bars since signal | Measures signal freshness |
| Chart | Clickable button | Navigates chart to this signal |
The Entry, SL, and TP columns are what set this dashboard apart from standard signal scanners. Instead of simply telling you "BUY EURUSD H1" and leaving the rest to you, the dashboard delivers the three operational numbers you need to place a trade immediately. The Entry price is derived from the VIDYA band that triggered the pullback. The SL price is set at the protective ATR band (VIDYA minus ATR x 2.0 for buys). The TP price targets the extended band on the profitable side (VIDYA plus ATR x 4.0 for buys).
The dashboard is fully interactive. Use your mouse wheel to scroll through rows when the signal count exceeds the visible row limit (default: 12 rows). Click the up/down arrow buttons or drag the scrollbar for rapid navigation. The Filter Recent mode ( InpFilterRecent ), when enabled, sorts all signals by age so the freshest entries appear at the top -- useful when you have dozens of active signals and want to focus only on the most recent setups.
Figure 5. The 8 columns in detail -- Entry, SL, and TP are computed automatically for every signal.
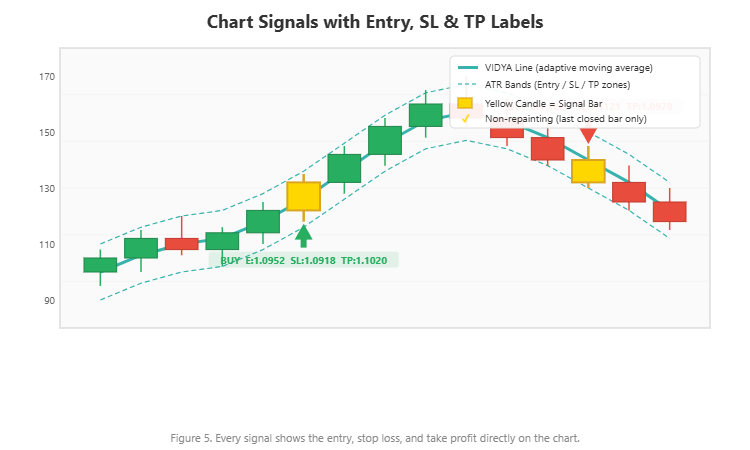
The Chart button is the key workflow element. Clicking it instantly switches your chart to the corresponding symbol and timeframe, draws BUY or SELL arrows at the signal locations (Lime for buys, Red for sells, size 4), and visually marks the entry point. Combined with a 15-period SMA overlay on the chart, you can immediately see the price context around the signal.
9. 4-Channel Alert System
The Volumatic VIDYA Dashboard supports four independent alert channels:
- Popup alerts: On-screen notification within MetaTrader
- Sound alerts: Audible alert using a configurable WAV file
- Email alerts: Sent to the email configured in MetaTrader's Tools > Options > Email
- Push notifications: Delivered to the MetaTrader mobile app via MetaQuotes ID
By default, popup, sound, and push notifications are enabled, while email is disabled. Each channel can be toggled independently.
What makes the alert system particularly valuable is the message format. Every alert includes the full signal details with computed levels:
Volumatic VIDYA Dashboard: EURUSD BUY on H1 | Entry: 1.09500 | SL: 1.09200 | TP: 1.09900
This means you can act on an alert without even opening the dashboard. A push notification arrives on your phone with the symbol, direction, timeframe, entry price, stop loss, and take profit -- everything you need to place a pending order from any device with MT4/MT5 mobile access.
The alert system includes smart deduplication. Once an alert fires for a specific symbol/timeframe/direction combination, it will not repeat until a new signal forms. This prevents alert flooding when monitoring many combinations simultaneously. A typical setup: configure the dashboard on your VPS or home computer with push notifications enabled, and receive real-time adaptive trend signals with complete trade levels on your phone wherever you are.
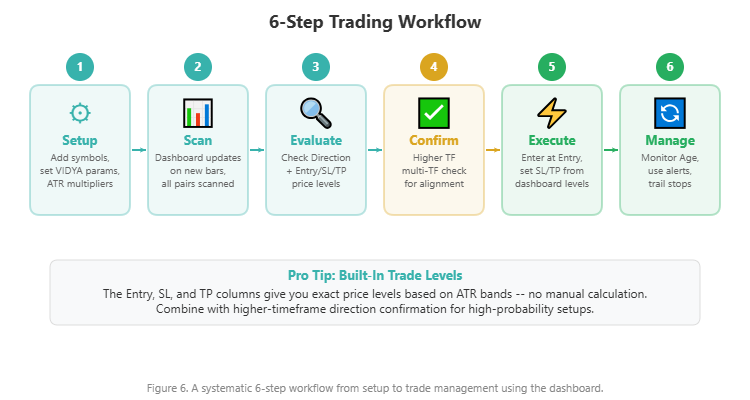
10. Practical Trading Workflow
Here is a step-by-step approach to trading with the Volumatic VIDYA Dashboard:
Step 1 -- Setup: Enter your symbols in the Symbols input (comma-separated, up to 20). The default list includes EURUSD, GBPUSD, USDCAD, and USDJPY, but you can add metals (XAUUSD), indices (US500), crypto (BTCUSD), or any instrument your broker offers. Enable the timeframes you want to monitor -- by default, M5 through W1 are active, while M1 and MN are disabled. Adjust the VIDYA parameters only if you have a specific reason; the defaults are well-tested across most instruments.
Step 2 -- Scan the Dashboard: The dashboard updates automatically when new bars close. Watch for fresh signals -- rows where the Age column shows 1 to 5 bars are the most actionable. If you have many active signals, enable Filter Recent mode to sort by age and bring the freshest setups to the top.
Step 3 -- Read the Levels: Before clicking through to any chart, read the Entry, SL, and TP values directly from the dashboard row. Calculate the reward-to-risk ratio mentally: (TP - Entry) / (Entry - SL) for buys, or (Entry - TP) / (SL - Entry) for sells. With default multipliers (Entry band 2.0, SL band 2.0, TP band 4.0), the typical reward-to-risk is approximately 2:1 to 3:1 depending on the VIDYA position relative to the bands.
Step 4 -- Visual Confirmation: Click the "Chart" button to jump directly to the signal. The chart will display the symbol and timeframe with BUY or SELL arrows drawn at the signal location. Examine the price action context: Is the signal occurring at a key support or resistance level? Is there confluence with other analysis? Is the higher timeframe trend aligned?
Step 5 -- Execute the Trade: If the setup meets your criteria, place your order using the Entry, SL, and TP prices from the dashboard. For a BUY signal, set a limit order at the Entry price (if price has not yet reached it) or enter at market if price is near the level. Set the stop loss at the SL price and the take profit at the TP price. The levels are already normalized and ATR-calibrated -- no additional calculation is needed.
Step 6 -- Monitor and Manage: Use the Age column to track how long your signal has been running. Set alerts for your symbols so you are notified if a new signal fires in the opposite direction, indicating a potential trend change. If a SELL signal appears on the same symbol/timeframe where you hold a BUY position, it may be time to close or tighten your stop.
Figure 6. A practical 6-step workflow from dashboard scan to trade execution with pre-computed levels.
11. Real Trade Examples
The following screenshots show the Volumatic VIDYA Dashboard in action across different asset classes and timeframes. Each example was captured from a live MetaTrader chart running the indicator with default settings.
EURUSD H1 -- Forex Major with Entry/SL/TP Labels
The EURUSD H1 chart shows both a BUY and SELL signal with full Entry, Stop Loss, and Take Profit labels visible on the chart. The BUY signal near the bottom of the move displays "BUY E:1.17882 SL:1.17654 TP:1.18337" -- each level computed automatically from the VIDYA line and ATR bands. Further along, a SELL signal appears with "SELL E:1.17859 SL:1.18089 TP:1.17399" as the trend reversed. The dashboard panel at the bottom highlights the EURUSD H1 row, confirming the active signal on this timeframe. Notice how the Entry and SL values are close together (the 2.0x ATR stop loss band), while the TP sits much further away (the 4.0x ATR take profit band), giving the trade a favorable reward-to-risk ratio. Price had been in an extended downtrend before the BUY signal caught the pullback recovery -- a textbook VIDYA band touch with two-bar confirmation.
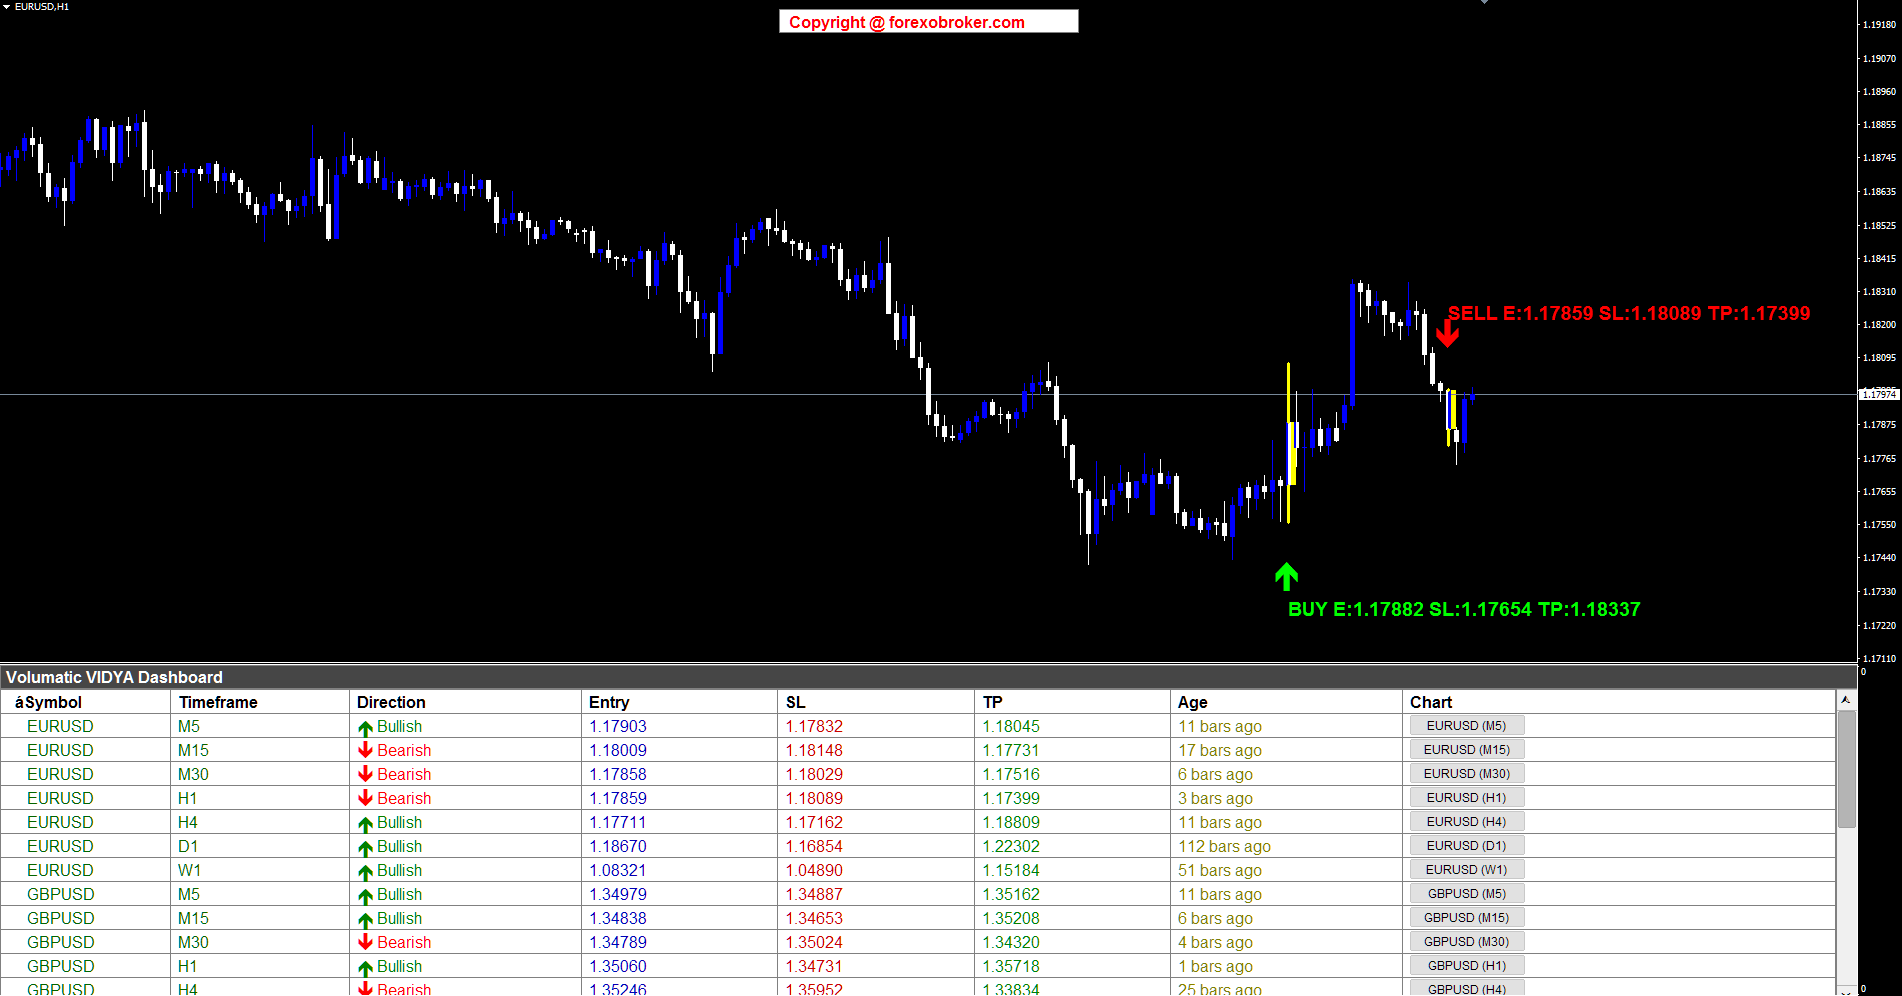
Figure 8. EURUSD H1 showing BUY and SELL signals with computed Entry, SL, and TP labels displayed directly on the chart.
GBPUSD M5 -- Fast Scalping with Dual Signals
This GBPUSD M5 chart demonstrates how the indicator performs on the shortest practical timeframe. A SELL signal at the top of the move displays "SELL E:1.35152 SL:1.35258 TP:1.34940" where price touched the upper VIDYA band during a downtrend and confirmed with a bearish close. Later, a BUY signal at the bottom shows "BUY E:1.34979 SL:1.34887 TP:1.35162" as the trend reversed and price pulled back to the lower VIDYA band. The dashboard shows both EURUSD and GBPUSD rows across multiple timeframes, with the GBPUSD M5 row highlighted in yellow -- confirming this is the chart the dashboard navigated to. The yellow-highlighted candle marks the exact bar where the signal confirmed. The tight ATR-calibrated levels on M5 make these ideal scalping setups: the stop loss distance on the SELL is only about 10 pips (1.35258 minus 1.35152), while the take profit targets over 20 pips.
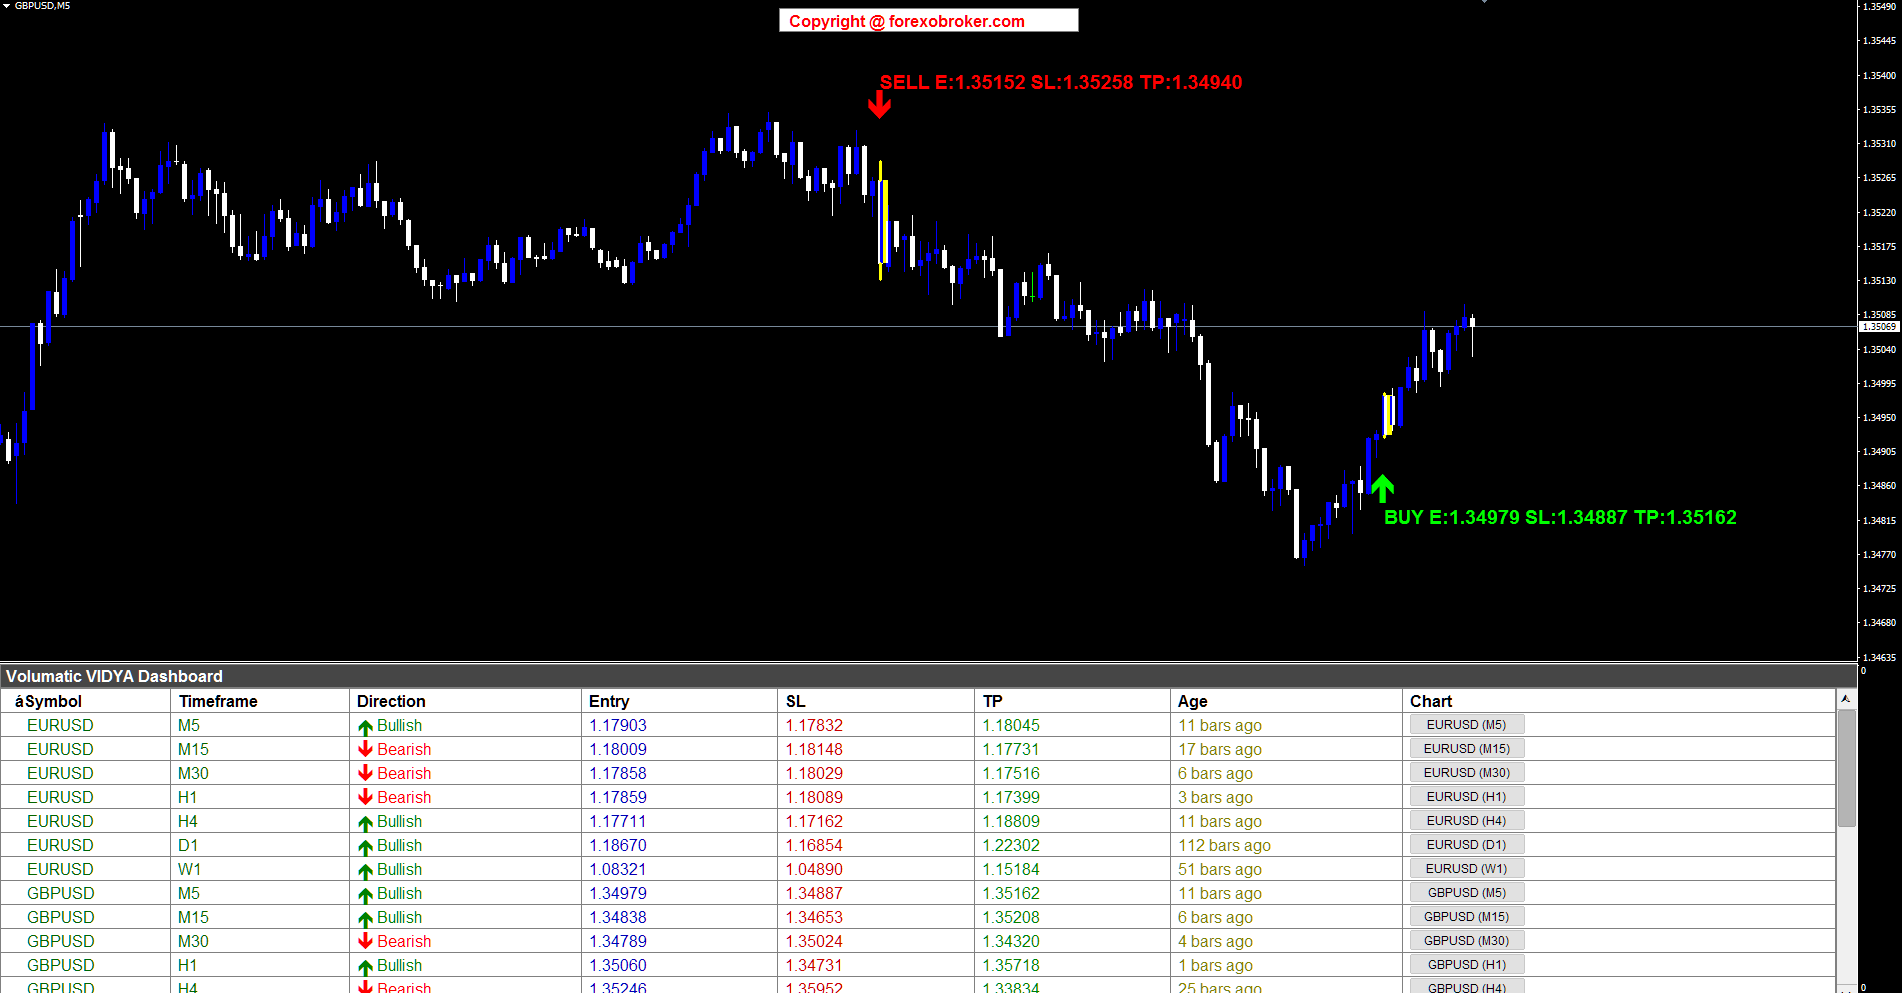
Figure 9. GBPUSD M5 with SELL and BUY signals -- tight ATR-calibrated levels perfect for scalping.
USDJPY M5 -- Yen Cross Trend Trading
The USDJPY M5 chart shows a clear uptrend with both signal types visible. A BUY signal on the left displays "BUY E:154.380 SL:154.225 TP:154.689" where price pulled back to the lower VIDYA band during the uptrend and bounced. A SELL signal on the right shows "SELL E:154.716 SL:154.844 TP:154.460" when the trend reversed. The dashboard at the bottom shows EURUSD and GBPUSD rows across multiple timeframes. The Yen pairs demonstrate how ATR bands automatically adjust to each instrument's pip characteristics -- the stop loss on the BUY is approximately 15.5 pips (154.380 minus 154.225), appropriately wider than the GBPUSD M5 example because USDJPY's ATR is naturally different. No manual adjustment was needed; the same default multipliers produce correctly scaled levels across different currency pairs.
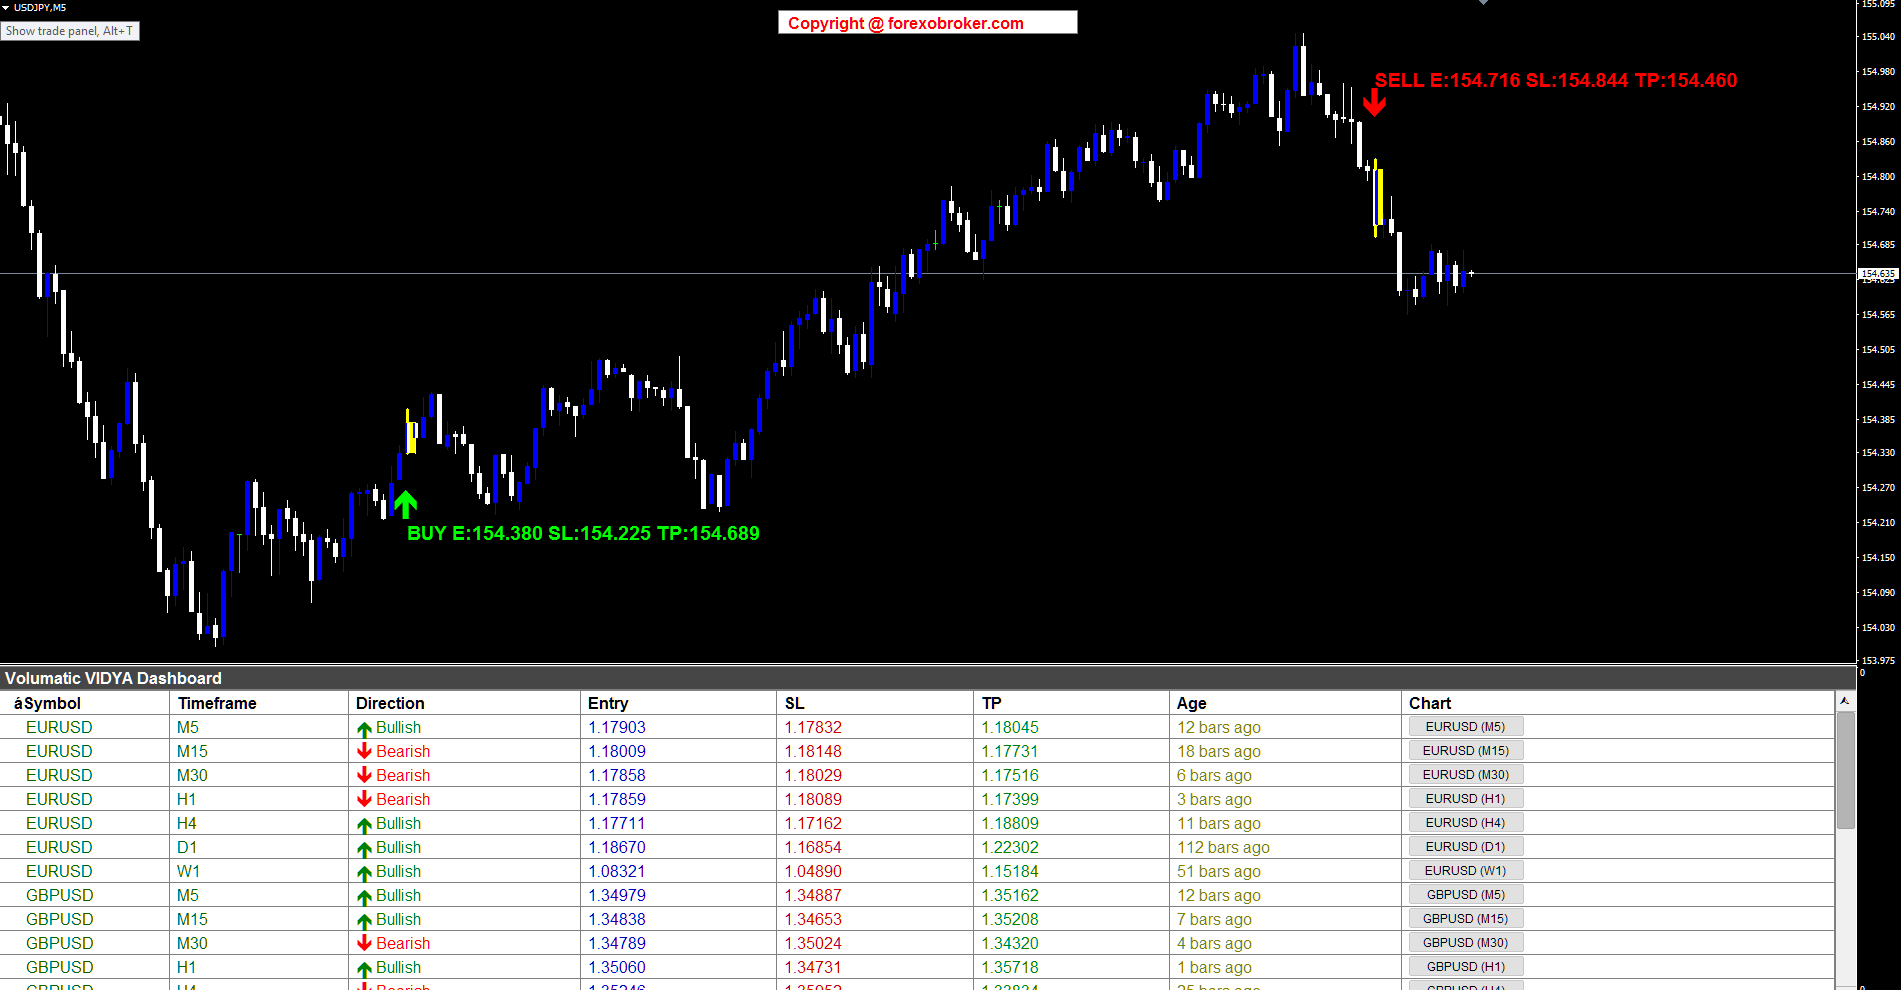
Figure 10. USDJPY M5 BUY and SELL signals -- ATR bands automatically scale to Yen pair characteristics.
BTCUSD M15 -- Catching a Crypto Crash Recovery
This is one of the most dramatic examples. The BTCUSD M15 chart shows a massive drop from approximately 69,000 down to around 64,500 -- a sharp sell-off of over 4,500 points. At the very bottom of this V-shaped recovery, the indicator detected a BUY signal: "BUY E:65330.19 SL:64998.89 TP:65992.79". The two-bar confirmation pattern required price to first touch the lower VIDYA band (the pullback into the crash bottom) and then close bullish on the next bar -- confirming that buyers had stepped in. The dashboard shows BTCUSD and SOLUSD rows, monitoring multiple crypto assets simultaneously. What makes this example notable is how VIDYA's adaptive behavior handled the crash: during the sharp decline, high CMO readings caused VIDYA to track price aggressively downward. When price stabilized and bounced, the adaptive bands provided a precise entry level. The stop loss at 64,998.89 sits roughly 330 points below entry, while the take profit at 65,992.79 targets over 660 points of profit -- a clean 2:1 reward-to-risk ratio.
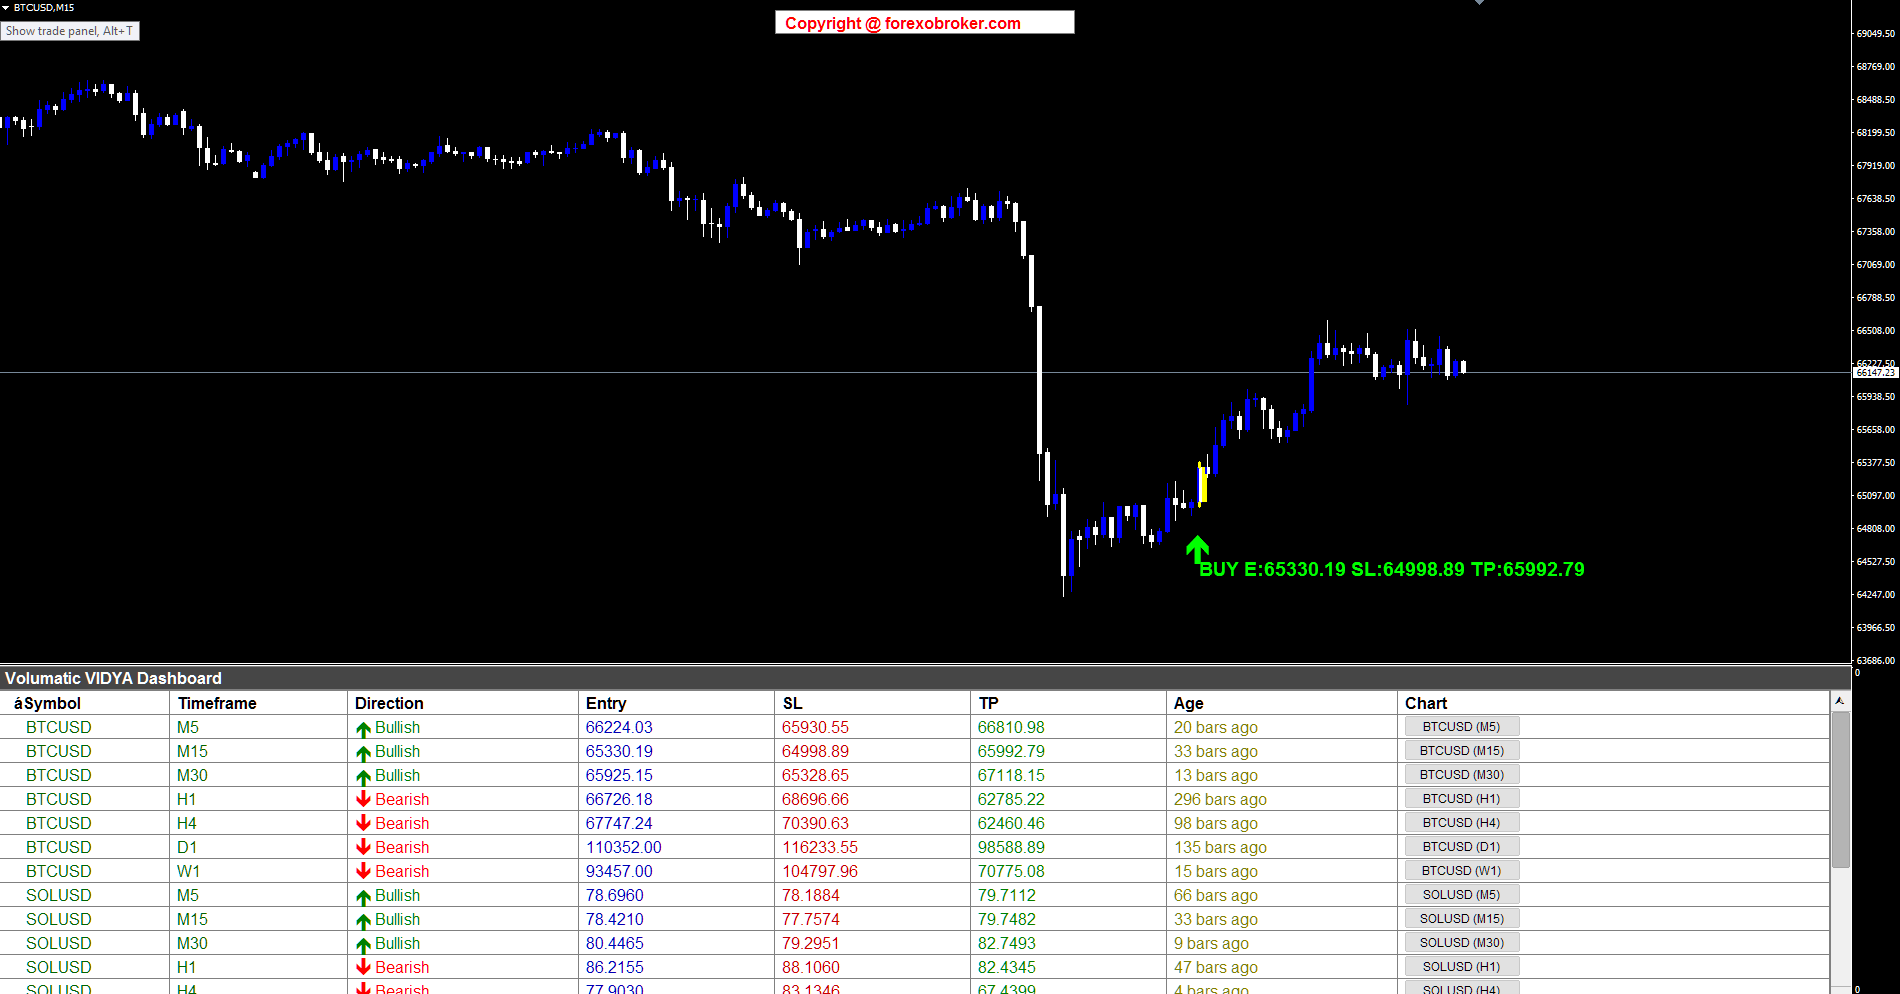
Figure 11. BTCUSD M15 BUY signal at the bottom of a crash recovery -- VIDYA adapted through extreme volatility.
SOLUSD M15 -- Altcoin Trend Signals
Solana (SOLUSD) on the M15 timeframe shows a strong downtrend from approximately 87 to 76, with both SELL and BUY signals captured. The SELL signal near the top displays "SELL E:83.7795 SL:84.4994 TP:82.3396" -- catching the beginning of the decline with a stop loss approximately 0.72 above entry and a take profit approximately 1.44 below, maintaining the 2:1 reward-to-risk structure. At the bottom of the move, a BUY signal appears: "BUY E:78.4210 SL:77.7574 TP:79.7482" as the trend showed signs of reversal. The dashboard panel shows both BTCUSD and SOLUSD rows, demonstrating multi-crypto monitoring. Altcoins like SOL often trend harder and faster than Bitcoin, making VIDYA's adaptive speed particularly valuable -- the CMO readings during this sustained downtrend would have been elevated, keeping VIDYA responsive and the bands tight against price action.
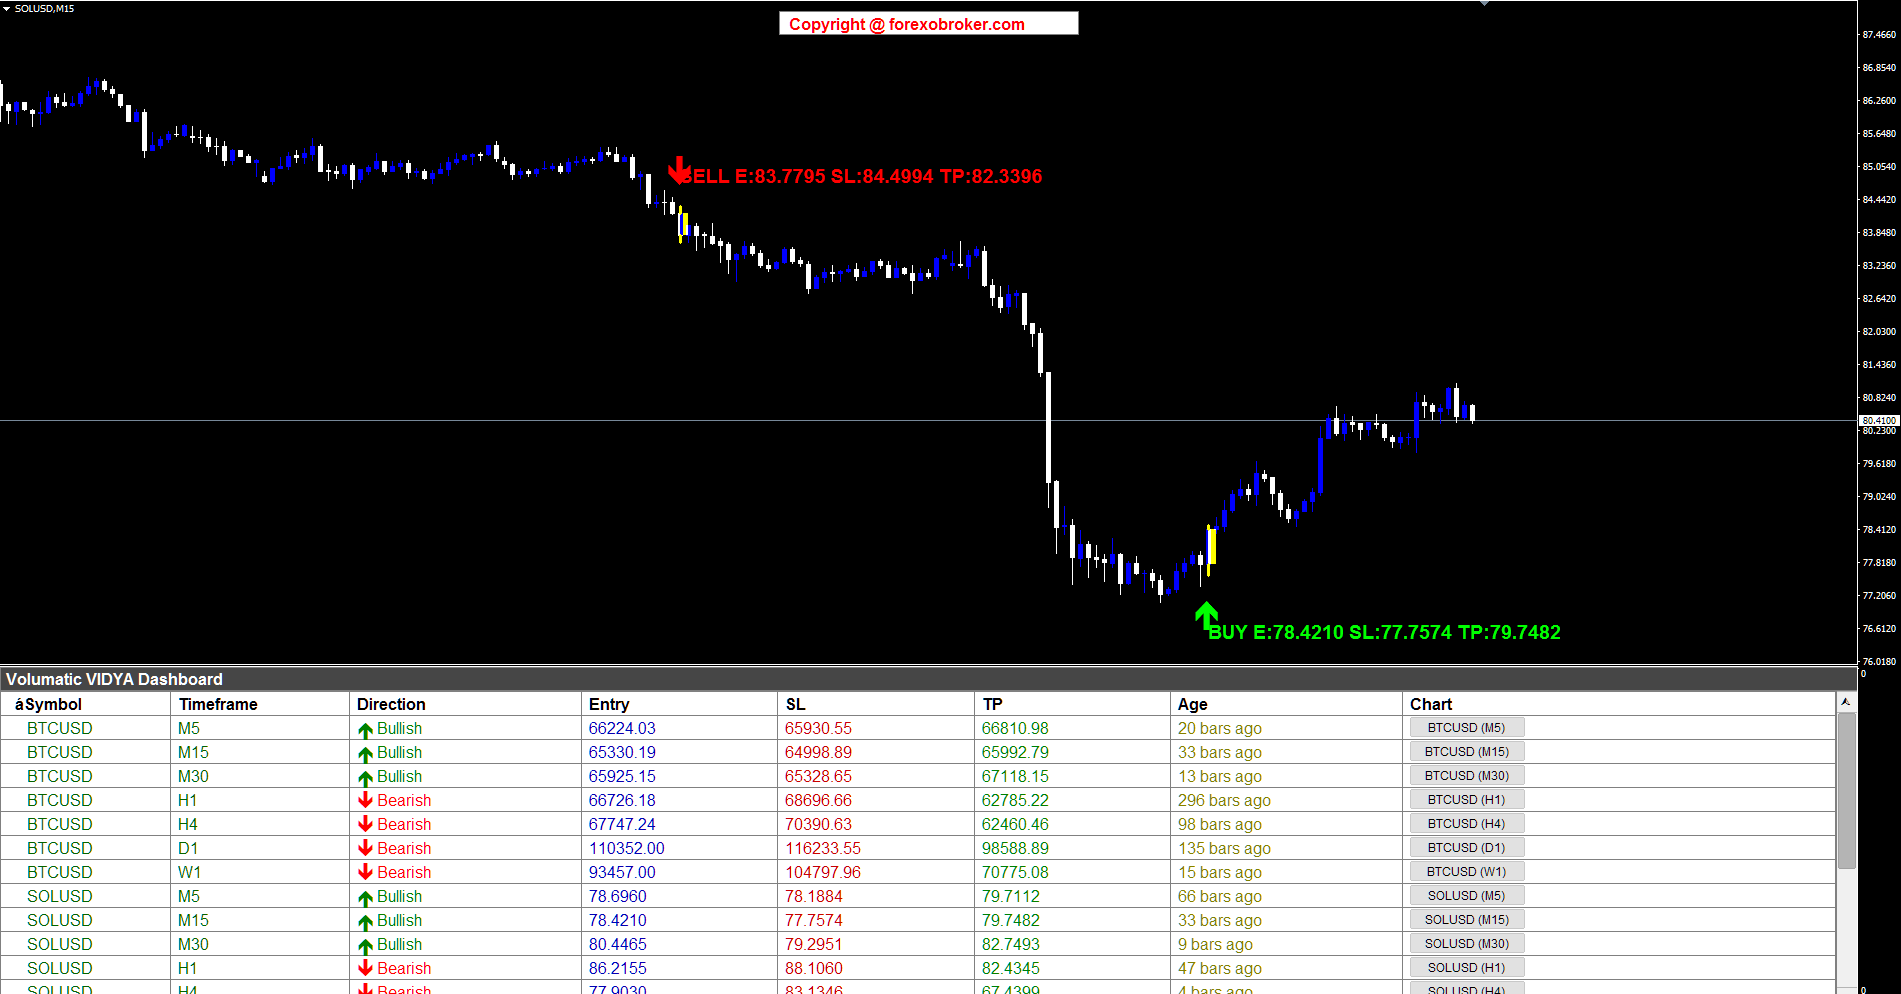
Figure 12. SOLUSD M15 SELL and BUY signals during a strong downtrend -- multi-crypto dashboard monitoring.
ETHUSD M15 -- Ethereum with Cross-Crypto Dashboard
Ethereum on the M15 timeframe shows a decline from approximately 1,985 followed by a crash and recovery pattern. The SELL signal at the top displays "SELL E:1952.44 SL:1963.16 TP:1931.00" where VIDYA detected the bearish pullback to the upper band. Further down, after the sharpest part of the decline, a BUY signal appears: "BUY E:1880.18 SL:1867.25 TP:1906.03" as the reversal confirmed. The dashboard shows both BTCUSD and ETHUSD rows visible, allowing traders to compare trend alignment across the crypto market. When multiple crypto assets show the same directional bias in the dashboard -- for example, BTC, SOL, and ETH all showing SELL on M15 -- it signals broad market weakness and adds conviction to individual short entries. The SELL signal on ETH could have been combined with the BTC and SOL sell signals from the previous examples for a multi-asset short portfolio with ATR-calibrated levels on each position.
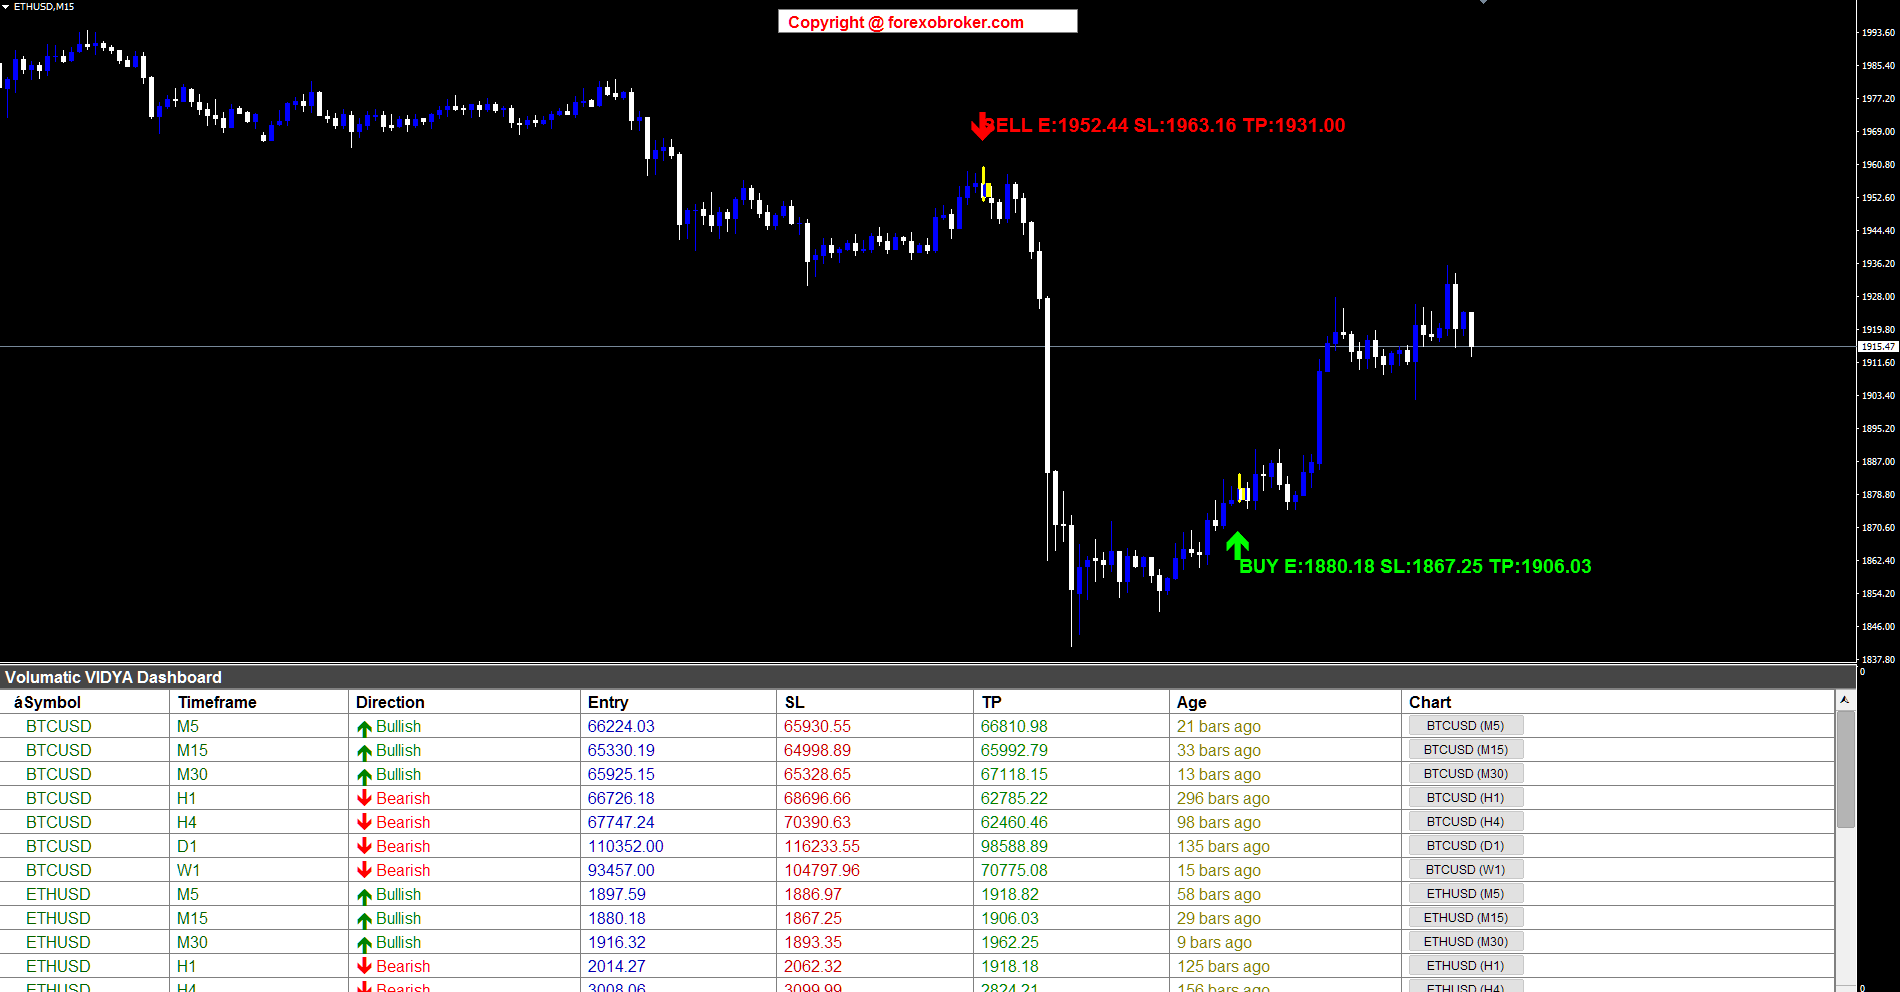
Figure 13. ETHUSD M15 with SELL and BUY signals -- cross-crypto dashboard shows BTC and ETH together.
US30 Daily -- Index Swing Trading with Wide Risk-Reward
The US30 (Dow Jones Industrial Average) on the Daily timeframe provides a powerful swing trading example. The chart shows a strong multi-month uptrend from approximately 42,000 to over 50,000, with a single BUY signal displaying "BUY E:46295.00 SL:45023.93 TP:48837.14". This daily-timeframe signal has the widest levels of any example in this section: the stop loss sits roughly 1,271 points below entry, while the take profit targets approximately 2,542 points above -- maintaining the 2:1 reward-to-risk ratio even on a daily chart. The dashboard shows US500 and DE40 rows, demonstrating index-focused monitoring. Daily timeframe signals on indices are excellent for position traders and portfolio managers. VIDYA's adaptive behavior on the daily chart means it tracked the strong uptrend closely (high CMO readings over the sustained rally), keeping the pullback band relatively tight against price. The two-bar confirmation pattern on a daily chart means the signal required two full trading days to form -- a pullback day touching the VIDYA band followed by a bullish confirmation day -- providing strong conviction for a swing entry.
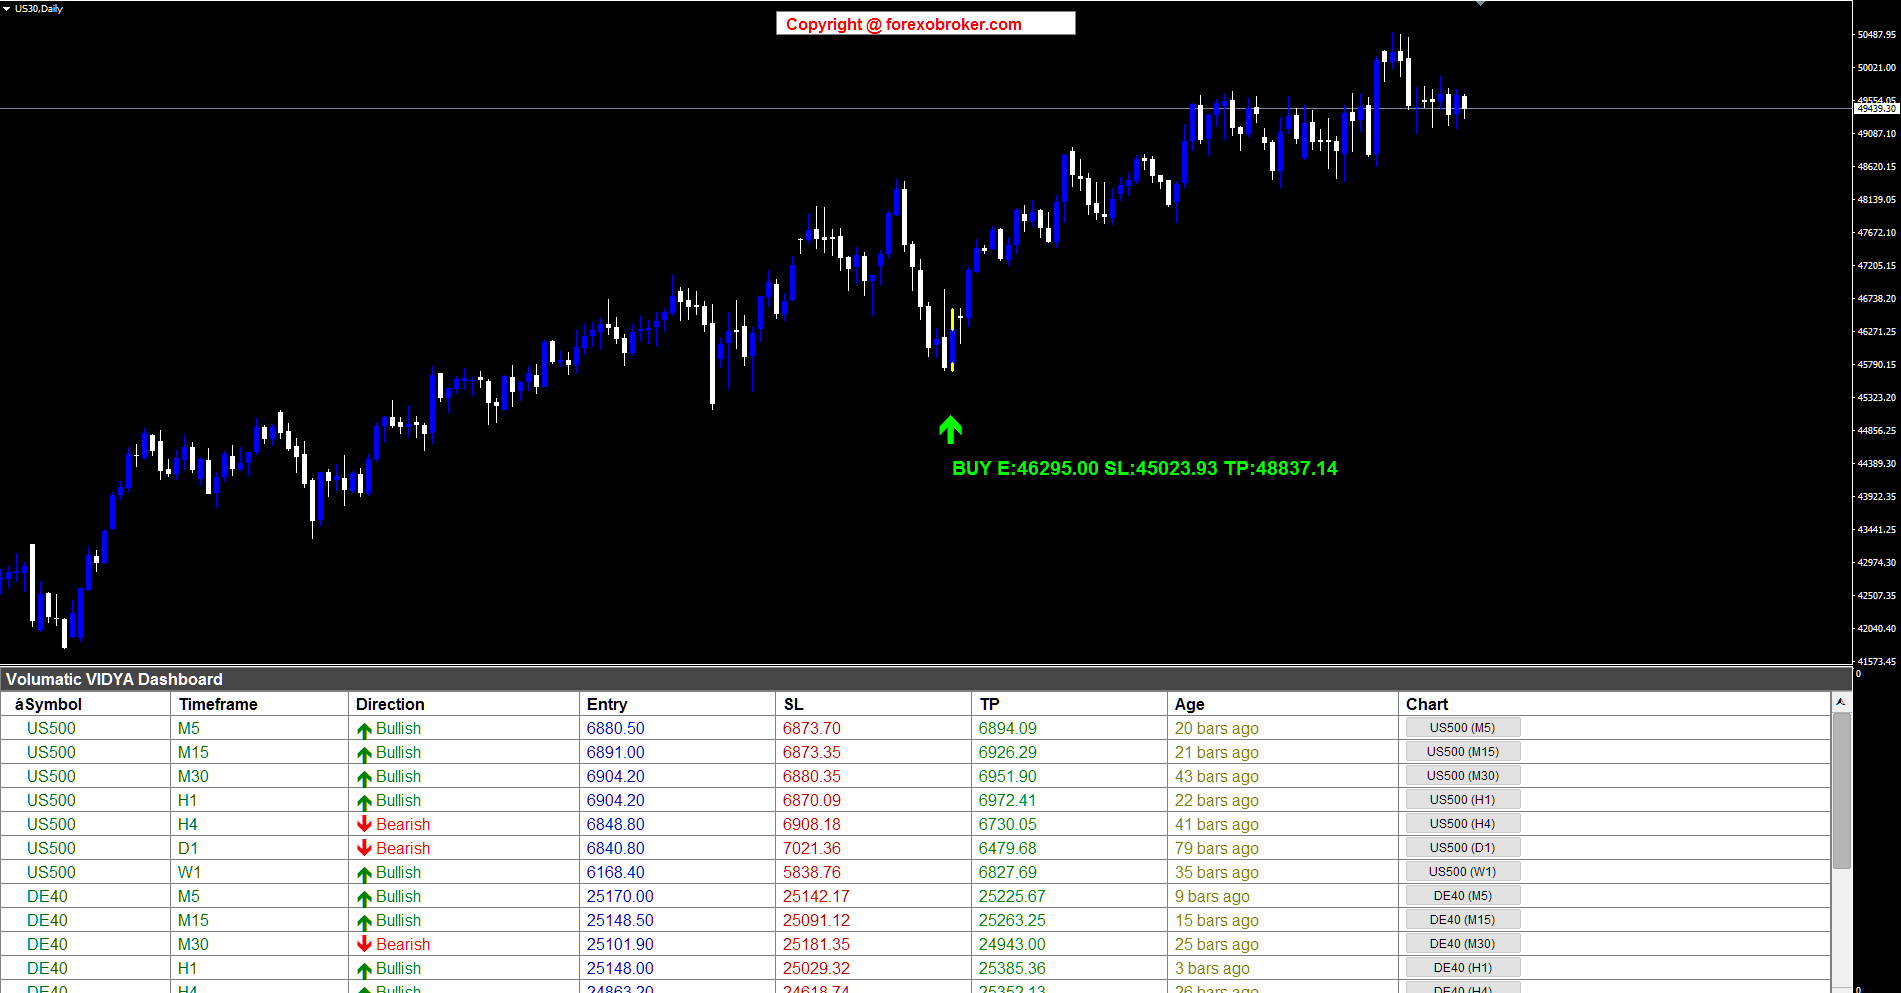
Figure 14. US30 Daily BUY signal in a strong uptrend -- daily ATR bands provide wide, meaningful levels for swing trading.
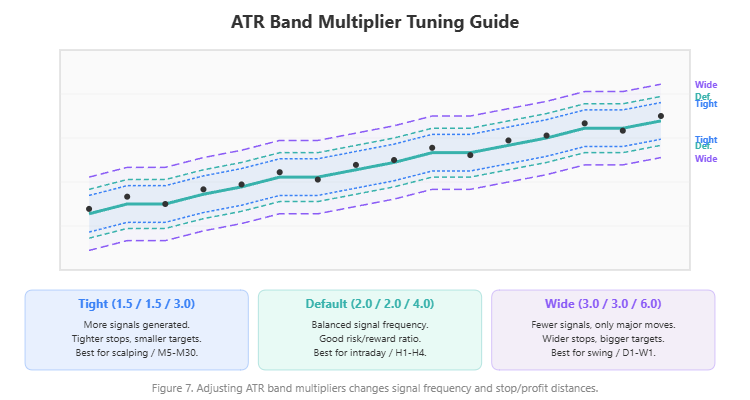
12. ATR Band Tuning Guide
The three ATR multiplier parameters -- Entry Band Distance, Stop Loss Band Multiplier, and Take Profit Band Multiplier -- control how far each level sits from the central VIDYA line. Adjusting these changes the character of the signals and their reward-to-risk profile.
Default Configuration (Balanced)
- Entry Band: 2.0 x ATR
- Stop Loss Band: 2.0 x ATR
- Take Profit Band: 4.0 x ATR
This produces signals where the entry is two ATR units from VIDYA, the stop loss is another two ATR units beyond (four total from VIDYA), and the take profit is four ATR units on the opposite side. The effective SL distance from entry is approximately 2 ATR, and the TP distance is approximately 6 ATR from the SL, yielding a typical reward-to-risk of 2:1 to 3:1.
Scalping Configuration (Tighter Levels)
- Entry Band: 1.5 x ATR
- Stop Loss Band: 1.5 x ATR
- Take Profit Band: 2.5 x ATR
Tighter bands mean the pullback does not need to be as deep to trigger a signal, the stop loss is closer (smaller risk per trade), and the take profit is more conservative. This generates more signals with smaller individual gains but higher win rates. Best for M5-M30 timeframes.
Swing Configuration (Wider Levels)
- Entry Band: 2.5 x ATR
- Stop Loss Band: 3.0 x ATR
- Take Profit Band: 6.0 x ATR
Wider bands require deeper pullbacks to trigger, which filters out shallow retracements. The wider stop loss gives trades more room to breathe, and the extended take profit captures larger moves. Fewer signals, but each one targets a significant trend continuation. Best for H4-W1 timeframes.
How to Choose
Start with the defaults. If you find that your stop losses are getting hit too frequently before price moves in your favor, widen the SL multiplier by 0.5. If your take profit targets are rarely reached, reduce the TP multiplier. The Entry Band Distance controls signal frequency -- smaller values produce more signals, larger values produce fewer but require more conviction from price.
Figure 7. ATR multiplier comparison: tight scalping bands vs. default vs. wide swing bands.
Remember that the 200-period ATR ( InpATRPeriod ) provides the baseline volatility measurement. This long lookback ensures the ATR reflects the instrument's typical volatility rather than reacting to short-term spikes. If you need faster ATR adaptation, you can reduce this period, but 200 is recommended for stability.
13. Parameter Reference
Dashboard Settings
| Parameter | Default | Description |
|---|---|---|
| Symbols | EURUSD,GBPUSD,USDCAD,USDJPY | Comma-separated list (up to 20) |
| Symbol Prefix | (empty) | Broker prefix, e.g., "x" for xEURUSD |
| Symbol Suffix | (empty) | Broker suffix, e.g., ".pro" for EURUSD.pro |
| Enable M1 | false | Toggle M1 timeframe |
| Enable M5-W1 | true | Toggle M5, M15, M30, H1, H4, D1, W1 |
| Enable MN | false | Toggle MN timeframe |
| Visible Rows | 12 | Number of rows visible in the dashboard |
| Filter Recent | false | Sort signals by most recent first |
VIDYA Settings
| Parameter | Default | Description |
|---|---|---|
| VIDYA Length | 5 | EMA base period for VIDYA calculation |
| VIDYA Momentum | 20 | CMO lookback period for momentum measurement |
| Entry Band Distance | 2.0 | ATR multiplier for entry band (VIDYA +/- ATR x 2.0) |
| SL Band Multiplier | 2.0 | ATR multiplier for stop loss band |
| TP Band Multiplier | 4.0 | ATR multiplier for take profit band |
| ATR Period | 200 | ATR lookback for volatility measurement |
| SMA Period | 15 | SMA overlay period for chart display |
| Max History Bars | 500 | Maximum bars to calculate per symbol/timeframe |
Chart Arrow Settings
| Parameter | Default | Description |
|---|---|---|
| BUY Arrow Color | Lime | Color of BUY signal arrows |
| SELL Arrow Color | Red | Color of SELL signal arrows |
| Arrow Size | 4 | Arrow marker size (1-5 scale) |
Alert Settings
| Parameter | Default | Description |
|---|---|---|
| Alert Title | Volumatic VIDYA Dashboard | Title shown in alert messages |
| Popup Alerts | true | Enable on-screen popup notifications |
| Sound Alerts | true | Enable audible alerts |
| Email Alerts | false | Enable email notifications |
| Push Notifications | true | Enable mobile push via MetaQuotes ID |
14. Conclusion & Call to Action
The gap between identifying a signal and being ready to trade it is where most opportunities are lost. A trend scanner that tells you "BUY EURUSD H1" is useful. A trend scanner that tells you "BUY EURUSD H1 at 1.09500, stop at 1.09200, target 1.09900" is actionable.
The Volumatic VIDYA Dashboard bridges this gap by combining Tushar Chande's adaptive VIDYA algorithm with ATR-based band computation and two-bar pullback confirmation. Every signal arrives with pre-computed Entry, Stop Loss, and Take Profit prices. The adaptive nature of VIDYA means the indicator automatically adjusts to changing volatility conditions -- tracking price closely during trends and flattening during ranges -- without any manual parameter switching.
The 8-column dashboard gives you a complete operational view of your entire watchlist in a single panel. The non-repainting engine ensures every signal you see is permanent. The 4-channel alert system delivers complete trade levels to your screen, speakers, inbox, and phone. And the one-click chart navigation lets you visually confirm any signal in seconds.
Whether you trade forex majors on H4, scalp indices on M15, or swing trade gold on the daily chart, the Volumatic VIDYA Dashboard provides the adaptive scanning and level computation that manual analysis cannot match at scale.
Download the free demo and try it on your own charts:
- MetaTrader 5: Volumatic VIDYA Dashboard MT5
- MetaTrader 4: Volumatic VIDYA Dashboard MT4


 Trading Guide")
