Mathematics and Trading: How the Murrey Math System Works (1995)

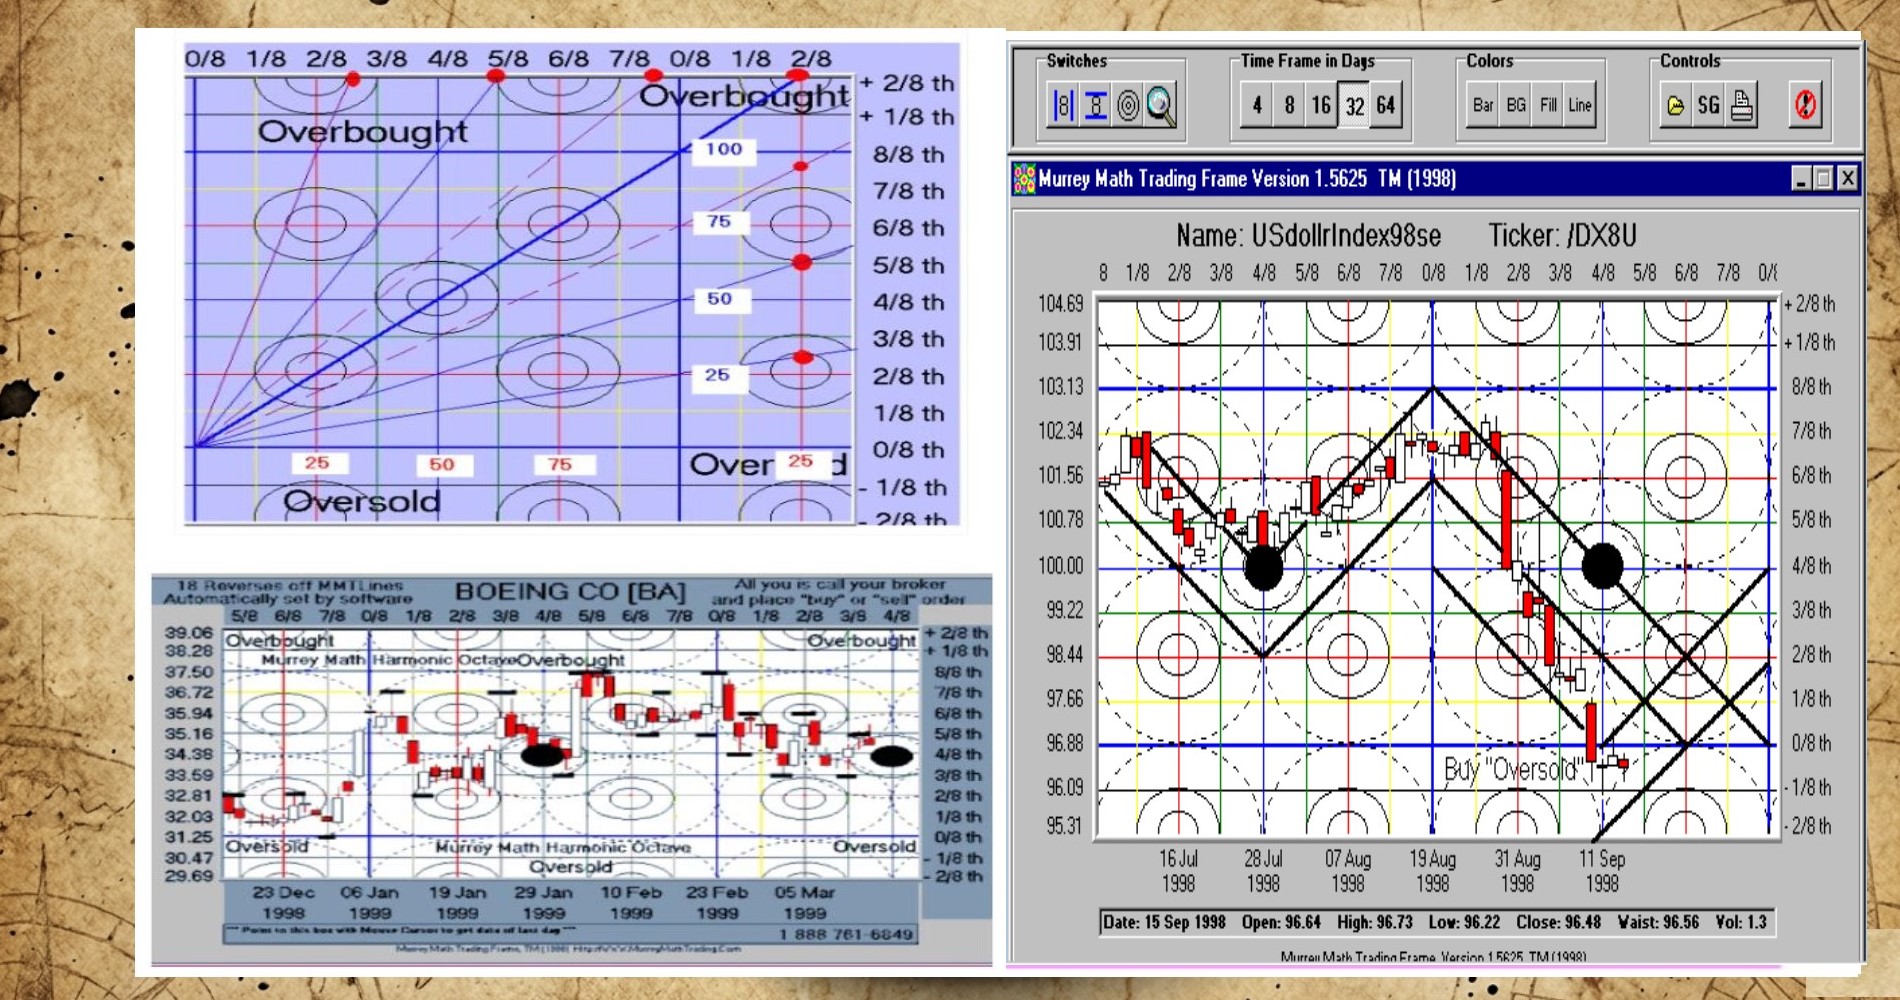
This trading system was published by T. Henning Murrey in 1995. It is based on the premise that all market price movements can be explained by geometry. At its core is the work of W.D. Gann, particularly Gann's octave theory.
Gann's octave theory originates from the ancient Greek Pythagoras. Pythagoras, and Gann, and more recently Murrey, believe that natural phenomena—and market price movements are only a part of natural phenomena—are composed of octaves. That is, multiples of eight and one-eighth. Everyone knows that an octave (eight notes) is fundamental in music.

Murrey Math Lines are similar to, yet different from, pivots. It's more accurate to think of them as a representation of a Gann fan using horizontal lines.
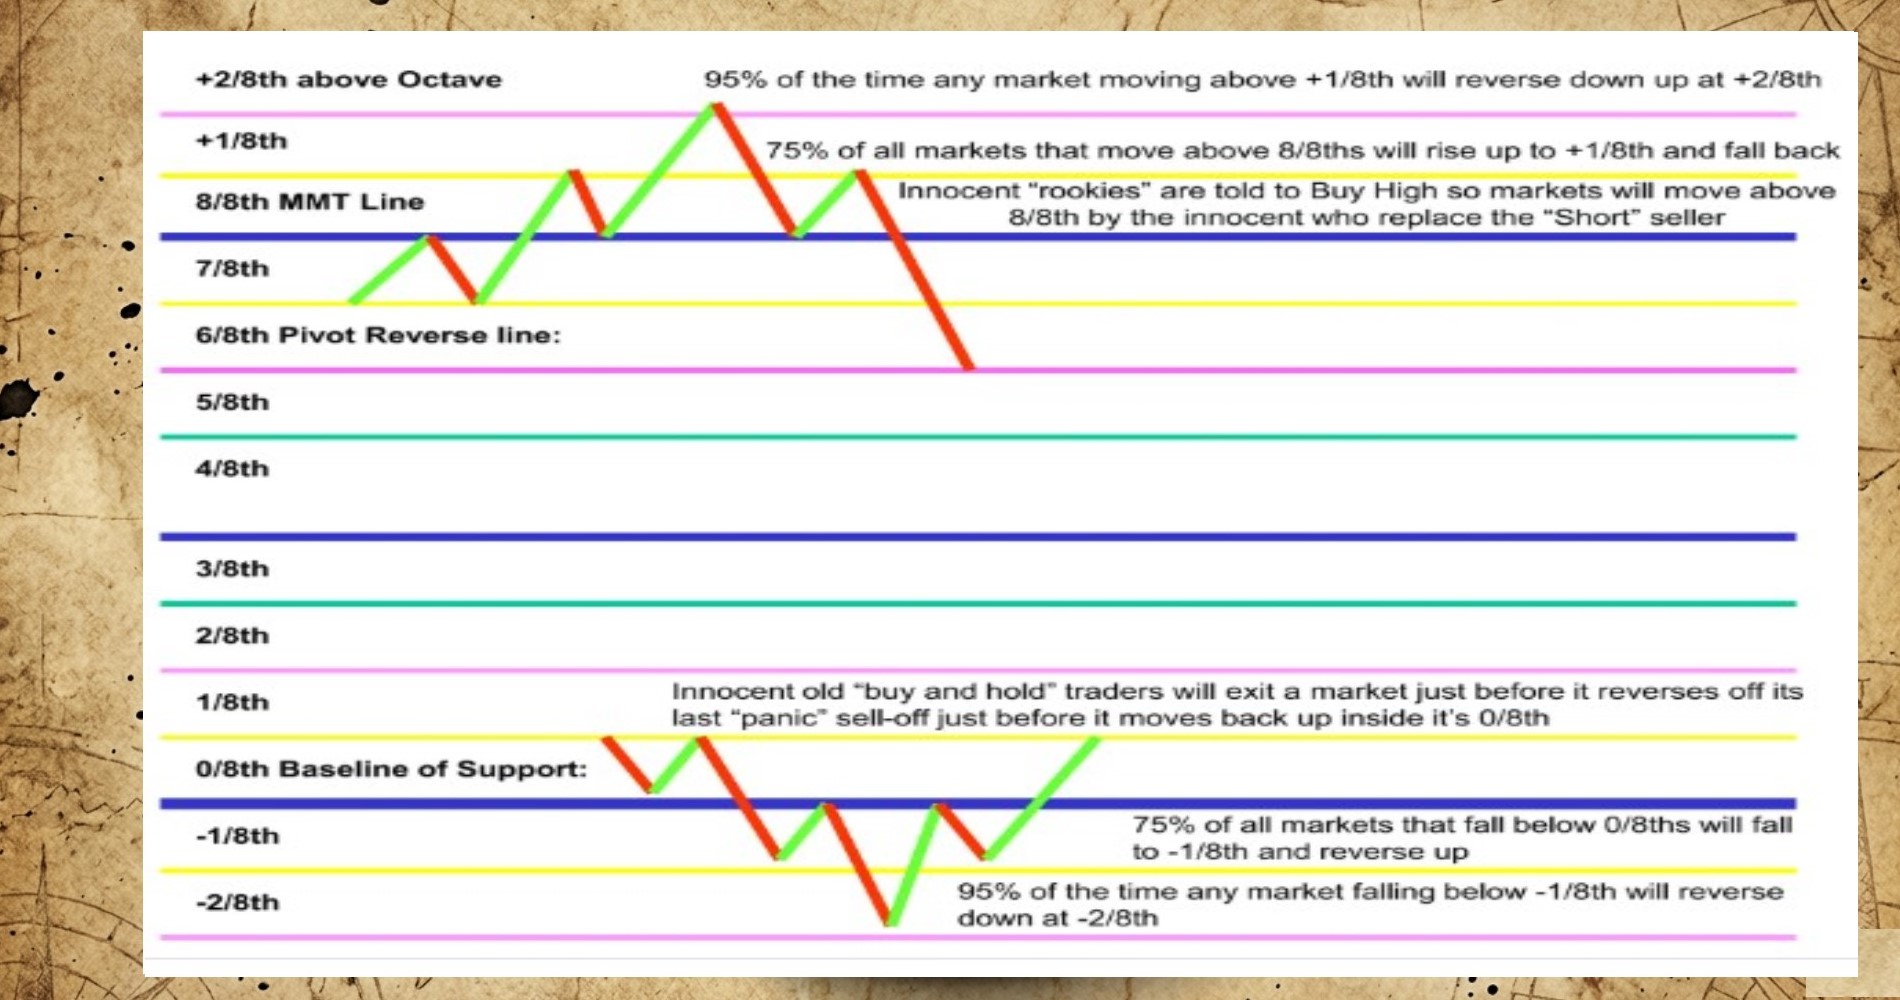
Based on the price swing over a certain period, lines are drawn from 0/8 to 8/8. This represents one octave of price movement. Price movements exceeding these ranges are clearly abnormal and thus violate the laws of nature. Therefore, excessively high prices are forced to reverse and return. These excessive ranges are represented as +1/8, +2/8, +3/8, and below 0 as -1/8, -2/8, and -3/8.
Using the eight notes of a musical scale as an example, a state where price movements fall within one octave is described as "keeping the rhythm correctly." If it goes beyond this range, it can be said that the "rhythm is disrupted" or "the notes are off."
For a certain period, the default value is "64". To change this, you must use a multiple of 8, such as 8, 16, 32, 64, 128, and so on.
Incidentally, Murrey analyzes using daily and weekly charts. The target instruments are US stocks and stock indices. Nowadays, it is common to see examples of its use not only on shorter timeframes than daily charts, but also on FX and cryptocurrencies, not just stocks and indices. Furthermore, since Murrey Math Lines can identify levels where the price is highly likely to stop and reverse, it is only natural that many options traders overseas utilize it.
+3/8 Level where a reversal is inevitable
+2/8 Buying has gone too far
, a reversal could happen at any time
+1/8 Buying has gone too far
8/8 Upper limit of resistance
7/8 Level where the price may stop/reverse
6/8 Level where the price may stop/reverse
5/8 Upper limit of normal price movement
4/8 Level of normal price movement
3/8 Lower limit of normal price movement
2/8 Level where the price may stop/reverse
1/8 Level where the price may stop/reverse
0/8 Lower limit of normal price movement
-1/8 Selling has gone too far
-2/8 Selling has gone too far
, a reversal could happen at any time
-3/8 Level where a reversal is inevitable
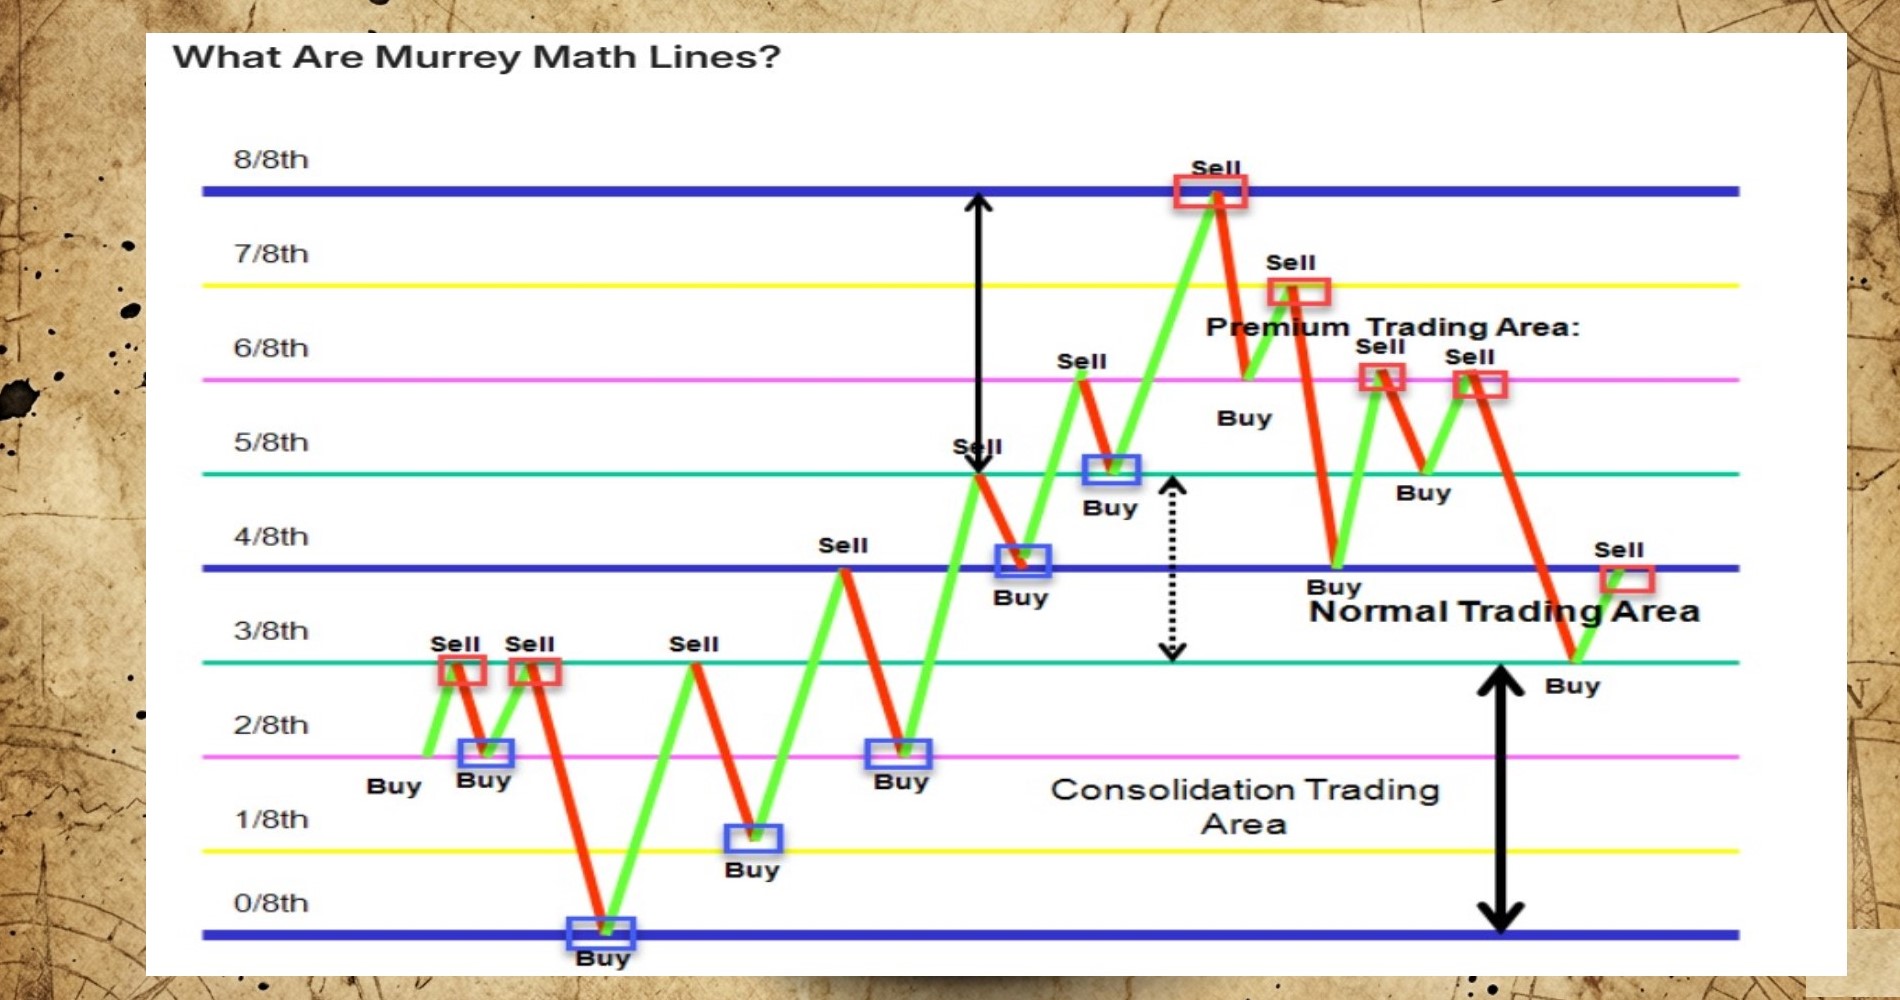
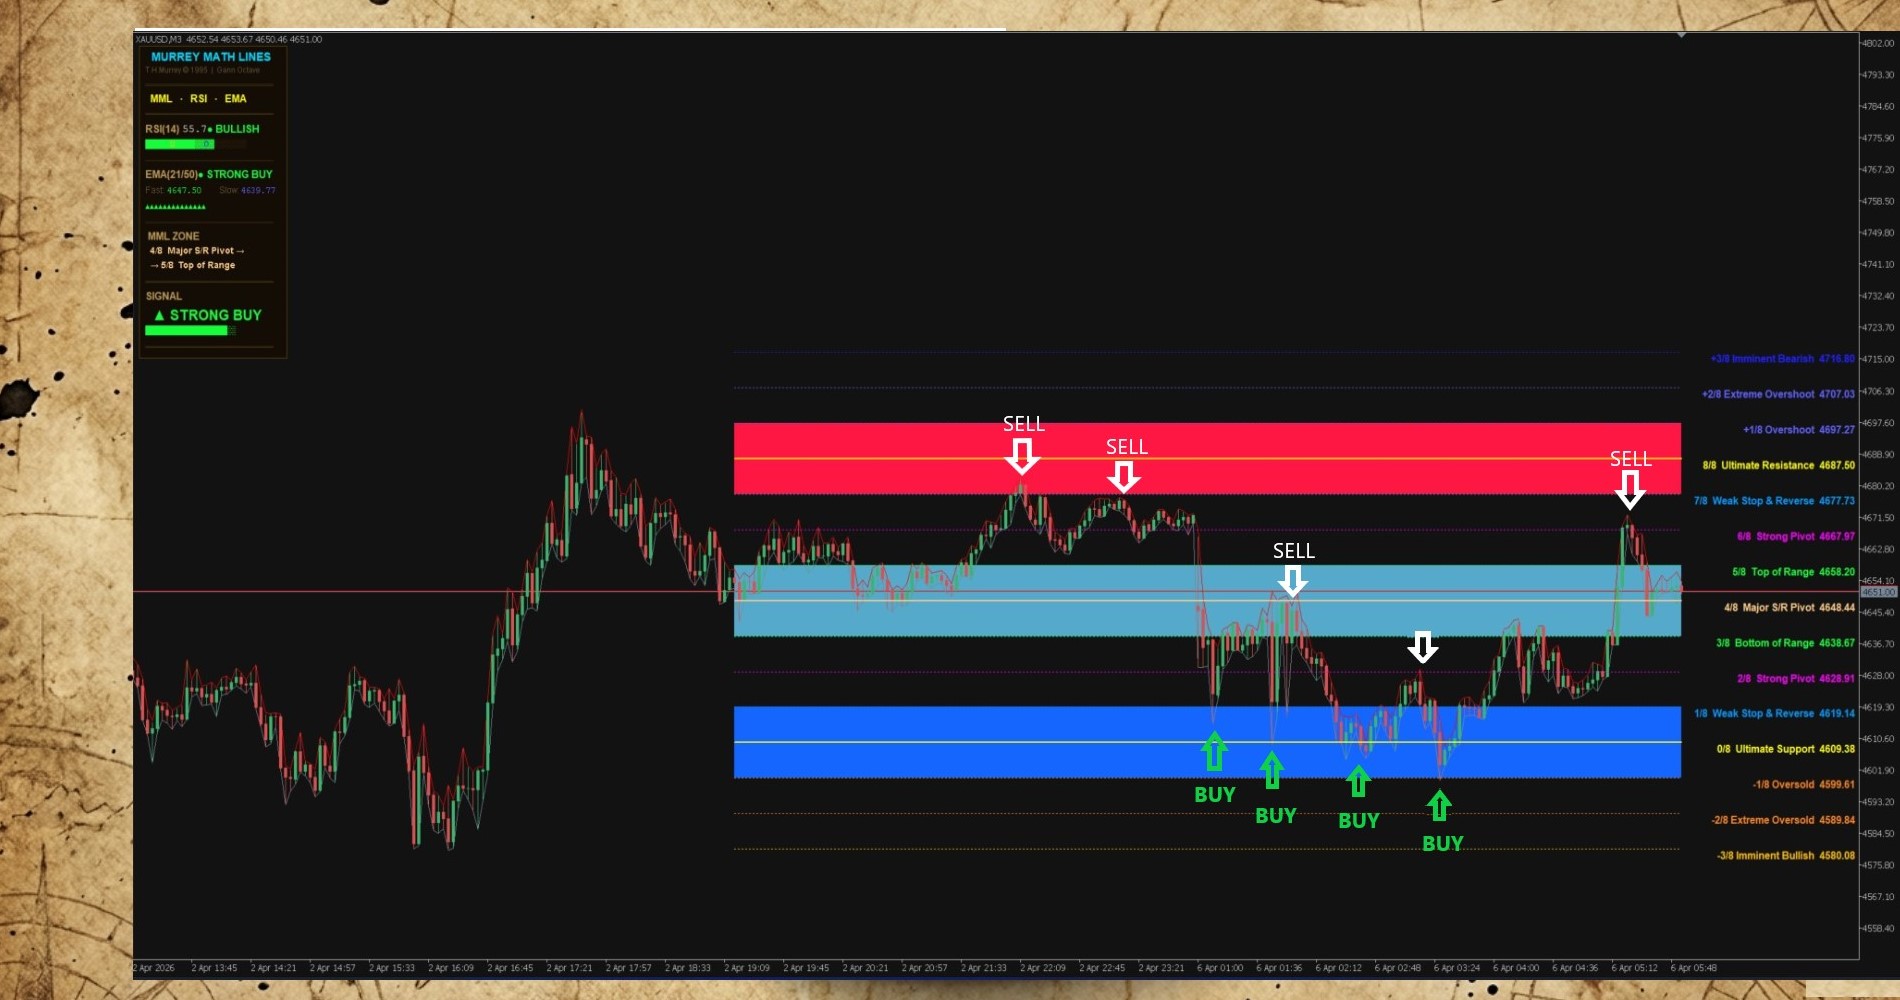
The 4/8 level corresponds to the Central Pivot in pivots. By comparing the 4/8 level of the previous day and earlier with that of the current day, you can predict the direction of price movement. This can be considered the same as with regular pivot methods.
43.3% of price movements occur within the range of 3/8, 4/8, and 5/8. This range is called the "Normal Trading Area." Above and below this level, the probability of the price stopping or reversing increases.
Prices often form a range between 0/8 and 3/8. This range is called the "Consolidation Trading Area."
If an uptrend fails to break through the 3/8 mark, suspect that the upward momentum may be slowing down. If a downtrend fails to break through the 5/8 mark, consider that the downward momentum may be weakening.
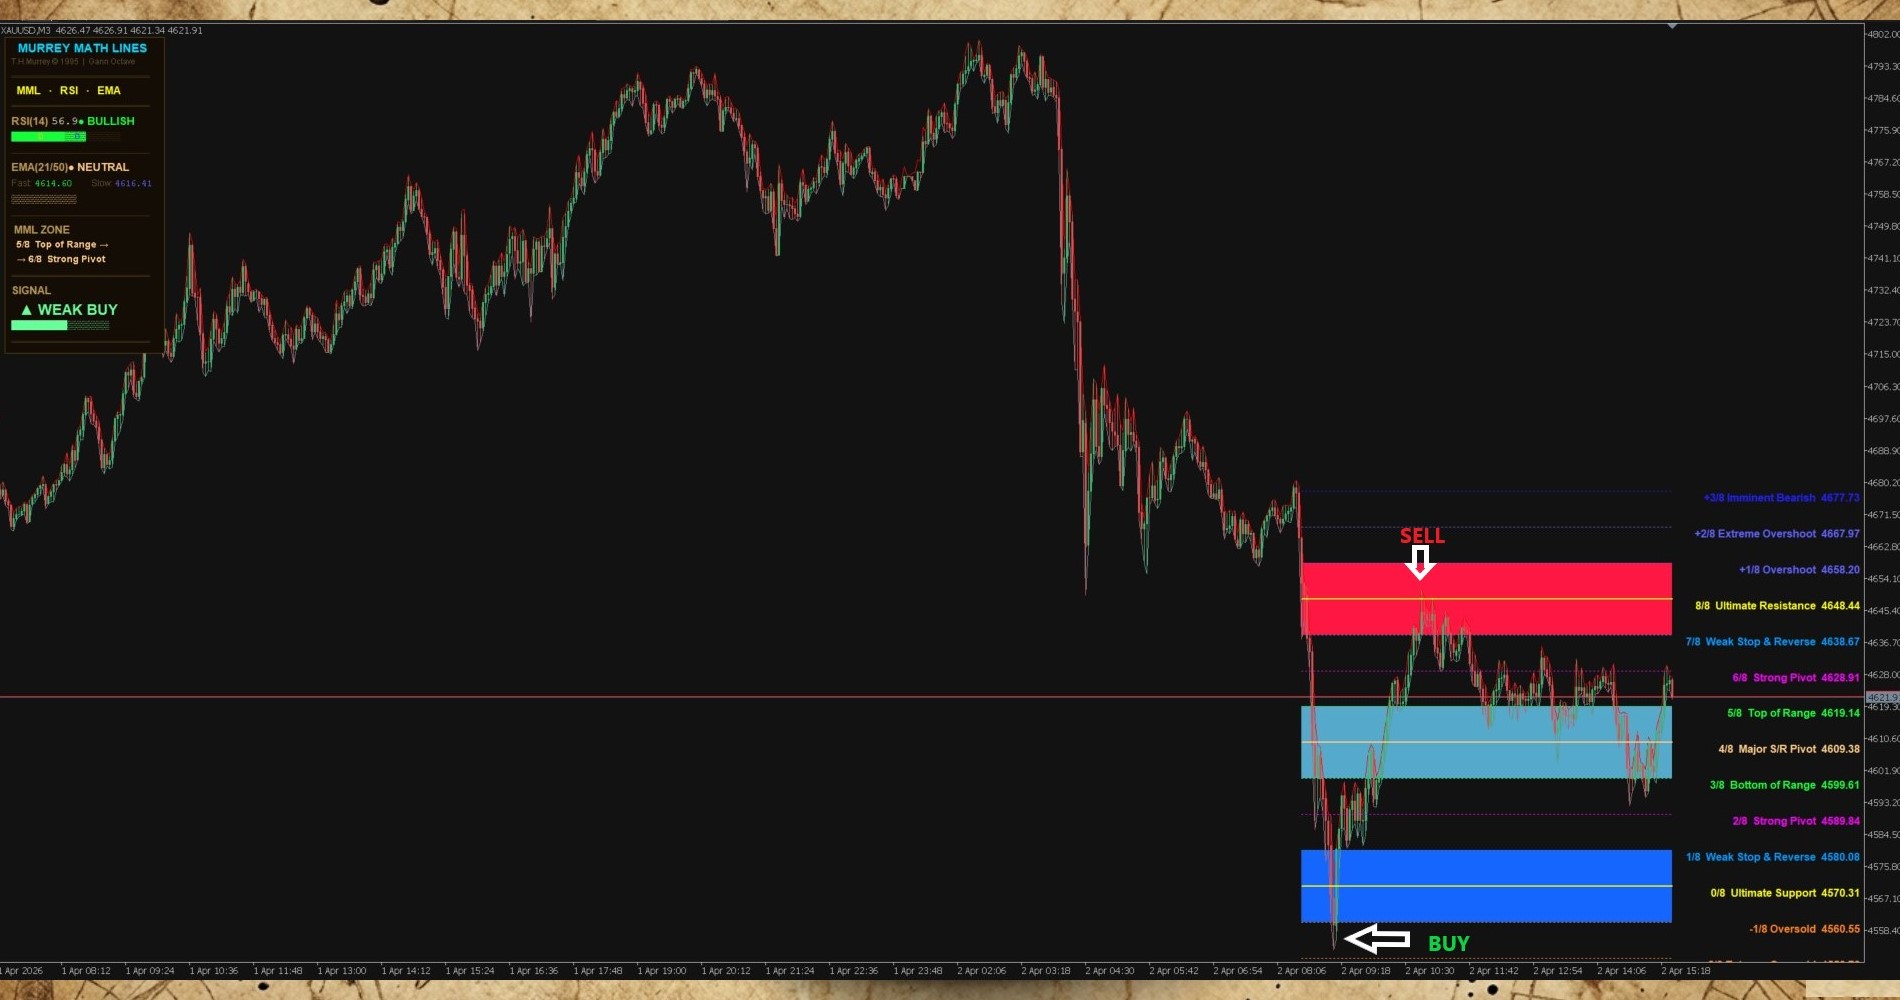
Double tops formed on 7/8 intervals and double bottoms formed on 1/8 intervals have an edge and can serve as reversal signals. Some traders even wait for these patterns on 15-minute charts before trading.
Incidentally, Murrey Math is usually abbreviated as "MM". Double top is abbreviated as "M", and double bottom as "W". For example, "7/8 MM forms an M". By the way, "1/8" is read as "1/8" in Japanese and "one-eighth" in English, and "2/8" is read as "2/8" or "two-eighths" in English. Note that these are plural in English.
The indicators presented here are merely a highly simplified version of Murrey Math. The Murrey Math Trading System used by T. Henning Murrey is complex and difficult to understand, as is the case with all Gann-based trading methods.