

Timeless Charts — MetaTrader 5 Utility — Manual
Timeless Charts is a MetaTrader 5 utility that builds custom price charts from tick data, allowing you to work with non-standard aggregations such as seconds, tick, volume, range, renko, kagi, line break, and point & figure. It also supports advanced chart visualization modes (including cluster/footprint-style views) plus built-in indicators, drawings, chart synchronization for drawings and crosshairs, and replay for analysis and manual trading.
Product page: Timeless Charts on MQL5 Market
This manual is a practical guide to install, configure, and use Timeless Charts.
Contents
1) Requirements · 2) Installation · 3) Interface Overview · 4) Quick Start · 5) Price Charts · 6) Drawing Tools · 7) Indicators · 8) Market Replay · 9) Cluster / Footprint & Bars Statistics- This application can’t be tested in Strategy Tester (requires UI interaction and tick history operations).
- It’s primarily intended for manual analysis/trading; it’s not designed as a data-feed for other EAs.
1) Requirements
- MetaTrader 5
- Symbol with tick history available (quality depends on broker’s tick data)
- Enough disk space for tick downloads / caching (varies by symbol and period)
2) Installation
- Install from MQL5 Market and restart MetaTrader 5 if needed.
- Open any chart of the symbol you want to analyze.
- Attach Timeless Charts to the chart.
Screenshot: Attaching Timeless Charts

3) Interface Overview
Timeless Charts uses a custom charting interface. This section explains each visible component and how the user interacts with it.
3.1 Title Bar
The title bar is located at the top of the application window and provides access to global configuration and tools.
- Program Icon and Name
Displays the application icon and the name Timeless Charts. - Theme
Opens a menu to configure visual appearance, including chart theme and cluster/footprint color options. - History
Opens a dialog to configure history depth and select the price chart type. - Indicators
Opens a dialog to attach, edit, or remove indicators applied to the chart. - Drawings
Opens a dropdown menu containing bulk operations and the list of drawing tools. - Templates
Allows saving and loading templates (chart type, cluster settings, indicators, drawings). - Replay
Opens the replay dialog to work in a replay environment using historical data. - Application Buttons
Maximize, minimize, restore, or close (removes Timeless Charts from the chart).
Screenshot: Title bar and menus

3.2 Chart Window
The chart window is built from various components.
- Main Chart Subwindow
Displays the price chart and allows attaching indicators/drawings and managing trades/orders directly on the chart. - Indicator Subwindows
Some indicators are displayed in separate subwindows below the main chart. - Price / Value Scales
Vertical scales used to represent price or indicator values. - Date / Time Scale
Horizontal scale displayed at the bottom of the chart. - Price Scale Mode Selector
Auto, Manual, Center. Is located at the right-top corner, hover the price scale. - Navigation Buttons
Zoom In, Zoom Out, Scroll to current bar/candle/price. Is located at the right-bottom corner at the end of the date/time scale. - Horizontal Scrollbar
Appears when bars/candles overflow the width of the chart. - Subwindow Separators
Drag separators to adjust indicator subwindow heights. - Right Offset Control
Drag the triangle to offset plots from the right border (up to 50% width) - Cluster / Footprint Background
A background layer rendered behind the price bars/candles, displaying volume-by-price information using text and/or colored cells (and optional mini-profiles), depending on the selected parameters.
His visibility depends on the zoom level. When the zoom is less it may display only price chart (candles / bars). To reveal the footprint increase the zoom using the key plus (+) or pressing the zoom in button. - Bars Statistics Panel
A table-like panel displayed at the bottom of the main chart, showing bar-level statistics such as total volume, delta, trades count, and other order-flow metrics.
Screenshot: Chart window components

3.3 Mouse Interaction
Mouse interaction depends on the element under the cursor.
Chart- Price scale drag
Drag price scale to adjust min/max. - Time scale drag
Drag time scale to change bar/candle width. - Chart drag (scroll)
Drag inside subwindow to scroll left/right. In Manual scale mode, drag can move in all directions. - Navigation buttons
Zoom and scroll-to-current controls in the bottom-right corner. - Crosshair / Ruler
Middle mouse button enables crosshair. Click-drag to measure. Release left button to exit. Press Esc to cancel. - Context Menu (Right Click)
Right-click opens context menu for the element under the cursor.
- Right-click on an indicator
Context menu actions (e.g., Properties, Remove).
- Creating drawings (anchor clicks)
Click on chart N times depending on the tool’s anchor points. - Selecting and editing drawings
When selected, drag anchor points to move/resize/adjust. - Right-click on a drawing
Context menu actions (Properties, Delete, Foreground/Background, Select/Deselect).
3.4 Keyboard Navigation
Navigation & Zoom- + / - — Zoom in / Zoom out
- End — Scroll to current / last bar (right)
- Home — Scroll to first bar (left)
- Left / Right — Scroll one bar/candle
- Page Up / Page Down — Scroll one page left/right
- X — Constrain movement horizontally (Manual drag and drawing/editing)
- Y — Constrain movement vertically (Manual drag and drawing/editing)
- Ctrl — Continuous drawing mode (repeat same tool without reselecting)
- Esc — Cancel current operation (drawing or dragging)
Note
Shift and Ctrl can also be used for placing pending orders directly from the chart (documented in Chart Trading section later).
3.5 Operations hints
When performing some operations on the chart like draging the chart to scroll the bars to left / right / up / down, creating a new drawing or moving existing drawings, some hints are displayed at right-bottom corner of the main subwindow.
For example, when you are drawing a triangle and you want the second point of triangle at same price that the first one, you can constraint the mouse moviment at the x axis before click to define the second point.
In image next image you can see the hints when creating a triangle. It show information about the contraints, constinous drawings and the number of anchor points required for create the selected drawing.

4) Quick Start (first successful custom chart)
- Pick a chart type (e.g., Seconds or Renko).
- Change the parameters according to your setup.
- Click “Build / Update” to generate the custom bars.

5) Price Charts
This section explains how price charts are constructed and how they are visually displayed.
5.1 Price Chart Aggregation / Construction Types
Aggregation defines how bars are built from ticks. Parameters are configured in the History dialog.
Time-based (Timeframes / Seconds)- Rule: each bar represents a fixed amount of time.
Base Period — example: Minutes (for a 5-minute chart)
Allowed: Seconds, Minutes, Hours, Days
Periods — example: 5 (Base Period = Minutes → 5-minute bars)
Tick-based
- Rule: each bar forms after a fixed number of ticks.
Count — example: 144 (144-tick bars)
Reset On New Day — example: true
Volume-based (Equi Volume)
- Rule: each bar forms after a fixed volume amount.
Count — example: 10000 (10k volume bars)
Reset On New Day — example: true
Range-based
- Rule: each bar forms when price moves a fixed range.
Range — example: 20 (20-tick range bars)
Reset On New Day — example: false
Renko
- Rule: bricks form based on price movement, not time.
Parameters
Brick Size — example: 10 (10-tick bricks)
Extension % — example: 0.0 or 50.0
Reversal % — example: 100.0 (1-brick) or 200.0 (2-brick)
Reset On New Day — example: true
Note: Extension and reversal is currently working with values from 0.0 to 1.0. It will be fixed in future updates.
- Rule: new lines form when price breaks above/below prior lines.
Base Period — example: Minutes
Allowed: Seconds, Minutes, Hours, Days
Periods — example: 5 (Minutes × 5 basis)
Breaks — example: 3 (3-line break)
Reset On New Day — example: true
Kagi
- Rule: line direction changes when price exceeds a reversal threshold.
Period — example: 30 (30-tick reversal threshold)
Reset On New Day — example: false
Point & Figure
- Rule: columns form using box size and reversal rules.
Box Size — example: 10 (10-tick boxes)
Reversal — example: 3 (3-box reversal)
Reset On New Day — example: true
5.2 Price Chart plot modes
Plot styles define how the aggregated data is rendered. Plot styles are configured in Theme options.
Candlestick plots- Used by time-based, tick, volume, and compatible renko charts.
- Bars include body, wicks, and optional borders.
- Colors can differ for up, down, and doji bars.
Example: Candlestick plot style

Step Line plots
- Used by Kagi, Line Break, and similar chart types.
- Directional line rendering (yin/yang can use different color/thickness).
Example: Kagi plot style

Symbol-based plots
- Used by Point & Figure charts.
- X for upward movement, O for downward movement.
- Each symbol type has independent color settings.
Example: Point & Figure (X / O)

All visual aspects of plots (colors, borders, wicks, line thickness, symbol styles, etc.) are configured in Theme.
6) Drawing Tools
Timeless Charts includes built-in drawing tools designed to work reliably on custom charts.
- Create: select a tool, then click the required number of anchor points.
- Edit: select the drawing and drag anchor points.
- Context menu: right-click for properties, delete, z-order, select/deselect.
- Cancel: press Esc to cancel active drawing/dragging.
- Continuous drawing: press Ctrl to enable / disable constinuous drawing which allows to create multiple drawing at once.
6.1 Managing Drawings
- Open properties: right-click drawing → Properties.
- Delete: right-click drawing → Delete.
- Layering (z-order): right-click drawing → move to background / foreground.
- Select / deselect: use the drawing context menu (or selection behavior).
GIF: Creating and editing drawings (anchors + right-click menu)

Templates can save and restore drawings together with chart settings, indicators, and theme configuration.
7) Indicators
Timeless Charts includes built-in indicators designed to work correctly on custom charts. Indicators can be attached, edited, and removed using the Indicators menu on the title bar.
- Attach: Title bar → Indicators → select an indicator to add.
- Edit: right-click the indicator (or its subwindow) → Properties.
- Remove: right-click the indicator (or its subwindow) → Delete.
- Subwindows: some indicators appear in their own subwindow below the main chart.
- Resize subwindows: drag the separator between subwindows.
- Templates: templates can store indicators together with chart type, drawings, and theme.
Screenshot: Indicators dialog (attach / edit / remove)

Some indicators (Market Profile, Volume Profile, Cumulative Delta) build data progressively and may require sufficient historical data to produce meaningful results.
8) Market Replay
Timeless Charts includes a Market Replay feature that allows you to replay historical market data as if it were happening in real time. Replay is useful for study, practice, strategy validation, and understanding price behavior in specific market conditions.
- Replays historical price action using tick data.
- Supports custom chart types (seconds, tick, volume, renko, etc.).
- Allows indicators, drawings, and chart interaction during replay.
- Enables manual trade simulation.
Market Replay is accessed from the Replay button in the title bar. When replay mode is active, chart updates are driven by the replay engine instead of live market data.
- Replay requires historical tick data for the selected symbol and period.
- Replay behavior depends on the quality and completeness of the broker’s tick data.
- Replay is independent from MetaTrader’s Strategy Tester.
A complete, step-by-step explanation of the Market Replay workflow (including configuration, controls, and practical examples) is available in the dedicated article below:
Market Replay in Timeless Charts — Detailed Guide
Market Replay is especially effective when combined with Templates, allowing you to replay the market using the same chart type, indicators, drawings, and visual configuration used in your live analysis.
9) Cluster / Footprint & Bars Statistics
Timeless Charts provides two complementary order-flow visualization features: Cluster / Footprint (volume-by-price inside each bar area) and a Bars Statistics panel (a table of bar-level metrics).
- Cluster / Footprint is rendered as a background behind price bars/candles.
- Bars Statistics is a panel (table) displayed at the bottom of the main subwindow.
- Both are visual features of the chart and are configured through the Theme options.
- If the footprint is not visible, it is need to zoom in the chart. Use the key (+) or the buttons on the right-bottom corner of the chart.
9.1 Cluster / Footprint
Cluster (footprint) visualization displays volume-by-price information aligned to each bar. It is drawn as a background layer behind the bars/candles and can use text and/or colored cells (and optional mini-profiles) depending on the selected theme configuration.
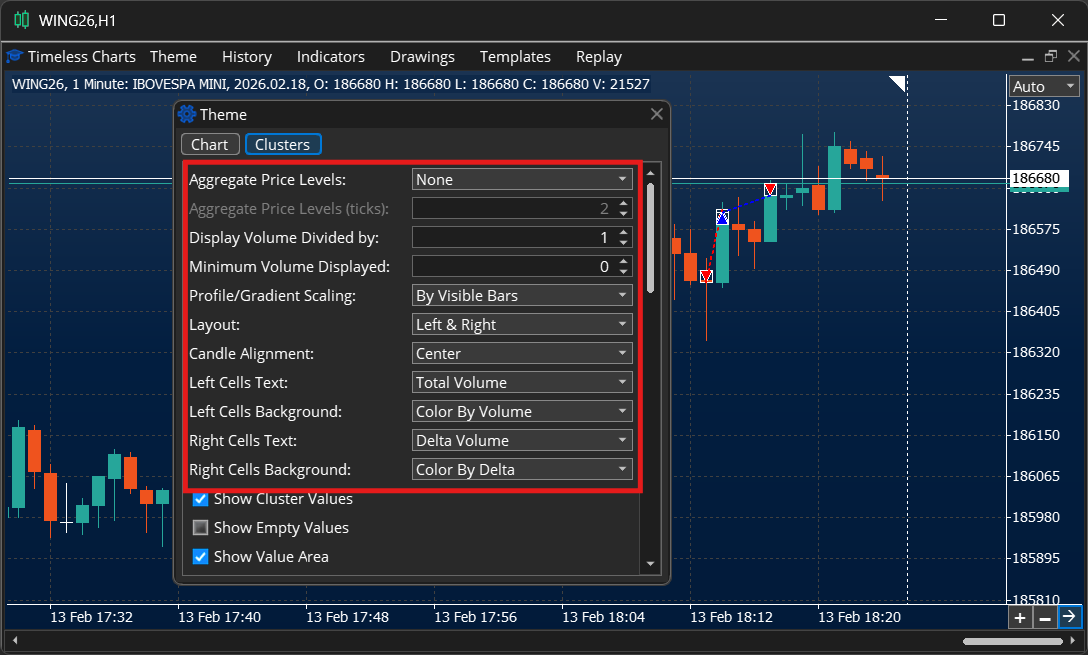
The footprints / clusters are configured with various parameters:
- Aggregate price levels:
Used to consolidate X price levels in a single row. For example, when using a chart configuration like range bars with big value for the brick size, like 200 ticks. Each means each bar has 200 price levels to be represented in the footprint, which sometime makes the height of each row so small that is impossible to display the numeric values. In this case we can choose to represent each row as the aggregation of 10 ticks and now only 20 rows will be draw making the display of the footprint data clear. - Display volumes divided by:
in some cases the values to be represented can be very large to fit inside the width of the cell / candle. For example, 1.500.500. In this case we can display all values divided by 1000 and the output in the screen will be 1.500. - Minimum volume display:
This parameter allows to display only the values above a threshold. Redcucing distraction / noise to focus only on meaning full values. - Scaling:
How the data distribution (gradients or profiles) are represented depends the what is the maximum and minimum values. We choose to examine each candle indivially or relative to the sunrounding candles (Visible bars). - Layout:
Allosw to display only on footprint represention or two (one on the left and other on the right of the candle). - Candle Alignment:
When using the layout with two footprints, is possible to align the candle more on the left or the right, what make the width of one footprint more or less than the other. - Left Cells Text and Right Cells Text:
Determines which data will printed on each footprint. - Left Cells Background and Right Cells Background:
Determince the background of the cell will styled, if with a profit / histogram or with gradient of colors based on volume, delta, etc.
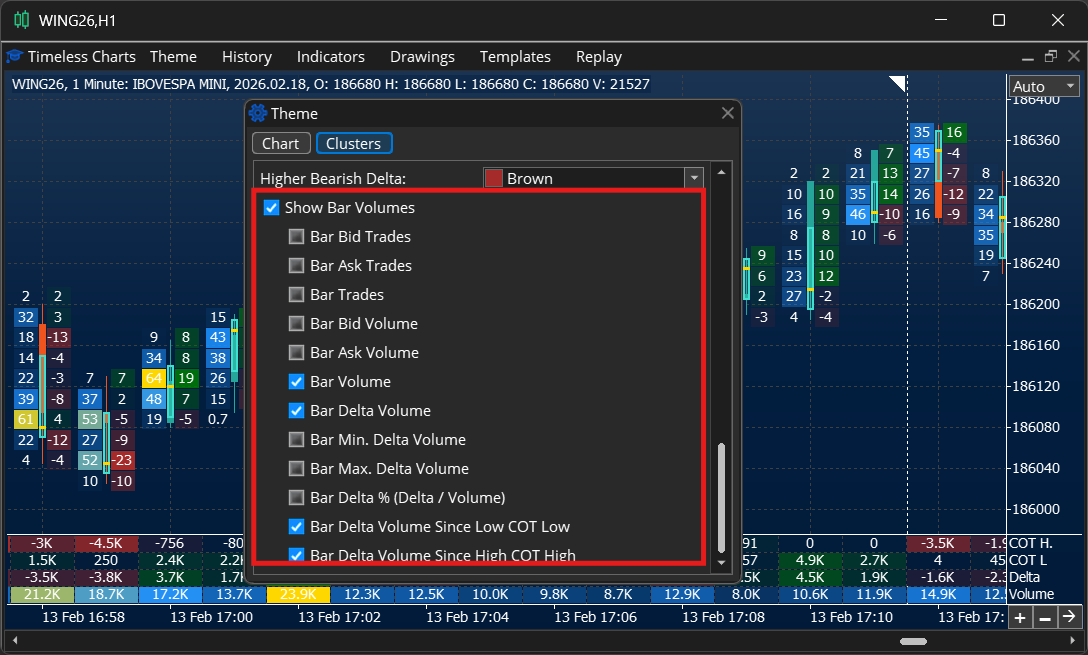
9.2 Bars Statistics Panel
The Bars Statistics panel is a table-like panel displayed at the bottom of the chart, just above the date/time scale. It shows bar-level statistics and order-flow metrics.
It can be enabled in the Clusters section just at the end of the parameters list.
The exact set of fields available in the Bars Statistics panel can vary by configuration and data availability. Detailed definitions can be added later.
Cluster/footprint and bar statistics rely on tick/volume data. The accuracy and completeness of the output depends on the quality of the broker’s historical data.


")
