
0
102
You bought it. It's in your Indicators folder. Now what?
Here's the short version: you drag it onto a chart and it's already working. No setup screen, no "configure your inputs first", no eight-page PDF. The lever bites into the chart, the console lights up, and the tool starts explaining itself to you. That's the whole install.
The long version is this post — five minutes, and by the end the chart is talking to you.
Minute one: it's already running
Drop SmartLine on any chart. Before you touch anything, the lever is already drawn — it anchors itself a few bars back and starts measuring. The console appears with live numbers on it. Nothing is greyed out, nothing is waiting for you.
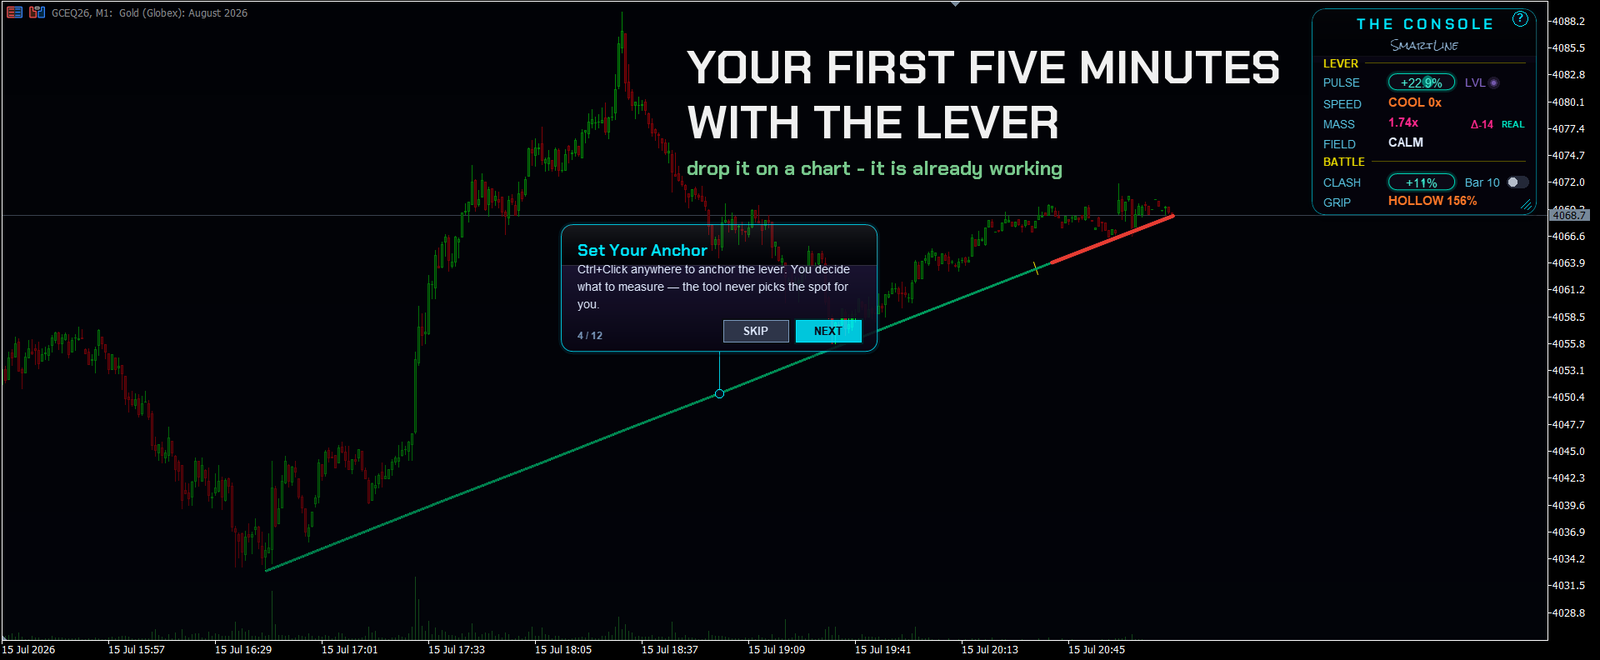
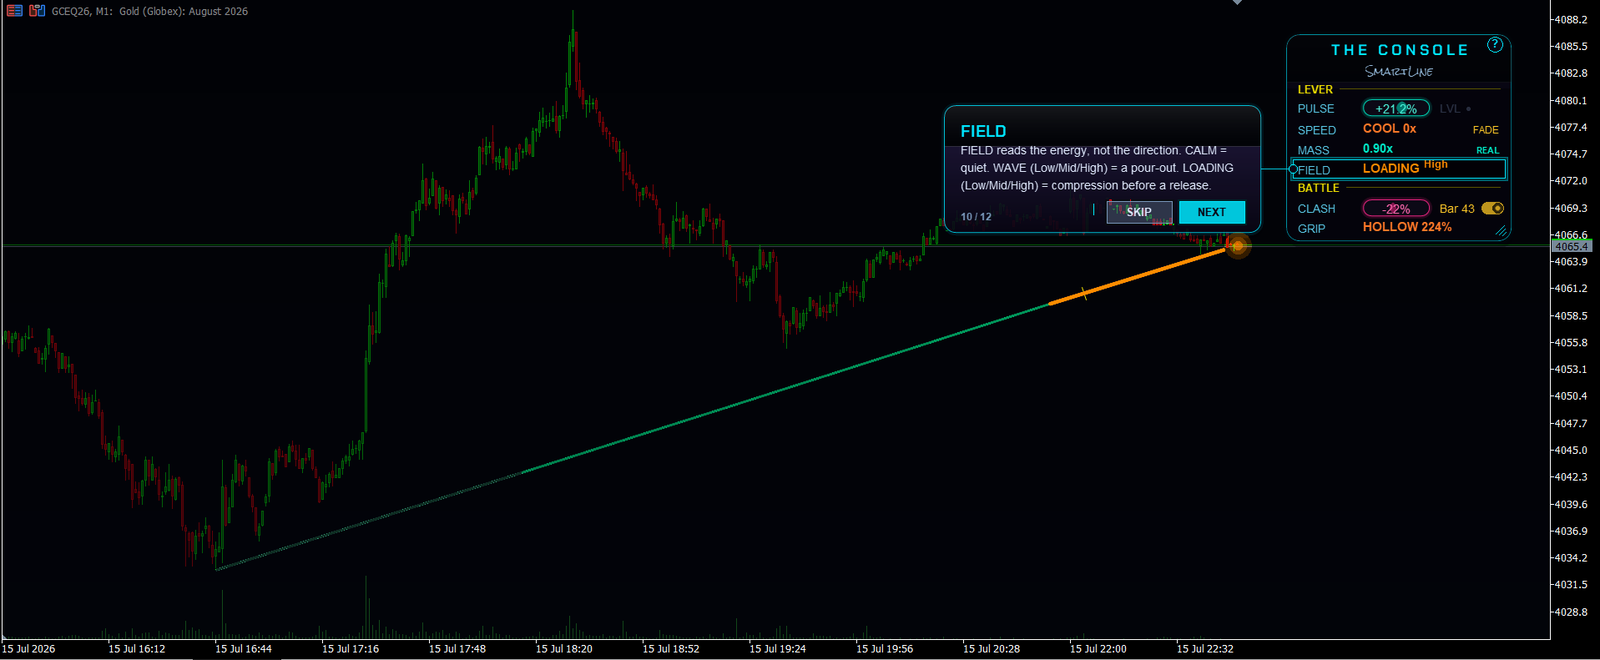
Then the tutorial opens on its own. Twelve steps, drawn over your own chart, pointing at your own lever with your own symbol's numbers in it. Not a video of someone else's screen. Steps 1 to 3 explain what you're already looking at, steps 4 and 5 hand you the controls, and 6 through 12 walk the console one row at a time.
It runs once. After that it never bothers you again — and the '?' button in the corner of the console replays it any time you want.
One thing worth doing in minute one: if you trade on a white or light chart, change the skin. The default is Neon Dark and it's built for dark charts — on white it washes out. Open the indicator's properties, first input, pick Light Paper. There are five skins in there (Neon Dark, Light Paper, Graphite, Gold, Console) and one of them fits your chart. No chart of yours is the wrong chart.
Minute two: make it yours
Ctrl+Click anywhere on the chart. That's it — that's the whole product.
The lever tears itself out of its default spot and re-anchors where you clicked. From that point to the current price it reads the live fight between buyers and sellers, updating on every tick.
You don't have to aim carefully. Click roughly at a swing high and the anchor snaps onto the actual high of that bar — high, low or close, whichever is nearest your cursor. Two traders clicking the same swing get the same reading. That matters more than it sounds: your measurement is reproducible, not a hand-drawn guess.
And it remembers. Close the terminal, come back tomorrow, and your anchor on gold is exactly where you left it. Move to another symbol and that symbol has its own anchor waiting. The lever also lives in time and price, not in bar numbers — anchor a swing low on H1, drop to M5, then M1, and it keeps measuring that same point in finer and finer resolution. Nothing shifts. Nothing breaks.
Shift+Click sets the Battle Zone — how far back the live fight is measured. Click the LOCK switch and that width freezes as a distance, so the zone slides forward with price. Set it once, forget it exists.
Minute three: read the lever without reading anything
Now look at the line itself, before you look at the console.
The lever is not one flat colour. It's coloured along its length, and where the pressure behind the move was thin, it fades toward grey. So a lever that runs green and then turns red near the end is telling you a story in one glance: buyers built this move, sellers own it right now.
That's a divergence, and you read it without a single number — the move and the moment disagreeing with each other. On the chart above: a green body, a red final stretch, and a console showing pressure positive while the live battle reads negative. Two ways of seeing the same disagreement.
The lever also gets thicker. When the current bar goes heavy relative to its own normal, the line grows — twice, at two levels of heavy. Weight you can see peripherally, without reading anything. Most tools put volume in columns down the side of your chart or stuff numbers inside your candles. This one puts it in the line you're already looking at.
Minute four: what the console adds
The lever gives you direction, weight, and where the push was weak. The console gives you the things a line can't show:
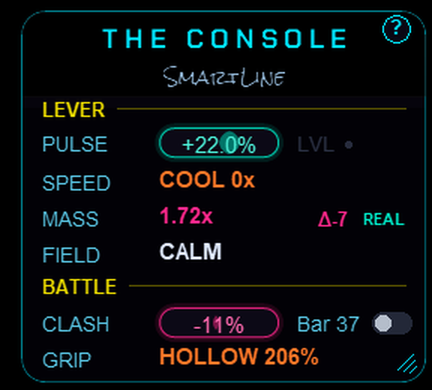
PULSE — the overall balance of pressure, buyers versus sellers, across the whole lever. LVL lights up when price is sitting on a key swing level, because pressure at a level means more than pressure in open air.
SPEED — momentum in plain language. GAIN, HOLD, COOL. And FADE, which flags a move running out of steam: the engine bleeding revs before the corner while the herd is still flooring it.
MASS — how heavy the move is, per unit of range. This is what thickens the lever.
Who is pushing. On exchange feeds with real volume, MASS is coloured by whoever is behind the live bar — green buyers, red sellers — and a Δ tag flags a heavy, one-sided bar. It says REAL when the volume is real. On forex and CFD there is no true buy/sell volume, so MASS stays neutral and the panel says tick. We could have coloured it anyway. Nobody would have checked. We don't.
CLASH — the balance inside your Battle Zone specifically. Compare it against PULSE and you have the divergence read in numbers.
GRIP — effort versus result. WALL means aggression is hitting a wall of limit orders and price refuses to move. SOLID is normal traction. HOLLOW means price slid with almost nothing behind it — the fake-out texture.
Minute five: FIELD, and the thing we're proud of
FIELD reads the energy in the move.
CALM is quiet. WAVE (Low / Mid / High) is energy pouring out — a release in progress. LOADING (Low / Mid / High) is compression building, a spring being wound.
Plenty of tools will tell you the market is squeezing. Most of them are reading the shape of the bars. Ours isn't. The grading behind CALM / WAVE / LOADING came out of measuring the thing itself — across gold, crude, indices, crypto and forex majors, on M5 through H1 — until it was clear when a compression is real and when it's noise. That's why FIELD reads the same on any liquid instrument instead of being tuned to one symbol and quietly failing on the rest.
And FIELD will never draw you an arrow. Not because we didn't think of it — because we went and checked what compression can and cannot tell you. A tool that claims to measure the size of a move AND call its direction is lying to you about one of the two. FIELD hands you the charge. The direction is your craft. That's why you're a trader and not a subscriber.
Where to put the anchor — suggestions, not rules
The tool never picks the spot. But if you're staring at a chart wondering where to stab it:
Your last trade's turning point. The one place every other indicator refuses to measure from.
The session open. Everything since the bell, in one line.
The news candle. Anchor on the spike and watch whether the follow-through has any weight behind it or is running on fumes.
The neckline. On a W, the peak between the two lows; on an M, the trough between the two highs. Anchor there and the lever tells you whether the break has mass behind it — or whether it's HOLLOW and about to embarrass somebody.
The pullback high or low inside a trend. Anchor at the correction and measure only the leg you actually care about.
Move the anchor and the whole story changes. That's not a quirk — that's the instrument. One lever, three places on the same chart, three different truths.
So: drop it on a chart, let the tutorial run, Ctrl+Click your last trade's turning point, and tell me in the comments what the lever showed you that your old chart didn't.
Previous post in this series — why the lever exists at all:
You Don't Need Another Indicator. You Need a Lever. — https://www.mql5.com/en/blogs/post/773023
SmartLine -> www.mql5.com/en/market/product/185939