Volume Profile, Footprint Charts and CVD: Is Your Data Real — or a Proxy?

But there is one question almost nobody asks before using these tools:
What data is actually feeding them?
The answer changes what your charts really mean. Let's keep it simple.
The three tools in one minute
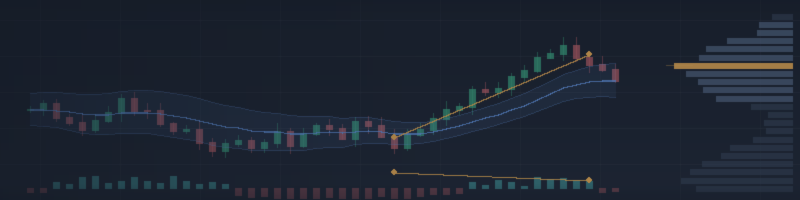
Volume profile shows traded volume at each price level, not at each time. The result is a histogram on the side of your chart. Key levels: POC (the price with the most volume), and the value area (where ~70% of volume traded).
Footprint chart goes one step deeper. Inside every bar, it shows how much volume traded at each price — split into buy volume and sell volume.
Cumulative volume delta (CVD) takes the difference (buy volume − sell volume) for every bar and adds it up over time. Rising CVD = buyers more aggressive. Falling CVD = sellers more aggressive.
All three sound similar. But they need very different data quality.
What "real" data means
On a real exchange (futures, stocks), every trade is recorded with three facts:
- Price — where the trade happened
- Size — how many contracts
- Aggressor side — did the buyer or the seller cross the spread?
With these three facts, a footprint chart and a CVD are measurements. You are counting real events.
What your broker feed probably contains
Now look at a typical MT5 forex or CFD symbol. The feed is usually quote-only:
- You receive bid/ask price updates.
- "Volume" is tick volume — the number of price changes, not the traded size.
- There is no aggressor flag. Nobody tells you if a tick was a buy or a sell.
So on this feed, real footprint data and real CVD simply do not exist. Anything your indicator shows must be estimated from price movement.
That estimate is called a proxy.
How proxy data is calculated
Two classic methods, both simple:
1. The tick rule (Lee–Ready style). Compare each tick to the previous one:
price went up -> count tick volume as BUY price went down -> count tick volume as SELL price unchanged -> use the previous direction
Do this tick by tick, sum per price level, and you get a proxy footprint. Sum per bar and you get a proxy delta.
2. Close location value (CLV), when you only have bars. No ticks at all? Use where the bar closed inside its range:
CLV = ((Close - Low) - (High - Close)) / (High - Low) // between -1 and +1
delta = Volume * CLV
A bar that closes at its high gets CLV = +1: all of its volume is treated as buying pressure. A close in the middle gives CLV = 0: neutral. Add the deltas up and you have a proxy CVD.
Both methods are honest approximations of pressure. Neither one sees real trade size or the real aggressor.
So is proxy data useless? No — but label it.
Here is the fair picture:
- Volume profile survives best. Tick volume correlates well with real activity, so the shape of the profile — POC location, value area, high and low volume nodes — is usually similar to the real one.
- Footprint charts suffer most. A footprint's whole promise is real buy/sell volume at each price. A proxy footprint is a price-movement picture wearing a footprint costume. It can still be useful — but it is not the same instrument.
- CVD sits in the middle. A proxy CVD tracks directional pressure, and it often looks convincing. But its "delta" is derived from price. When you then use it to explain price, be careful: part of the reasoning is circular.
Three practical rules
- Know your feed. Ask: does this symbol deliver real size and aggressor side, or quotes only? On most FX/CFD feeds, the answer is quotes only.
- Label your tools. If your CVD is CLV-based, call it a pressure proxy, not order flow. Honest labels protect you from wrong conclusions.
- Test the claim, not the picture. A proxy indicator can look identical to a real-data one and still carry different information. Before you trade a signal, test it on your own data, your own symbol, your own costs.
The tools are not the problem. Unexamined data is. Once you know exactly what your volume profile, footprint chart and CVD are built from, you can use them for what they truly are — and stop asking them questions they cannot answer.
Where I practice what I preach
These rules are not theory for me — they are design requirements for my own tools.
My MetaTrader 5 indicator Volume Trio puts the tools from this article on one chart: a session volume profile (POC, VAH/VAL, value area), a CVD pressure histogram with a strict divergence engine, and anchored VWAP with standard-deviation bands. It follows the rules above by construction: everything is computed on closed bars, deterministic on every reload — and the product page states openly what the data is: a pressure proxy built from provider-local volume, not centralised order flow.
The free edition reads the chart it is attached to: Volume Trio (free)
The Pro edition, Volume Trio Multi, adds what a single chart cannot give you: a watchlist scanner that runs the same three layers across up to 50 symbols in your Market Watch and alerts you on confluence — for example a sigma-band tag, a confirmed divergence and a key zone reported in one alert. It also adds composite profiles, a developing POC trace, and naked POC tracking. It promises time, not profit: you cannot watch thirty charts at once, but it can.
If this article's way of thinking makes sense to you, the tools will feel familiar: they tell you where and when to look. The decision stays with you.




