![[ From $5,000 To $27,000 ] Using This GOLD Scalping Strategy [ACRON Supply Demand EA]](https://c.mql5.com/6/986/splash-765666-1764160492.png "[ From $5,000 To $27,000 ] Using This GOLD Scalping Strategy [ACRON Supply Demand EA]")
[ From $5,000 To $27,000 ] Using This GOLD Scalping Strategy [ACRON Supply Demand EA]

Hello traders,
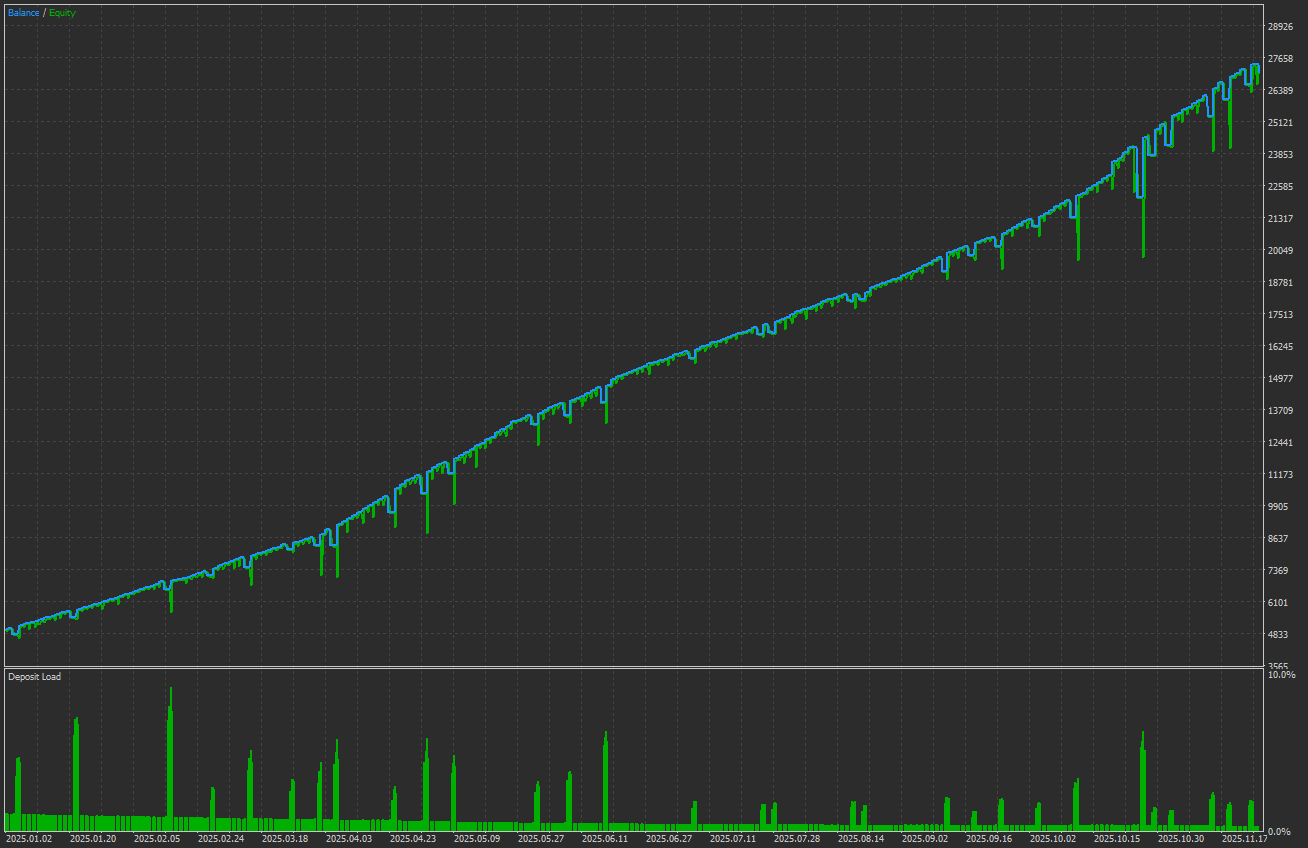
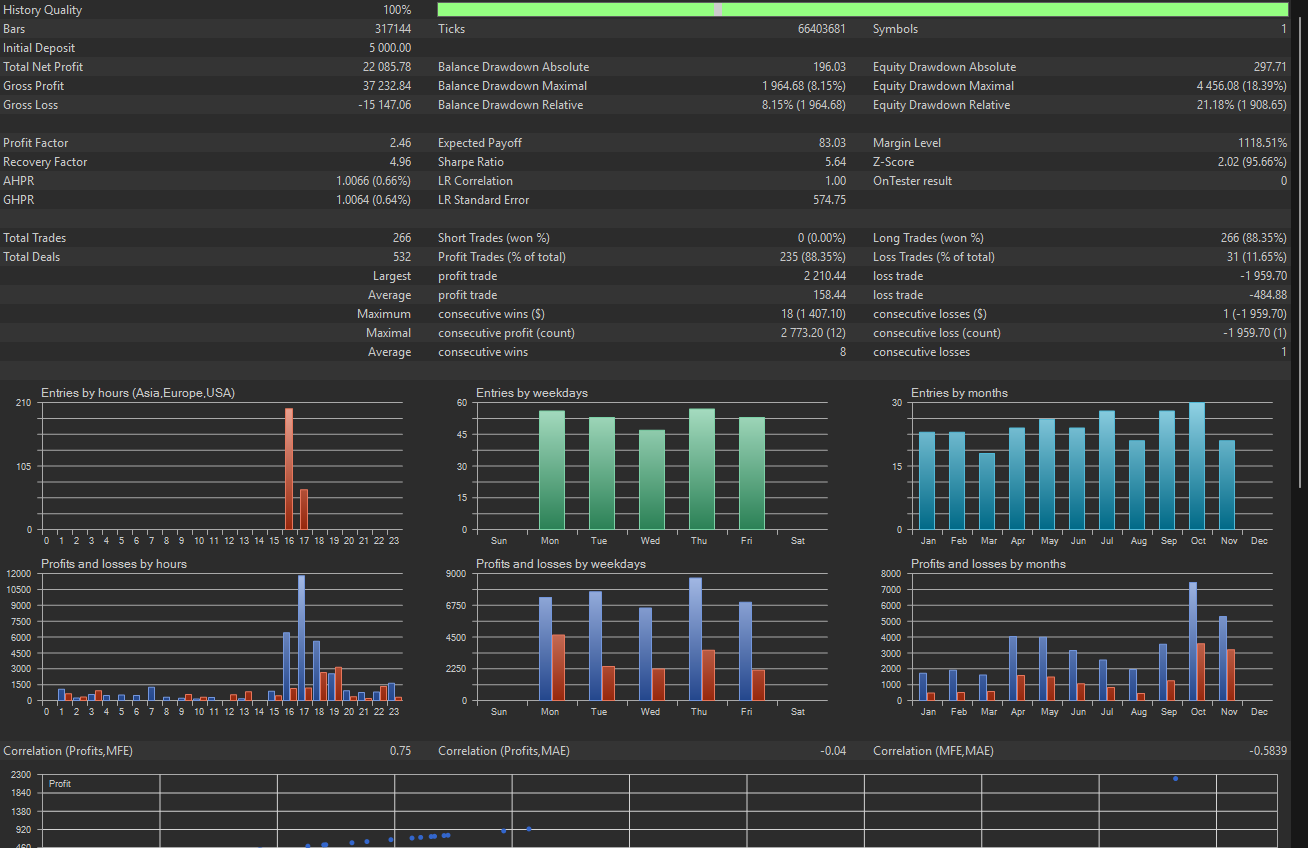
On this blog post i present you a fully automated strategy for ACRON Supply Demand EA. Strategy was created to trade GOLD M1 timeframe. In 11 months of trading activity managed to achieve +440% profit with only 21.18% drawdown. One of the key strengths of this strategy is that the EA does not overtrade. It executes trades only during the first hour of the New York session, when market volatility is high. This time-based filter helps the system avoid low-quality setups, reduces unnecessary exposure, and increases the probability of catching strong momentum moves.
This strategy has been optimized specifically for GOLD M1 pair to ensure its best performance. Using it on other pairs may not yield the same results. For any question do not hesitate to contact us.
ACRON Supply Demand EA Link: https://www.mql5.com/en/market/product/150278
For the backtestings, Vantage Markets was used as the broker. If you want to trade under the same conditions, you can open an account using the following link.
🔹Backtesting Strategy Details
🔹Backtesting Strategy Details
Pair: GOLD M1
(Backtesting on the M1 timeframe can be slower than higher timeframes, as it requires processing more detailed market data)
Backtesting Period: 1 January 2025– 26 November 2025 (Total duration: 11 months)
Starting Capital: $5,000
Money Management : Fixed Lots
LotSize Per Trade: 0.1 Lots
(You can adapt the strategy to your own account size by using 0.01 lots for every $500 of capital)
Final Balance: $27,085
Total Net Profit : $22,085
Overall Growth: +440%
Relative Equity Drawdown: 21.18%
Account Leverage: 500:1
Modelling: Every TIck
Tested Broker: Vantage Markets, Raw Spread Account
(This broker provides low spreads, low slippage, ensuring live trading performance will match backtesting results)
On the following photos you are able to see the Graph and the Statistical results from the Strategy Tester.


")

")