")
Sapphire Strat Maker - Insights on strategies optimization and efficiency (part. IV)

1. Introduction
This is the continuation on Sapphire Strat Maker and Sapphire Strat Maker Alt (Free) expert advisor - an EA which allows you to create your own strategy without coding. This is the beauty of this Expert Advisor: create your own strategies - be creative - and don't be locked to a single strategy anymore. Optimize the parameters you want to find the best sets and you're ready to go!
Before continuing, check out the other blog posts:
- Documentation - General information
- Documentation - ENUMs information
- Documentation - Indicators
- Documentation - Indicators buffers
2. Insights when/after optimizing your strategy
From my experience, optimizing a strategy is not as easy as it looks like. You could just set a big range for the parameters being optimized, wait for the optimization to finish and choose for the best profitable one. This may not be the best choice for the user, though. Finding the best parameters can actually be quite dangerous due to overfitting. In portuguese there's a saying that literally could be translated to something like this: "the perfect is the enemy of the optimal; the optimal is the enemy of good". This means that you can even find the perfect parameters, but it may be so overfitted to the backtested period that it just ends up losing way more than winning.
But what is overfitting? Overfitting means that you optimized your strategy so much that it only works well for that specific period of time and can not generalize when new data comes.
Avoiding overfitting is quite a really hard task, but there're a few simple things we can do to reduce its effects. Let's see a few of them - as I said, simple stuff can reduce your risks of overfitting - and other ideias on how your strategy can be pushed to its maximum efficiency.
This is an non-exhausting list on this topic. More blog posts about this may come.
2.1. Forward tests
Metatrader 5 offers excepcional functions for Expert Advisors; forward tests being one of them.
Forward tests reduce the chance of overfitting by doing blind tests with parameters found on a previous test on a certain period forward in time (thus the name). But to get maximum efficiency from forward tests, you need to define a good period in time - remember, market conditions change with market cycles, so the market today is not the same as the market from 10 years ago, nor are the players.
I defined my own rules from my tests, you can define your own. But my backtesting period is basically defined like this:
| Timeframe | Period |
|---|---|
| M1 to M10 | 1 year backtest + 1 year forward test (total = 2 years) |
| M12 to M20 | 1,5 year backtest + 1,5 year forward test (total = 3 years) |
| M30 to H2 | 2 year backtest + 2 year forward test (total = 4 years) |
| H4 to D1 | 2,5 years backtest + 2,5 years forward test (or more) (total = 5 years or more) |
With this we can define reasonable periods with a good amount of data, not too few, not too much. Of course you can adapt it with your experience aswell.
Another idea is using a second forward test. MT5 doesn't provide this, but you can manually do it. I don't do it usually, but if you want to feel safer, it's a good idea - just note that it may be harder to find a working strategy due to changing market conditions over the years.
2.2. Range of optimized parameters
Price movement tends to a certain logic. The challenge is to identify this logic when it is happening, considering it may change due to market conditions. A certain instrument in a specific timeframe may respect a certain moving average as support/resistance, while the same instrument on another timeframe may not, for example.
Regardless of anything, the players are composed by humans and robots (developed by humans). Their strategies may vary, but they always follow a certain logic. The majority of quantitative strategies follow logic numbers.
What is the most probable to happen: a price to respect a 20-period moving average as support/resistance or to respect a 279-period moving average? Of course the first. There's a reason: it is a logic number, used by a large amount of traders/robots. It is expected that the price hits that level and reacts in any way - either breaking it or reversing.
Always apply a logic when chosing your parameters - although this is not always possible.
Let's say I'm chosing the optimal parameters from a moving average. How should I do it? Just set the range of the period parameter from 1 to 300 with a step of 1 and hope for the best?
No. Think logically. Do you really need such a big range? Usually not.
The best option would take rounded numbers, such as 10, 20, 30, 40, etc. These numbers are the most probable to have an effect than a non-sense 134-period, for example. Also, even though not possible by the MT5 optimization feature, you could choose parameters values via Fibonacci numbers (1,2,3,5,8,13, etc.).
By limiting the possibilities of the optimization, you reduce the risk of overfitting, since all you want are good parameters, not the perfect ones for the testing period.
2.3. The best is not the best
Continuing from the last paragraph and as I said a few times here, you may not want the perfect parameters. There's a high chance they're overfitted to the testing period. If you still want to use the best, reduce the expiration time of your strategy described in the next section.
Take this from the strategy I'll show later in this post:
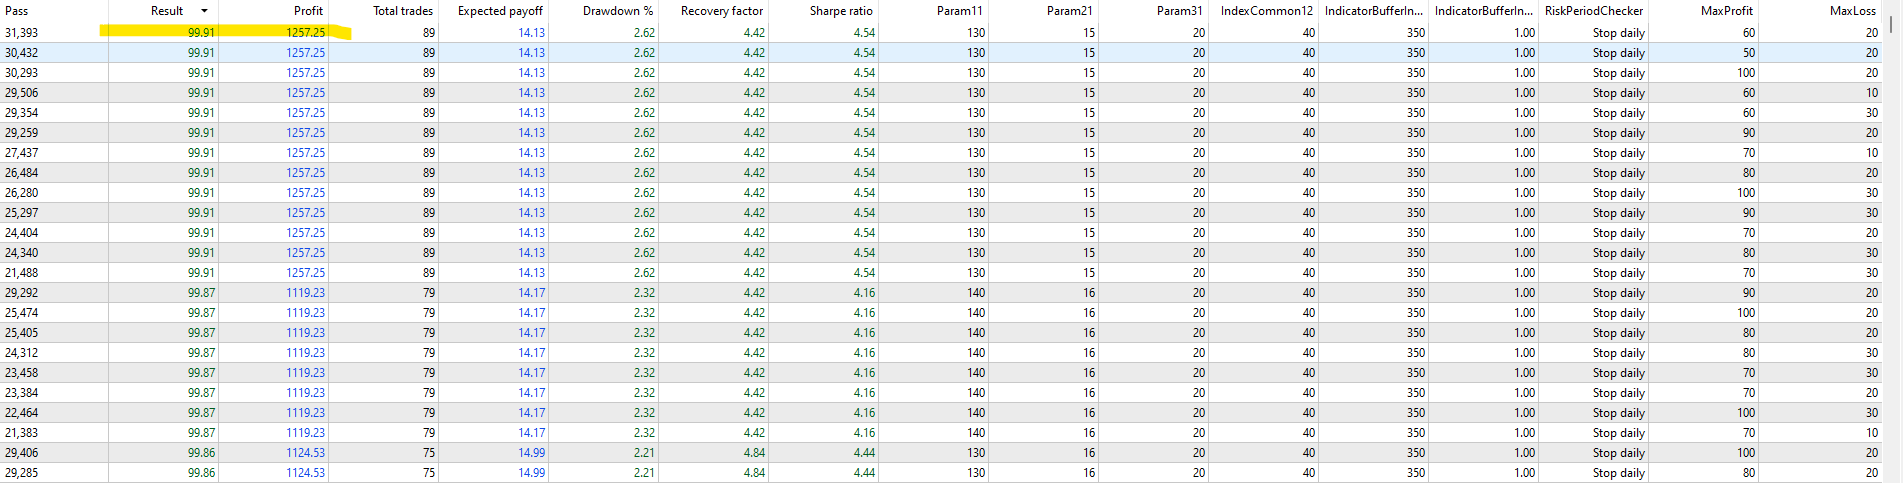
The highlighted was the best result in the backtests (1 year). Let's take a look at its result in the forward test (1 year):
![]()
Although still profitable, its results are way inferior from the backtest - period in which it was almost perfect according to the Complex Criterion. If we wouldn't have used a forward test, after a single year backtesting period, we would have profited, but way less than before - the strategy was clearly overfitted to the backtest period.
What we do then is to look at the Forward test tab and compare the results with the backtesting tab results. From what we can see on the next image, there're a few good results, but one caughts my attention:
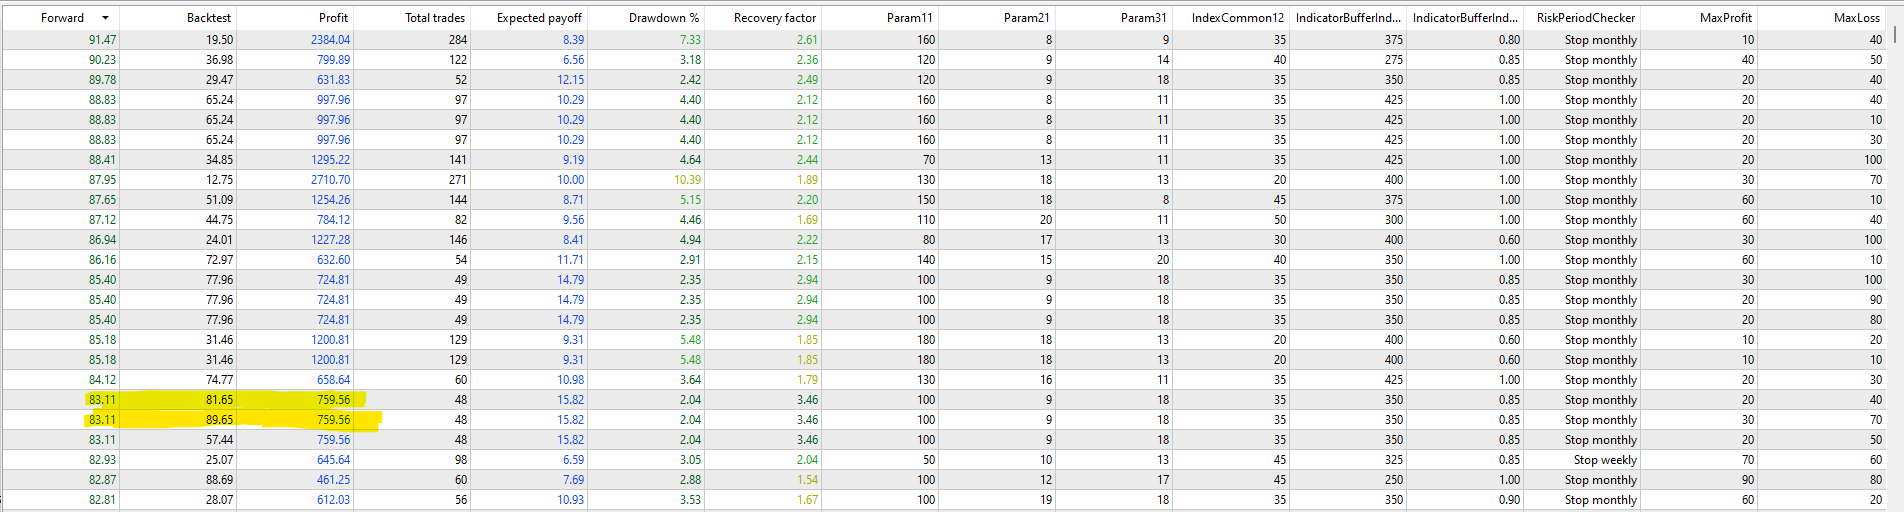
When using Complex Criterion, a value above 75 is pretty good. A value above 90 can be considered overfitted, but still nice. A value above 95 is probably overfitted and should not be used. The highlighted result shows a backtest result of 81.65/89.65 and a forward test of 83.11. The similarity of the results is an indicative the strategy is consistent and may be good to use.
Finally, know the Optimization criterion you're using. I find it best to use the Complex Criterion. If you use balance, drawdown, recovery factor or any other, be sure to not choose the best among the results.
2.4. Strategies stop working with time
Who wouldn't like a strategy that would work forever? That kind of holy grail, if it even exists - and I won't enter this topic here - is really hard to accomplish. 99.99% percent of the strategies will have an expiration date. The other 0.01% are not available for mere mortals and are designed by geniuses who won't really share their secrets (Jim Simons). Someday they will stop working - they 'die' just like they're born. Just like humans, we don't know when it'll happen, although we can define objective conditions to bury or rework a strategy.
Firstly, you can specify an expiration date for that specific strategy. Let's say you want to use the table shown above to optimize your strategy. After you find the optimal parameters, you can put it to work for 1/2 the time of the testing period (for example, if you created a strategy for M10, it should work for at least 1 year). This can be changed according to the strategy results (for example, if the strategy makes too many trades, this time can be reduced to 1/4). After this period, do not trade with it anymore until it is re-optimized or find another strategy.
Secondly, define a maximum drawdown for the strategy when in real life trading. A safe decision would be to limit its lifetime by the maximum drawdown taken by the tests. If the strategy has a really low drawdown, you can define its live trading drawdown to 2x the DD in the backtests. With this you define a condition to stop taking a possible bigger loss.
Thirdly, also define a maximum profit for the strategy. As said, the strategy will not may not work forever. If a certain profit is reached, take it and find another strat/re-optimize it using the new data collected from the period. Don't use the market as a casino.
3. Creating and optimizing a strategy
Let's put those ideas to work.
Firstly, we define the instrument and the timeframe. For this experiment, I'll choose the NZDUSD pair in the M10 timeframe.
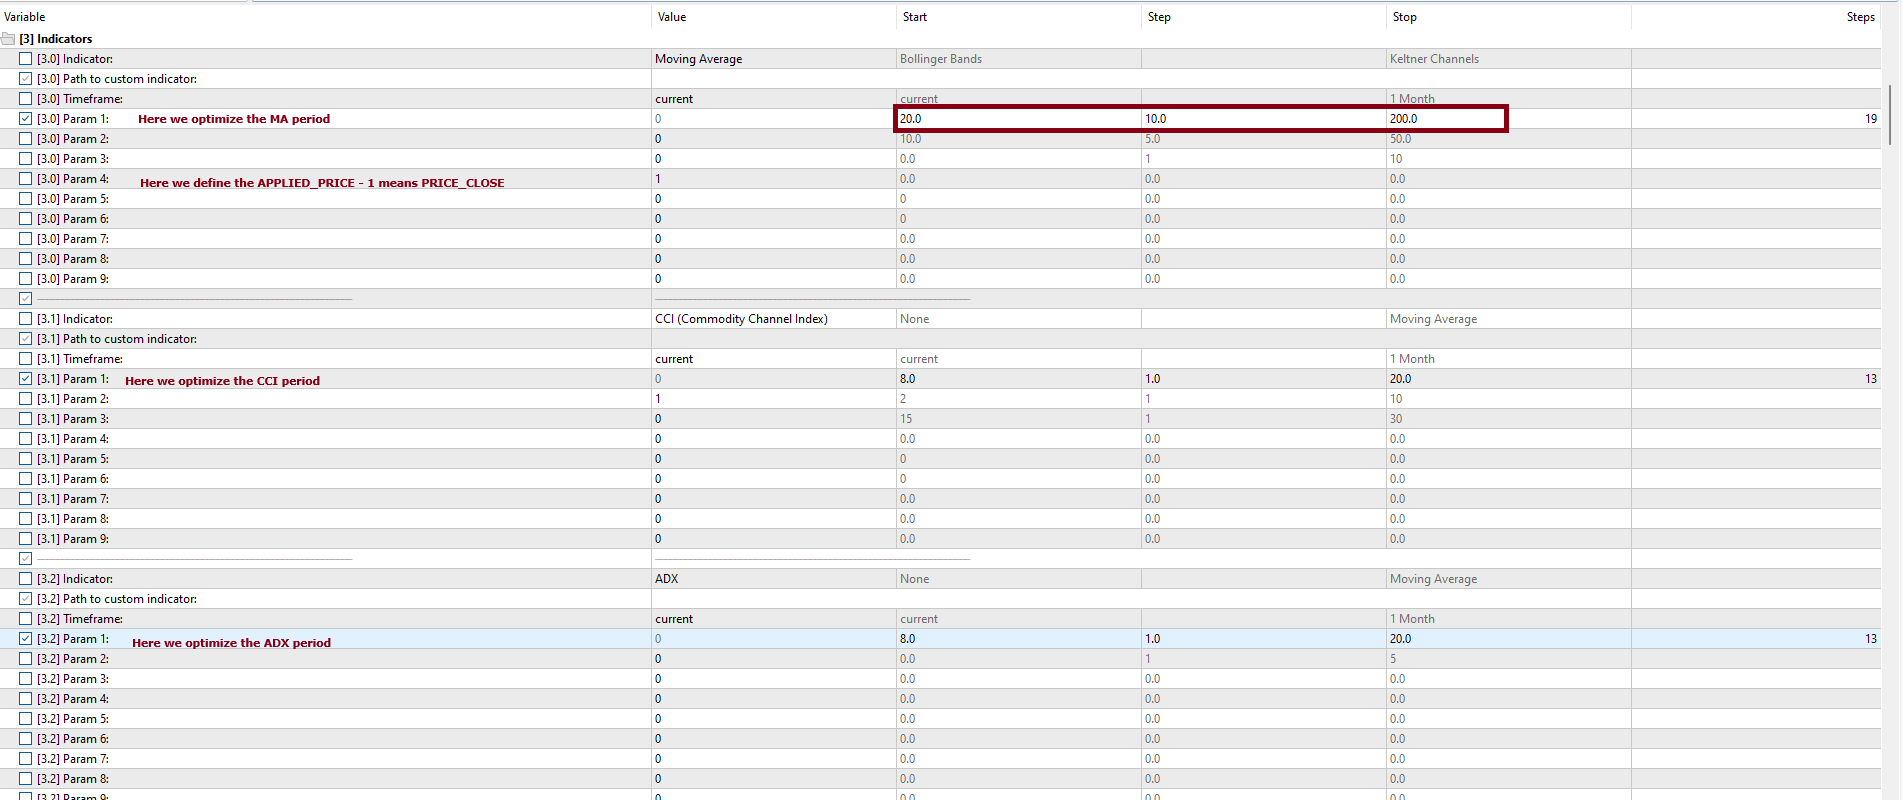
Secondly, let's choose our indicators. In this case, a moving average (to define the trend), a Commodity Channel Index (CCI - to define possible reversion levels) and an ADX (to define the trend strength).
Since we want to define the trend, and for now I don't care if the trend is a short, medium or long trend, I'll set the range for optimizing the MA period between 20 and 200, in steps of 10.
The most common CCI value is 14. It's fair to use the range for optimizing between 8 and 20 - 6 periods below, 6 periods above -, in steps of 1.
The most common ADX value is also 14. Let's use the same logic of CCI.
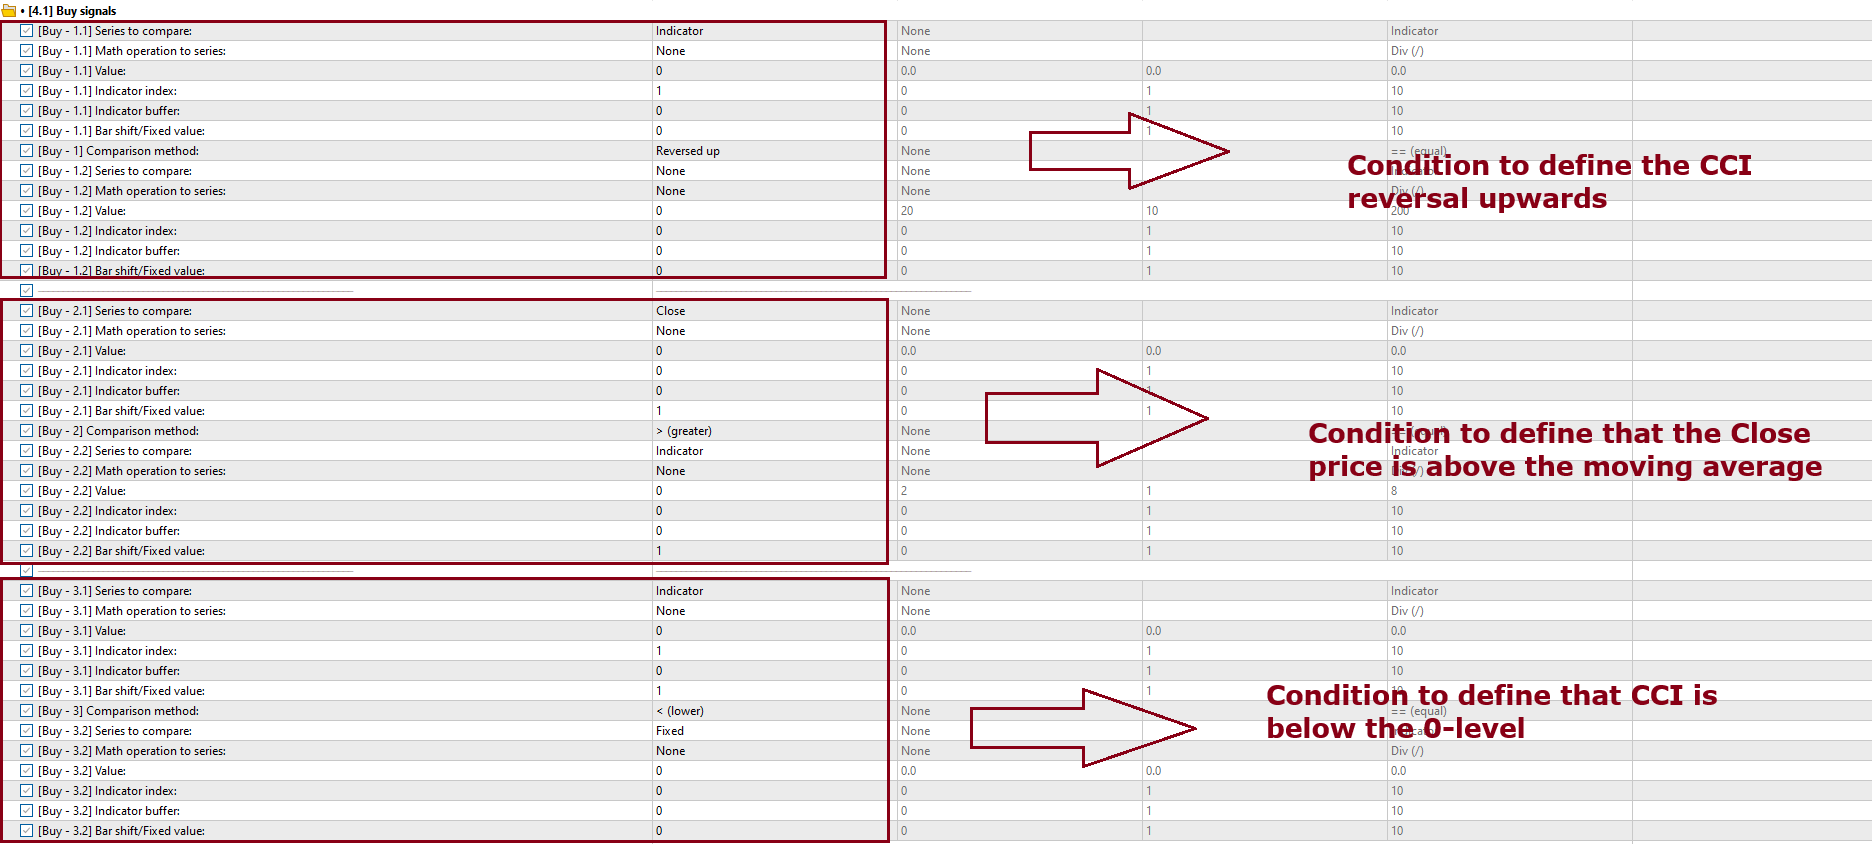
We're dealing with a simple strategy: when the CCI reverses upwards while it is below the 0-level, if the closing price is above the moving average and if the ADX is above the 35-level, we open a long position. When the CCI reverses downwards while it is above the 0-level, if the closing price is below the moving average and if the ADX is above the 35-level, we open a short position.
Also, we stop trading if in a month we reach a certain profit/loss. These shall range from U$ 10.00 to U$ 100.00.
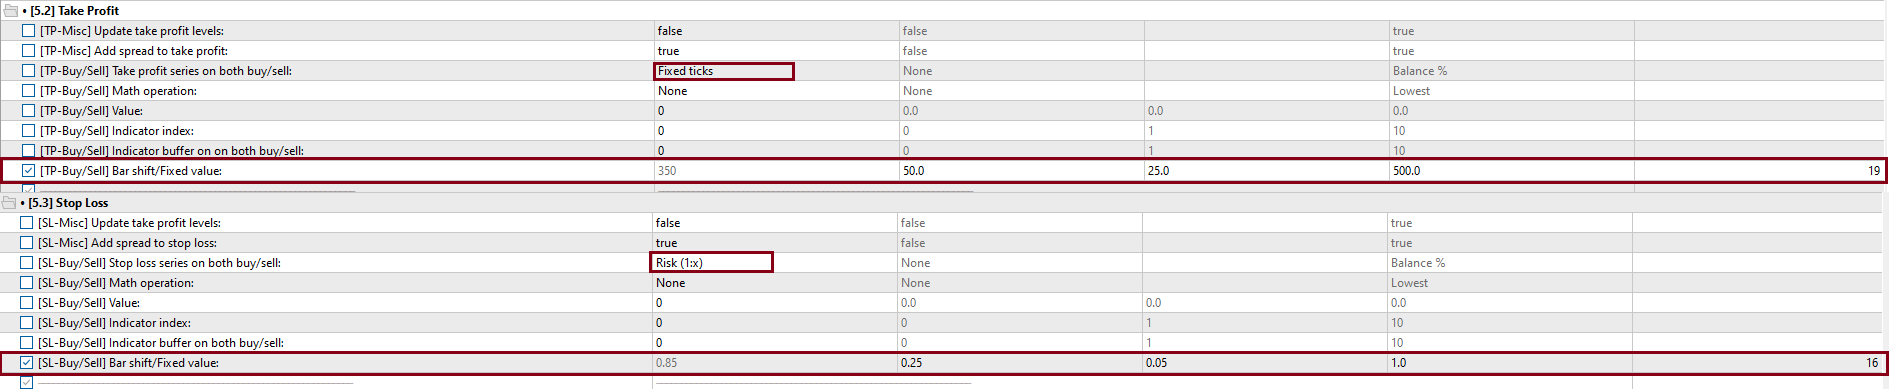
Our take profit is defined by a certain number of ticks to the entry price level that shall range from 50 to 500, in steps of 25. The stop loss is defined by a risk from the take profit and shall range from 0.25x to 1x the tp, in steps of 0.05.
The parameters for the indicators would be like this:
The entry conditions are set like this:
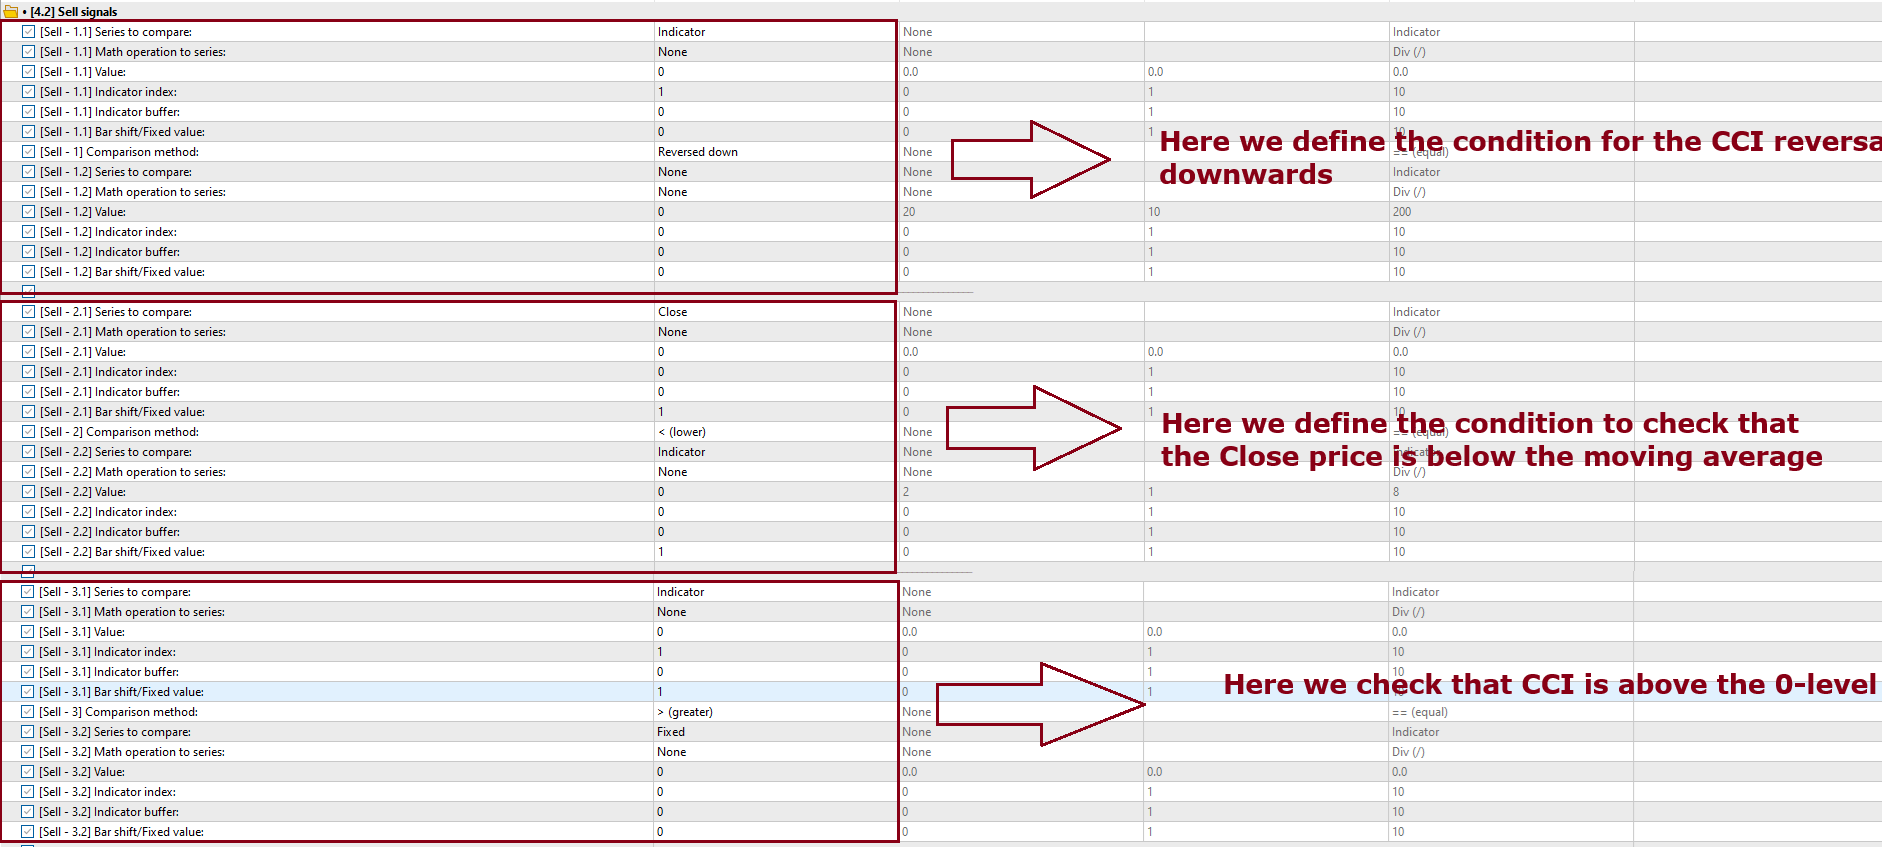
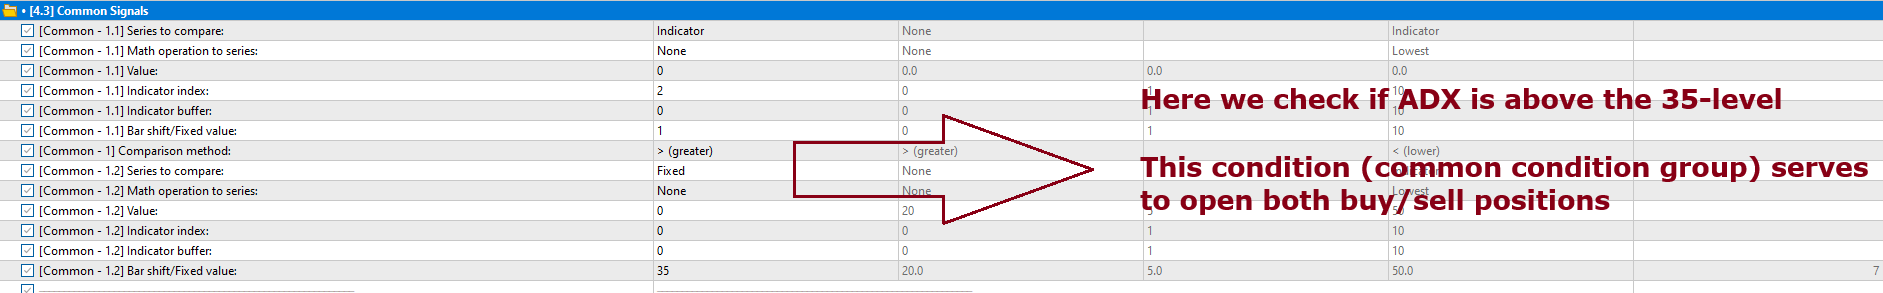
Notice that we also optimize the minimum level of the ADX, which ranges from 20 to 50, in steps of 5.
Take profit and stop loss levels are defined like so:
Finally, the money/risk is defined like this:

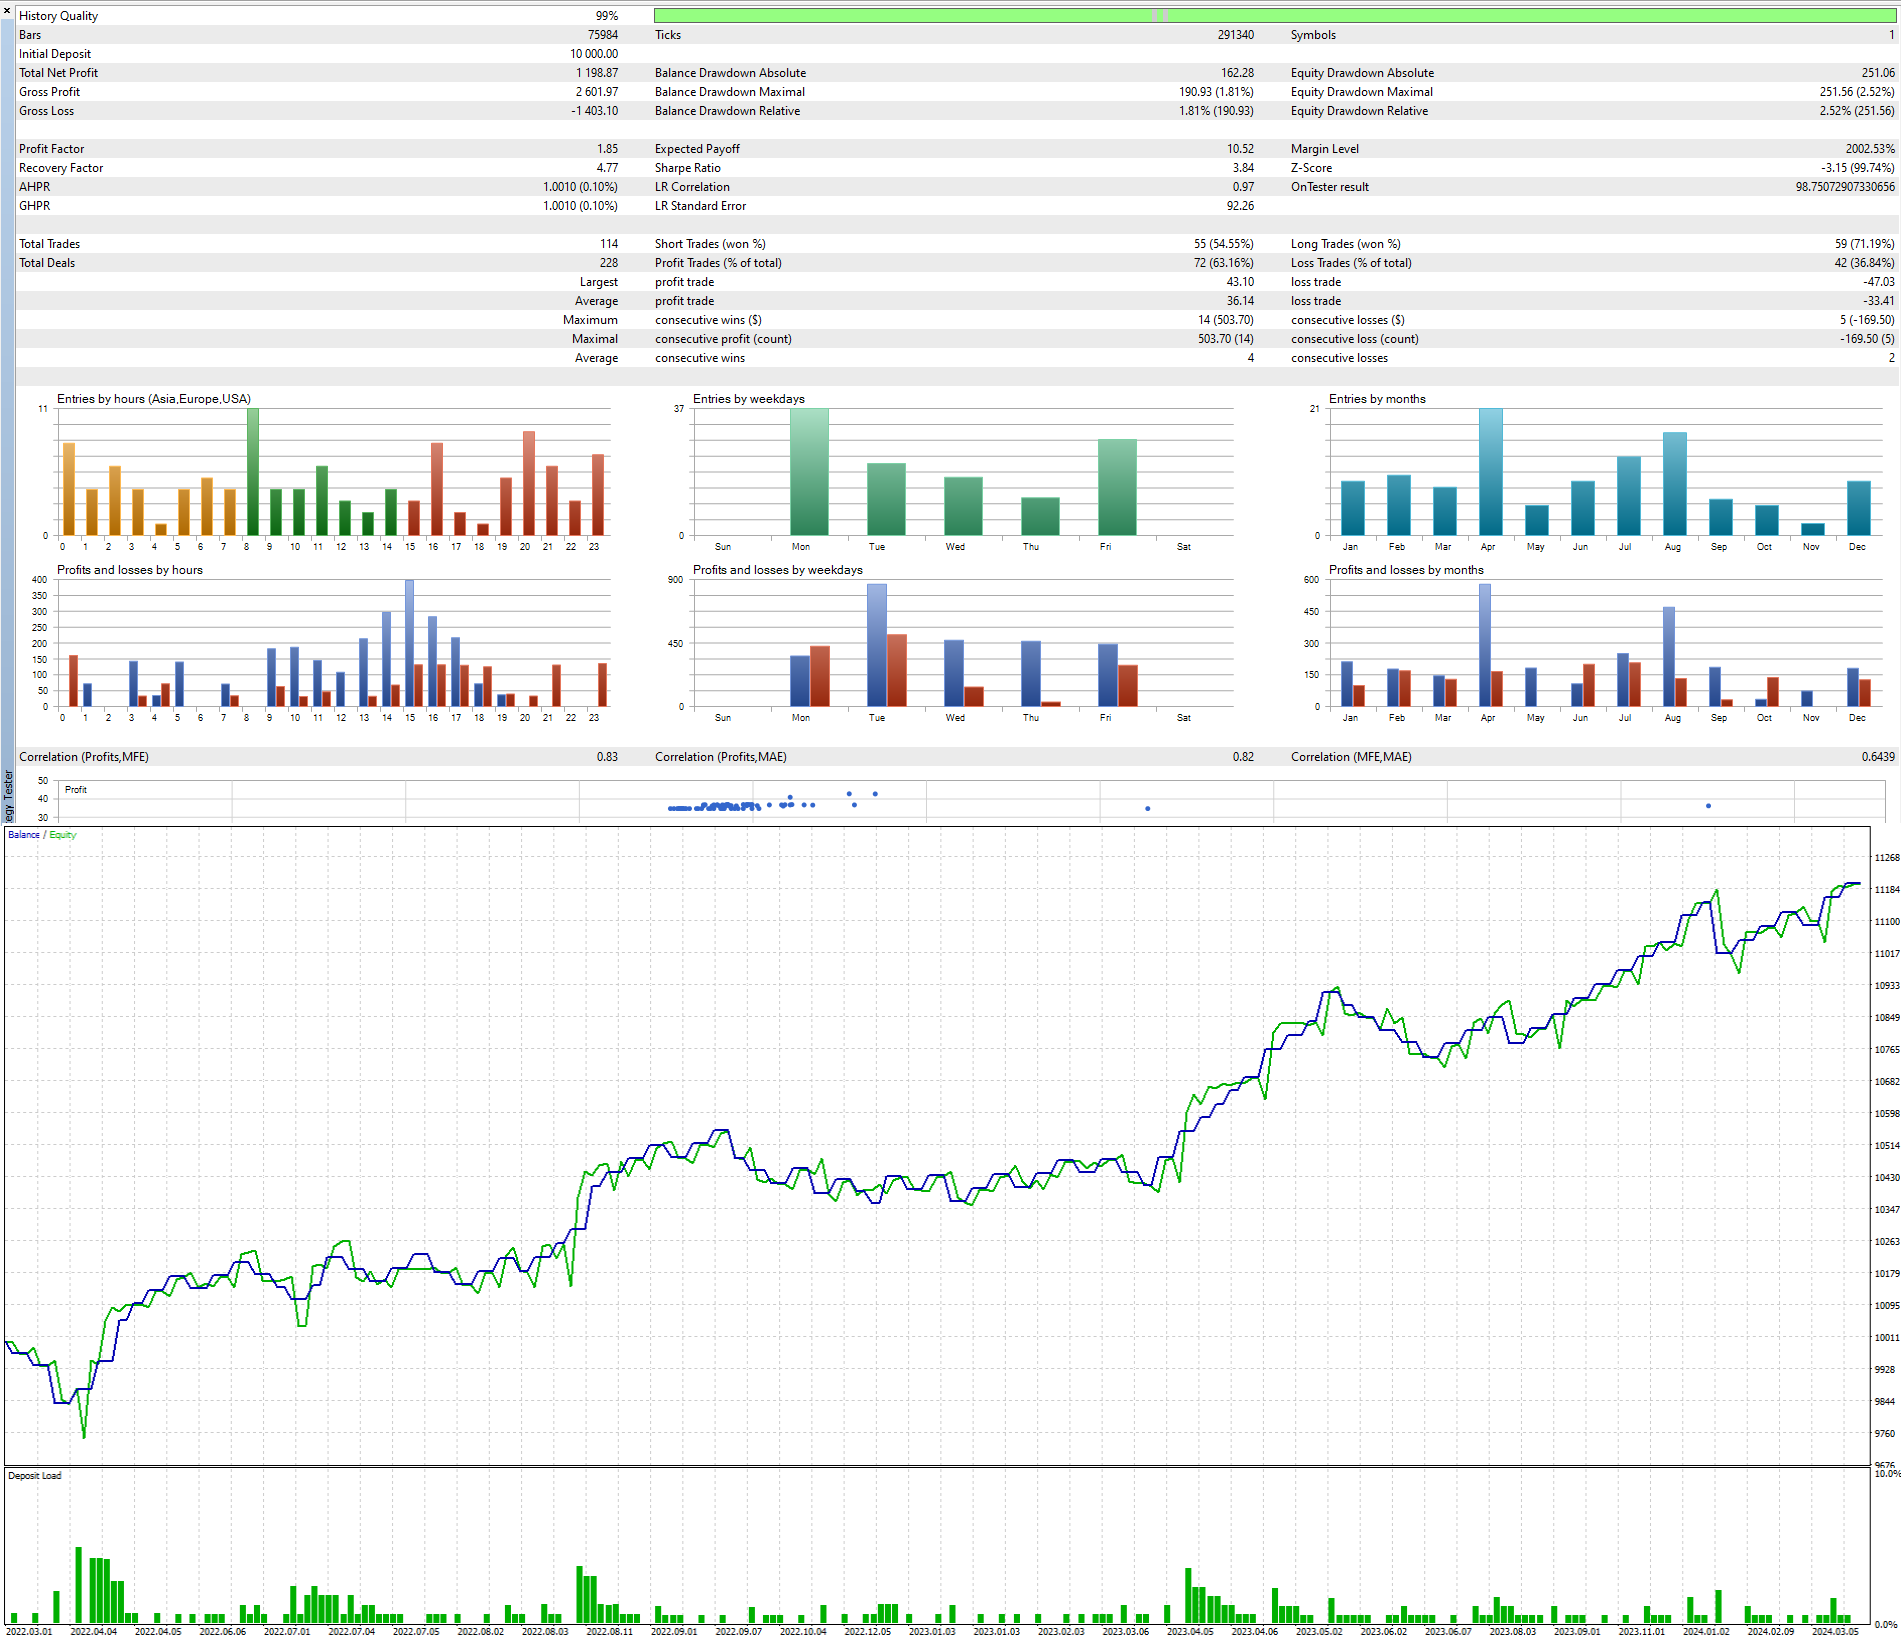
After optimizing for 2 years (1 year for backtest and 1 year for forward test) with the Complex Criterion in the Fast genetic based algorithm optimization type, I found this interesting result (yours may be different due to different brokers + due to how the fast genetic algorithm works):
![]()
As you can see, these are some good parameters:
Moving average period = 100;
CCI period = 9;
ADX period = 18;
ADX minimum level = 35;
Take profit ticks from entry price = 350;
Stop loss risk (1:x from TP) = 0.85 (this means that stop loss is 350 * 0.85 ticks);
Stop period after profit/loss = Stop monthly
Maximum profit = U$ 20.00
Maximum loss = U$ 40.00
These are the results for this:
But these parameters can be a bit more logical. Let's see.
The ADX period could be 20 - closer logical parameter that I can see.
The 9-period for CCI is already a good number.
It makes little sense to leave the stop loss risk as 0.85. Let's round it to 0.8 or 0.9. I'll set it to 0.8.
The maximum profit/loss were set in a reason of 1:2. That's actually reasonable, but if we have a risk of 1:1 or lower it's better to assure we have a winning strategy. Let's either set both to 20 or to 40. I'll set them to 40.
These are the new results:
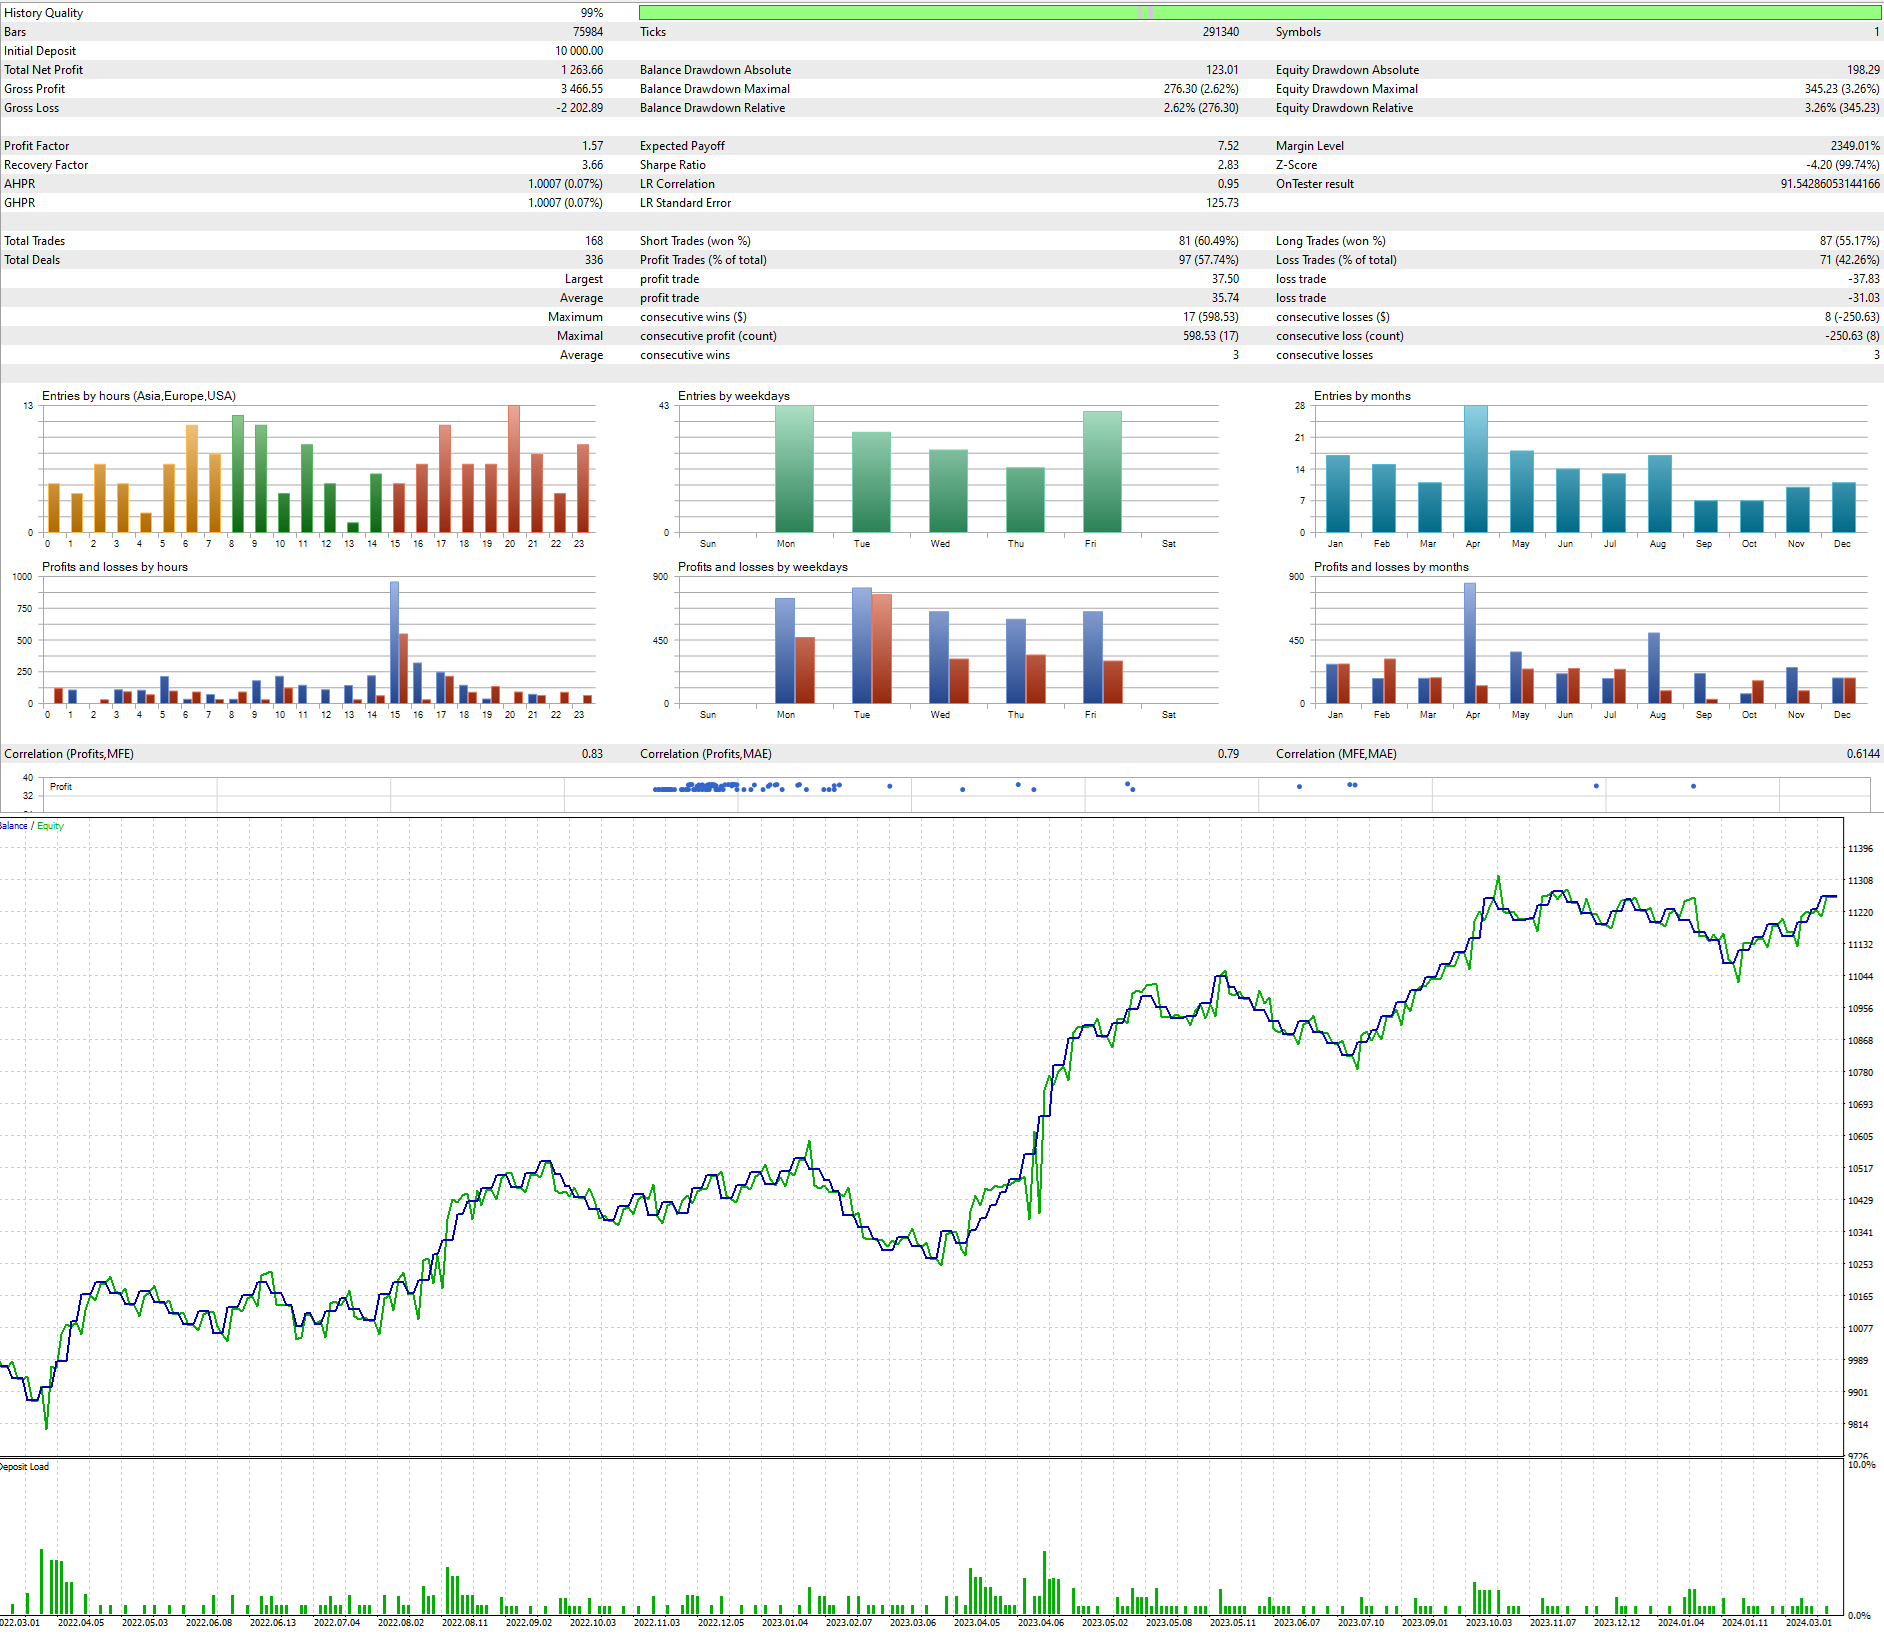
We got a better profit, but the tradeoff was that the drawdown also increased. It's fine, since it looks like we really got really good parameters and there's a good chance this strategy will work for a while. AGAIN, THIS IS NOT A RECOMENDATION. THIS STRATEGY MAY OR MAY NOT WORK IN LIVE TRADING. THIS IS JUST AN INSIGHT/IDEA ON HOW TO HAVE A CHANCE TO CREATE A GOOD STRATEGY.
Next blog post I'll take about my type of strategies and the process of thinking about a strategy.
If you have any questions, feel free to reach out to me.


