What is Zone Crack Alpha? 🎯
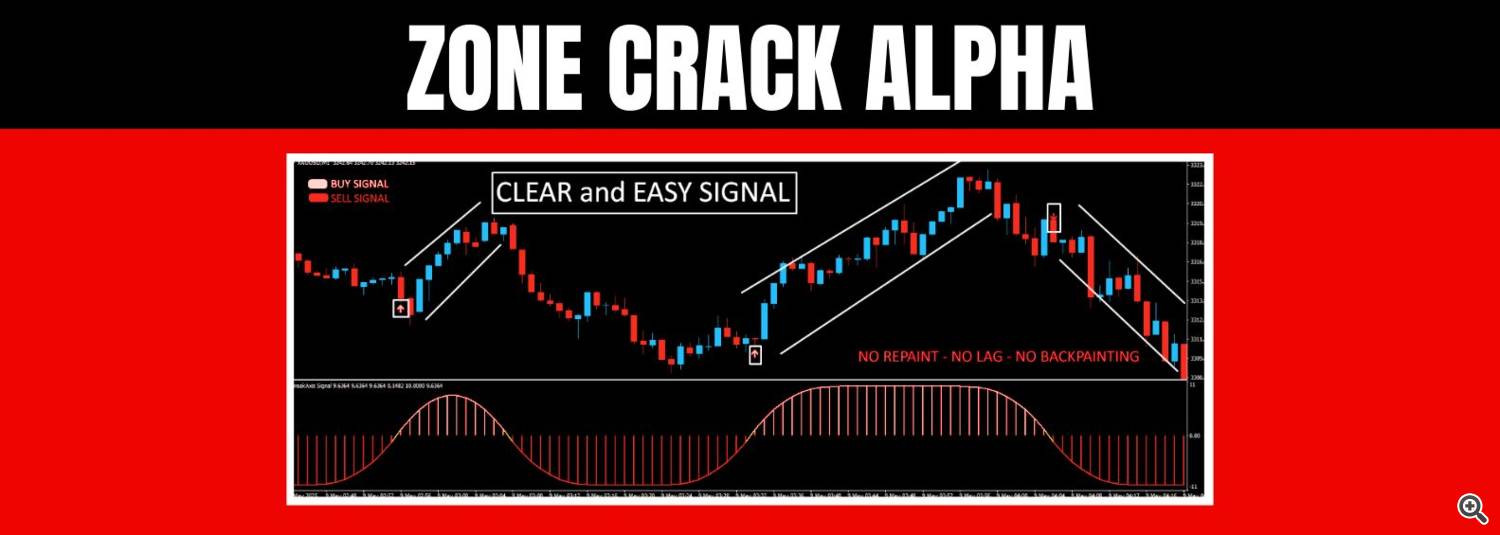
This indicator was developed to detect and mark key reversal zones with high precision. Its logic is based on an internal comparison of swing breakouts and failed continuations. When a zone gets "cracked," it highlights the likely shift in market sentiment and adds a clear visual confirmation on the chart. 💥
📊 Visual Clarity
Zones are displayed directly on the chart with easy-to-read color schemes. These areas stand out sharply, even in fast-moving markets, helping to make quicker decisions and identify ideal entry or exit levels.
Product Page: https://www.mql5.com/en/market/product/138860
⚙️ How It Works
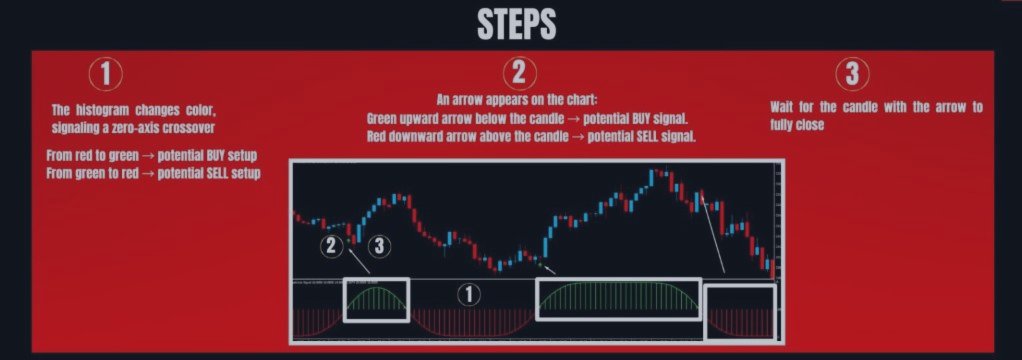
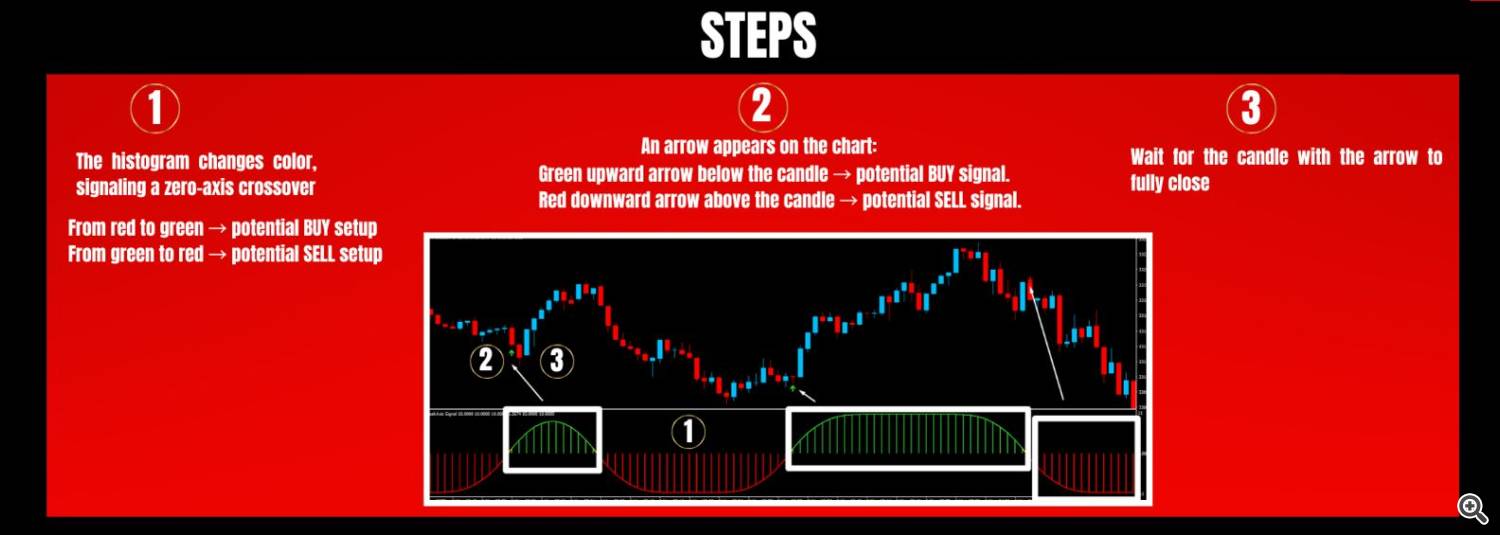
The system identifies price zones where reversals have historically occurred. If price re-enters and fails to hold the zone, a "crack" is triggered, and an alert is plotted. These zones are not repainting and remain fixed once confirmed.
🎯 Use Case
This tool is especially useful for traders who apply breakout-failure setups, reversal strategies, or structure-based entries. It’s not restricted to one style—swing traders, scalpers, and day traders can benefit equally.
🔬 Logic Behind the Signals
The core logic revolves around the behavior of price relative to swing structures. Internally, the indicator evaluates:
- Previous high/low failures — to detect invalidated continuations
- Break-and-reject scenarios — when price breaks a level and sharply pulls back
- Volume-based candle characteristics — to filter out low-interest zones
When all these conditions align, a zone is plotted and monitored for "crack" behavior, which is detected by calculating the average deviation from the initial impulse leg and a confirmation of engulfing or inside-bar breakouts. This hybrid logic helps reduce false positives and gives stronger confidence in each zone printed.
🚀Stay Updated 🚀
Join the official channel to stay informed about future releases and updates: https://www.mql5.com/en/channels/signalsandindicators
📬 Have questions? Reach me out directly if you need anything! 💬


