")
Sapphire Strat Maker - Working with indicator buffers (part. III)

1. Introduction
This is the continuation on Sapphire Strat Maker and Sapphire Strat Maker Alt (Free) expert advisor - an EA which allows you to create your own strategy without coding. This is the beauty of this Expert Advisor: create your own strategies - be creative - and don't be locked to a single strategy anymore. Optimize the parameters you want to find the best sets and you're ready to go!
Before continuing, check out the part I and part II:
Today we're gonna deal with indicators buffers. It's quite simple, so let's not lose time anymore.
2. Working with indicators buffers
Indicators may draw data to the chart it is attached to. The drawn data is assigned to a buffer in the indicator's code. This data can be retrieved and we can work with it as we want.
Take this as an example:
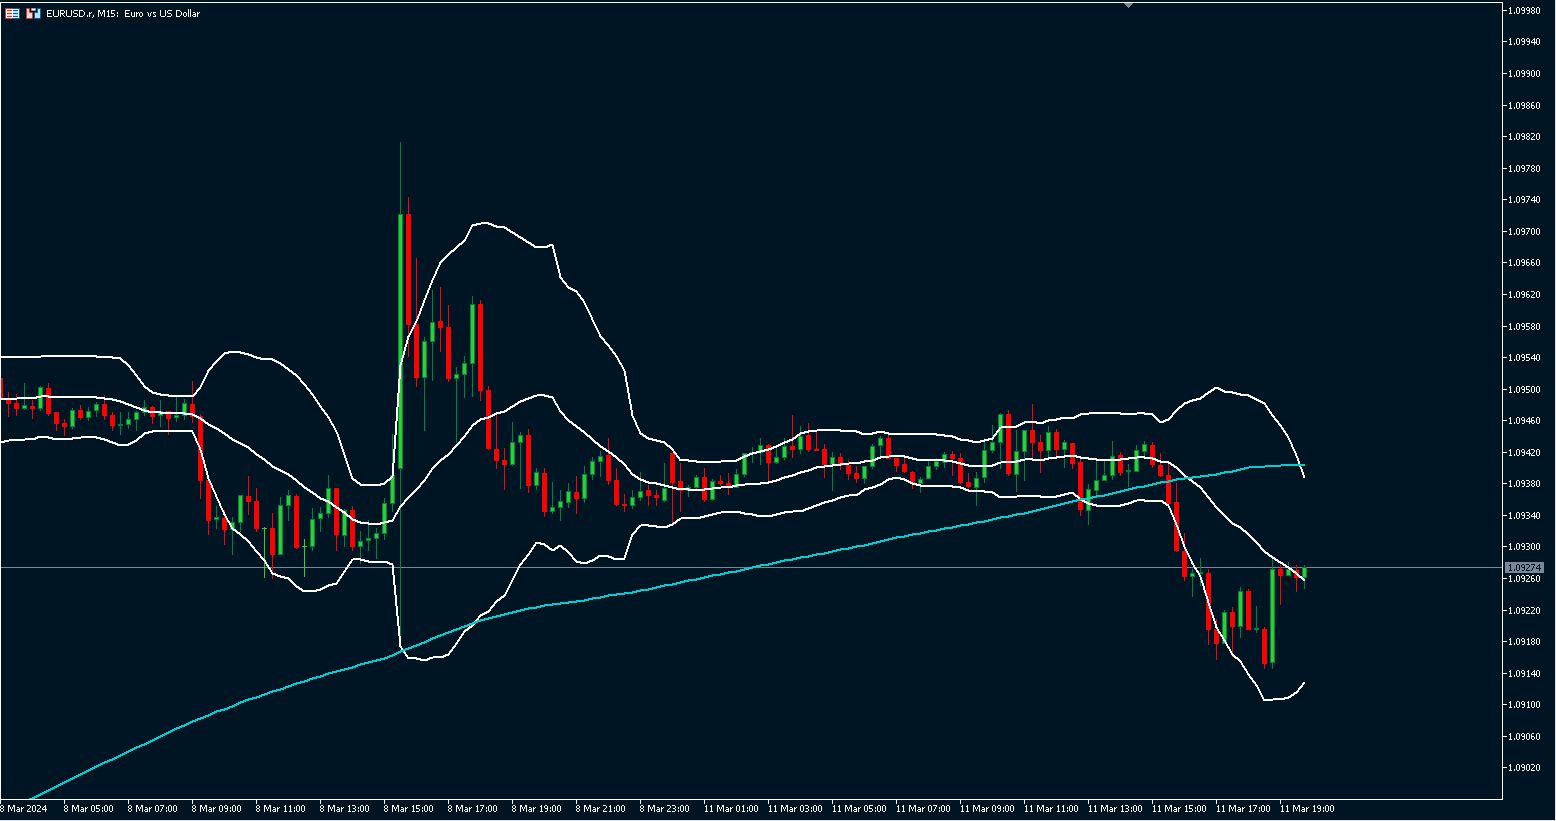
In light blue we have a simple 200-period moving average. In white, we have a 20-period default Bollinger Bands.
The moving average draws only one line on the chart. It means it only has one buffer. On the other hand, Bollinger Bands draws three lines to the chart, so it has three buffers we can work with.
Let's say I want to create a simple strategy: if the lower band is above the 200-period moving average and the close price is below the lower band, the EA must open a long position; if the upper band is below the 200-period moving average and the close price is above the upper band, the EA must open a short position. Please, take note this strategy is not optimized and is not meant to be profitable; you can optimize it yourself and/or create your own profitable strategy, according to your needs and to the instrument you're dealing with.
Back to the strategy, it can be reproduced like this ↓
In the [3] Indicators group, you define it like so:
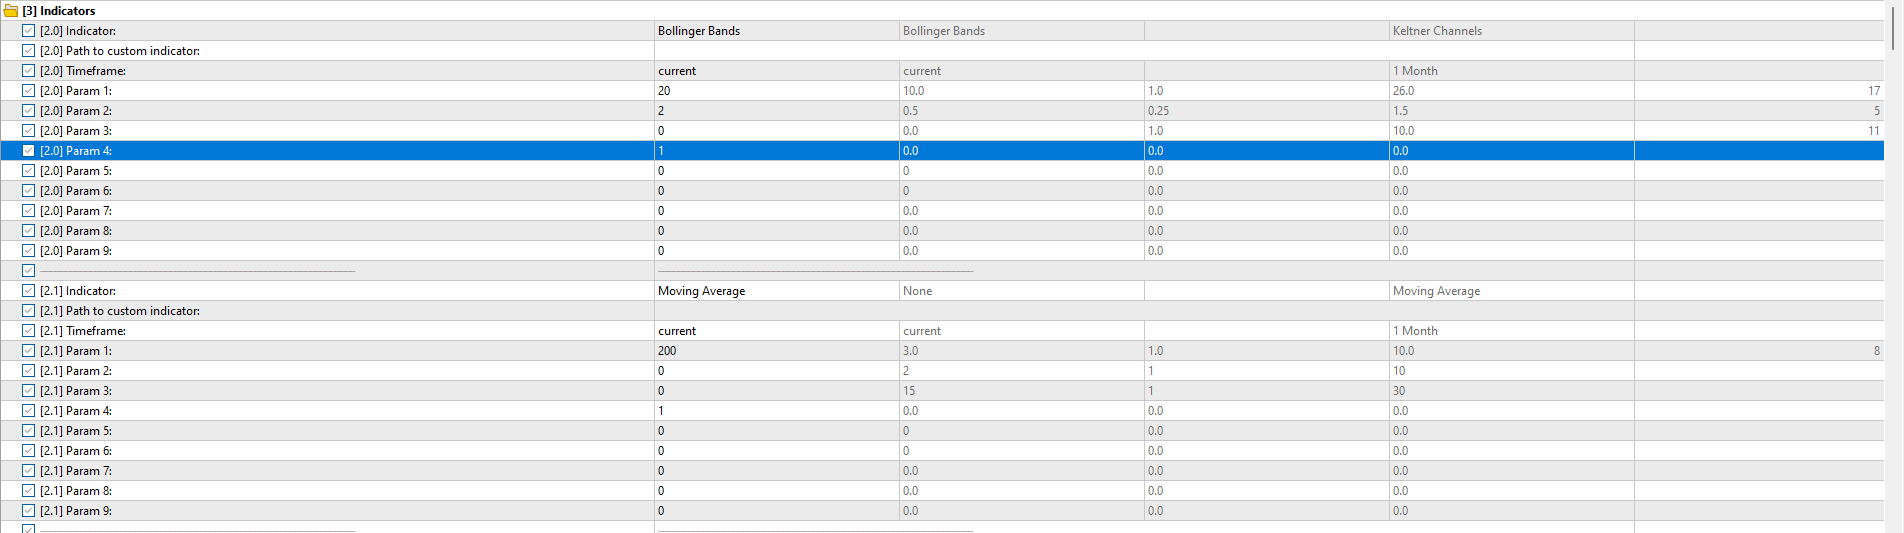
As per the documentation, the Bollinger Bands parameters are defined like this:
Param 1 - Period (integer type)
Param 2 - Deviation (double type)
Param 3 - Shift (integer type)
Param 4 - Price (ENUM_APPLIED_PRICE type, where 1 means PRICE_CLOSE).
Also, the Moving Average parameters means the following:
Param 1 - Period (integer type)
Param 2 - Shift (integer type)
Param 3 - Method (ENUM_MA_METHOD type, where 0 means MODE_SMA or Simple Moving Average)
Param 4 - Price (ENUM_APPLIED_PRICE type, where 1 means PRICE_CLOSE).
In the groups [4.1] Buy Signals and [4.2] Sell Signals, we'll define two conditions to open both buy/sell positions like this:
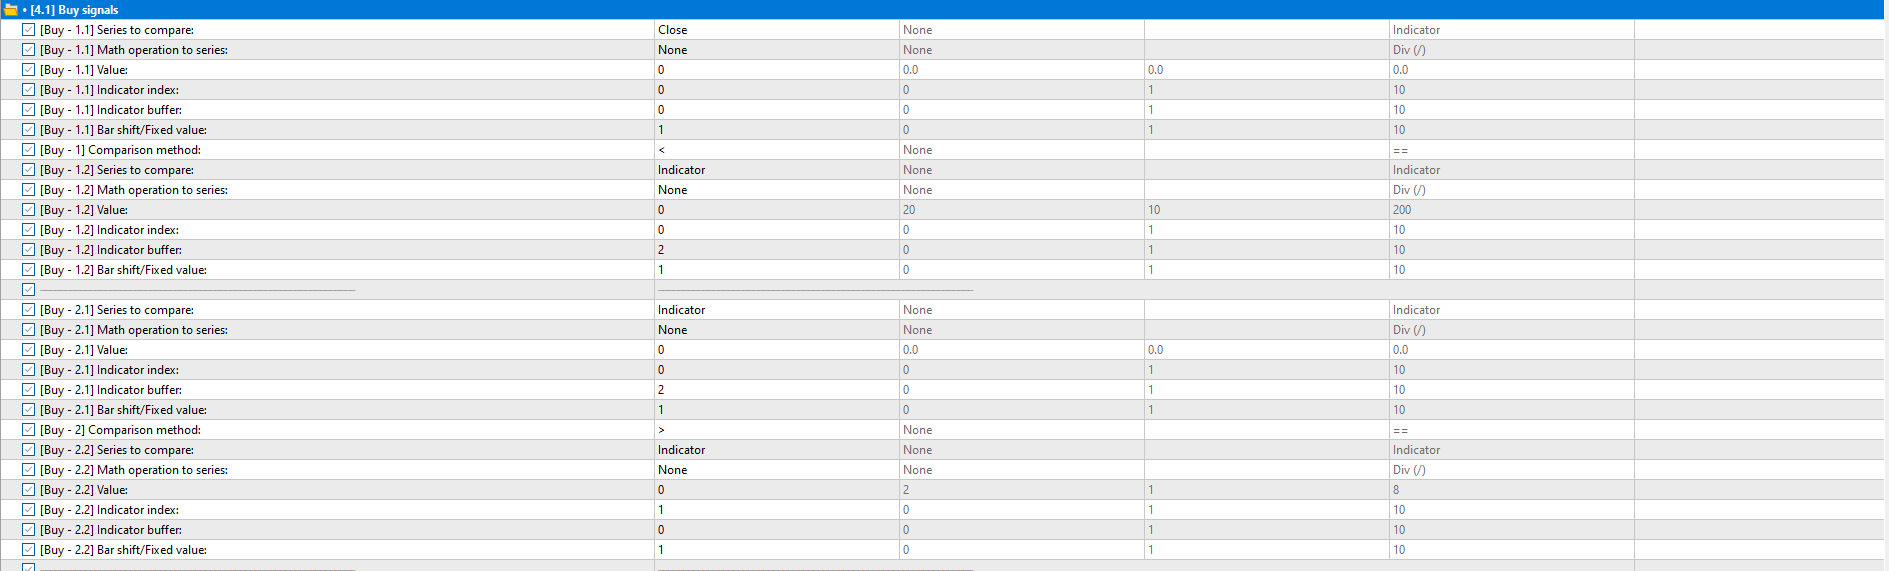
The first buy condition (Buy 1.1 and Buy 1.2) can be read like this: CLOSE[1] < BOLLINGER_BANDS[LOWER_BAND][1]. That is, if the close price on bar 1 is lower than the lower Bollinger Band on bar 1, the condition is true.
The second buy condition (Buy 2.1 and Buy 2.2) can be read like this: BOLLINGER_BANDS[LOWER_BAND][1] > MOVING_AVERAGE[1]. That is, if the lower Bollinger Band on bar 1 is bigger than the moving average on bar 1, the condition is true.
The inverse is defined to open a short position:

The first sell condition (Sell 1.1 and Sell 1.2) can be read like this: CLOSE[1] > BOLLINGER_BANDS[UPPER_BAND][1]. That is, if the close price on bar 1 is bigger than the upper Bollinger Band on bar 1, the condition is true.
The second sell condition (Sell 2.1 and Sell 2.2) can be read like this: BOLLINGER_BANDS[ UPPER_BAND ][1] < MOVING_AVERAGE[1]. That is, if the upper Bollinger Band on bar 1 is lower than the moving average on bar 1, the condition is true.
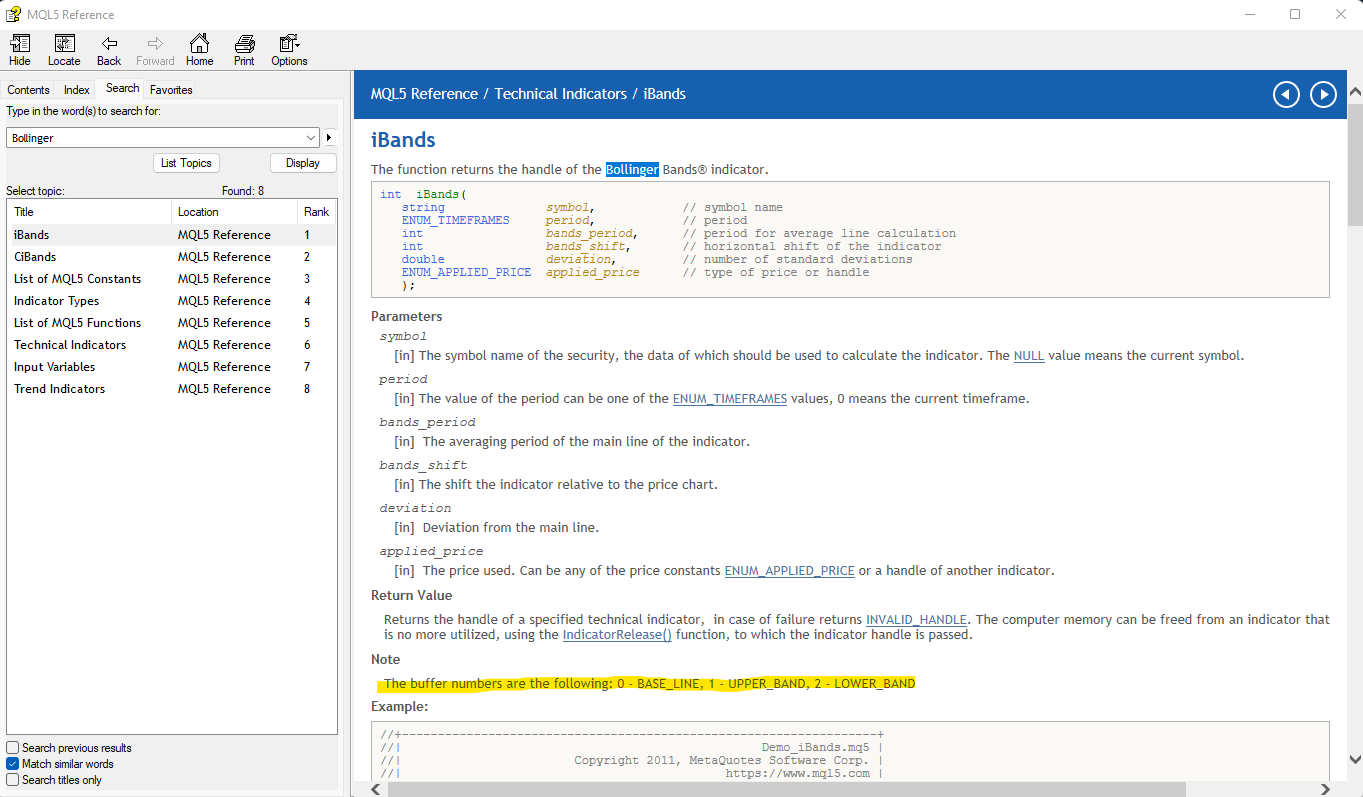
As you can see, the parameter that defines the buffer to retrieve data is named Indicator buffer. The number of the buffer may vary according to the indicator, but if it is composed of three lines, 0 usually represents the Base Line (the middle line; in the case of Bollinger Bands, the central moving average); 1 usually represents the Upper Line; and 2 represents the Lower Line. Check out the documentation I'll provide or, if the indicator is a Metatrader built-in indicator, you can check the values by opening the MQL5 documentation in the IDE (open the IDE → Press F1 → search for the indicator in the Search tab and check the values for the buffers, like in the screenshot below).
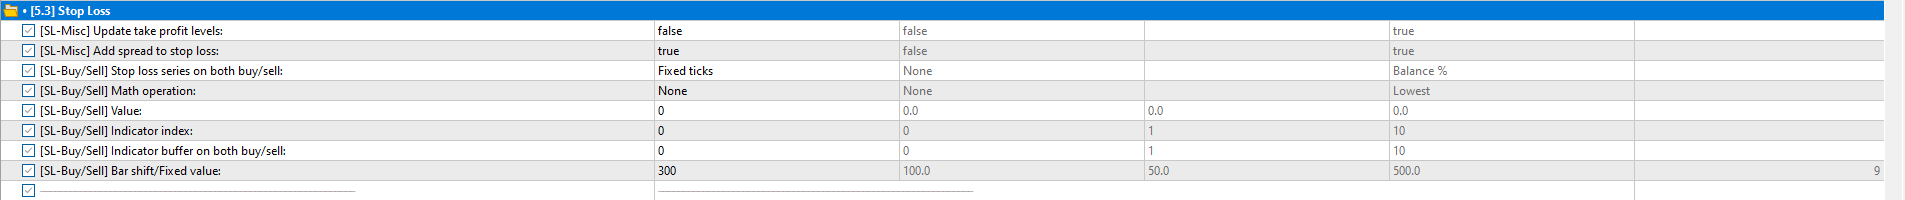
Now we just need to set targets for our strategy. I randomly chose to use TP/SL as Fixed Ticks from the open price, like shown below:

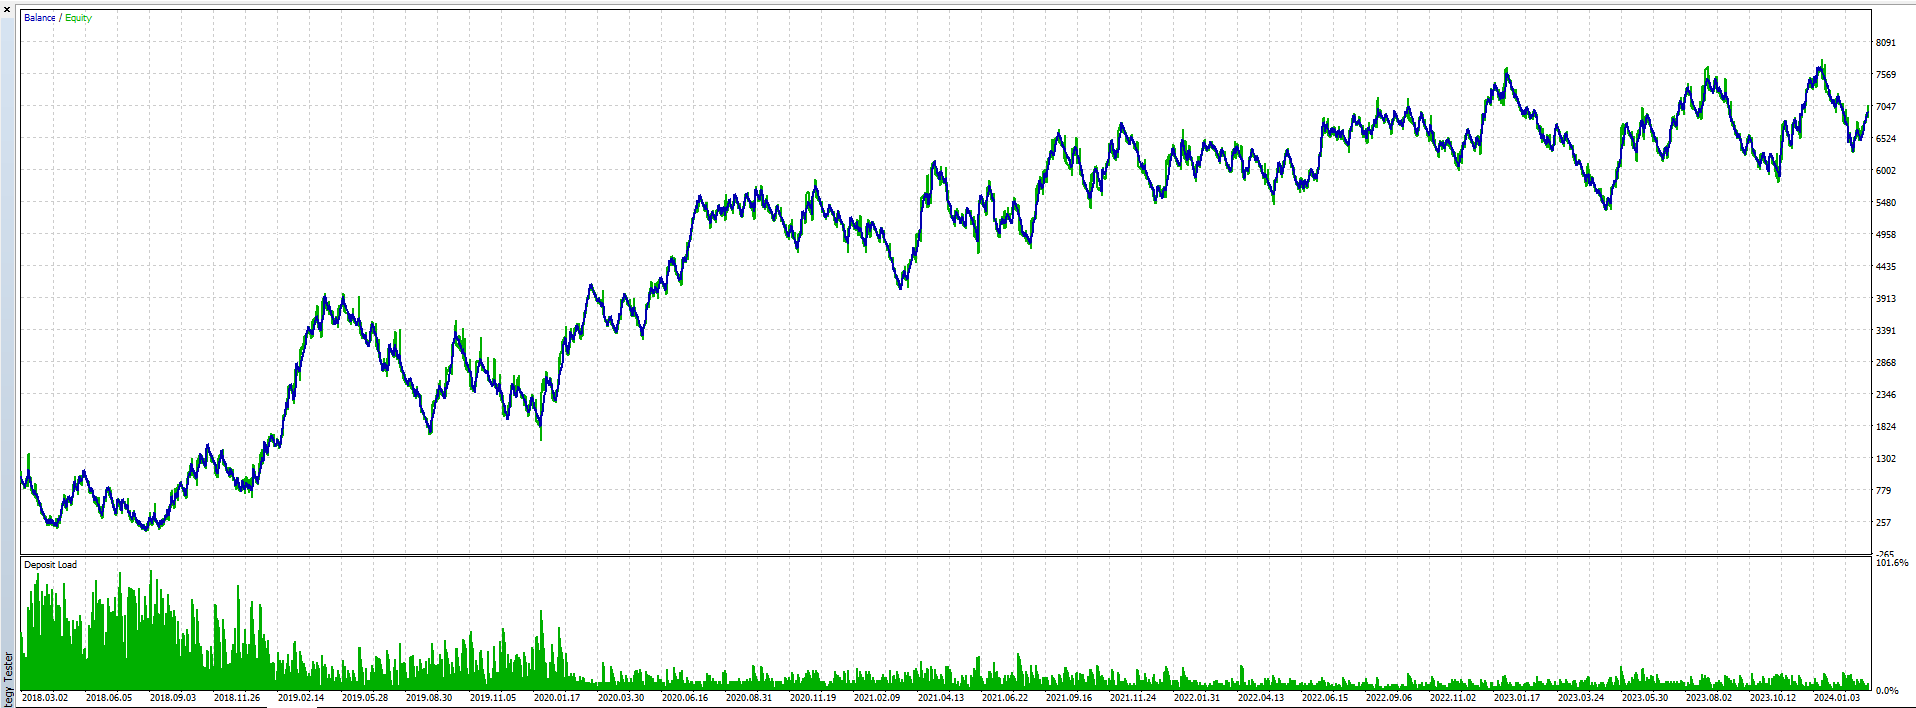
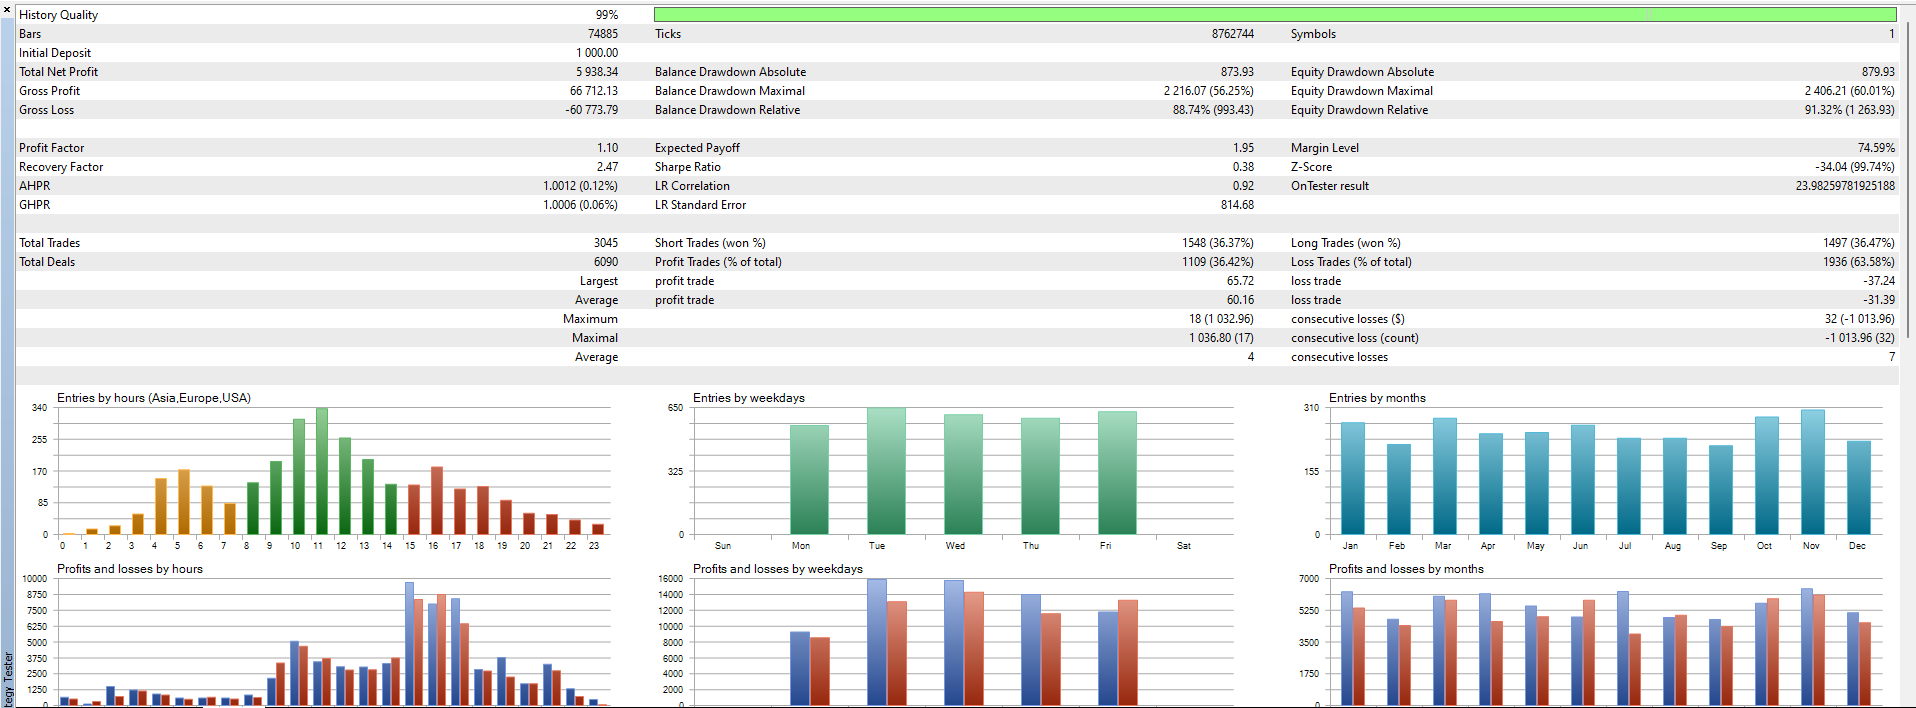
Now you're ready to go! I'll be using the M30 timeframe on EURUSD to the tests. The volume settings are the defaults (Fixed lot - 0.1).


")

![[XAUUSD]: Weekly Liquidity Activation Points (timings), June 22-26, 2026](https://c.mql5.com/6/1013/splash-preview-771790.png "[XAUUSD]: Weekly Liquidity Activation Points (timings), June 22-26, 2026")