 Technical Analysis: new daily resistance on the way to the bullish continuation")
Hang Seng Index (HSI) Technical Analysis: new daily resistance on the way to the bullish continuation
21 July 2016, 20:41

2
423
Daily price is continuing with the primary bullish trend with
new 'top' to be formed for the bullish trend to be continuing. The price
is located within the following support/resistance levels:
- 22,087 key resistance level located far above Ichimoku cloud in the primary bullish area of the chart, and
- 21,558 key support level located above Ichimoku cloud in the beginning of the secondary correction to be started.
Absolute Strength indicator is estimating the ranging bullish condition, and Chinkou Span line is located above the price for the primary bullish trend to be continuing in the future.
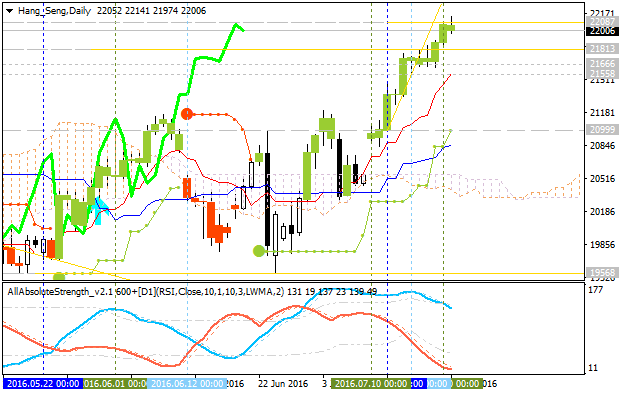
If D1 price breaks 21,558
support level on close bar so the local downtrend as the secondary
correction within the primary bullish market condition will be started.
If D1 price breaks 22,087
resistance level on close bar so the bullish trend will be continuing.
If not so the price will be on ranging within the levels.
| Resistance | Support |
|---|---|
| 22,087 | 21,558 |
| N/A | 20,999 |


")
 & AMD Framework")