
Quick Technical Overview - NIKKEI 225: ranging inside Ichimoku cloud

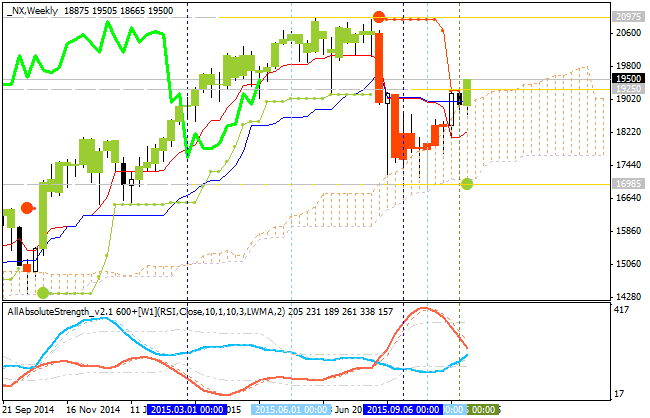
Ichimoku analysis.
Weekly price is on bullish condition for the secondary correction: the price is moved along 'reversal' Senkou Span line which is the border between the bearish and the bullish on the chart. If the price will break 20975 resistance levels from below to above so the bullish trend will be condituing; if the price will break 16985 support level so we may see the reversal of the price movement to the bearish market condition; otherwise - ranging inside Ichimoku cloud.
Pivot
Points.
The price is breaking R1 YR1 Pivot at 19117 from below to above for
the bullish trend to be continuing. If the price will break this 19117 level on close weekly bar so we may see good bullish breakout; otherwise - ranging within R1 Pivot at 19117 and Central Pivot at 16483.
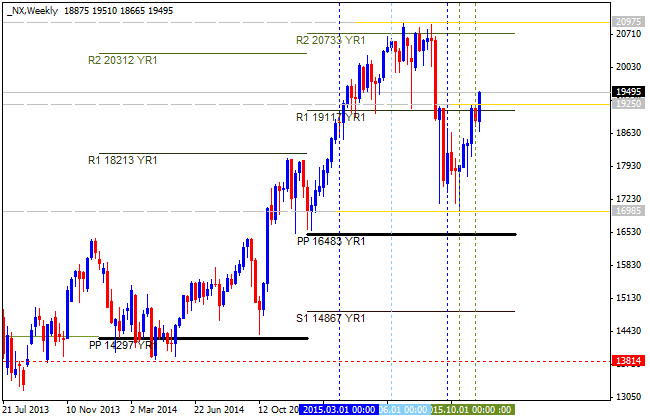
| Instrument | S1 Pivot | Yearly PP | R1 Pivot | R2 Pivot |
|---|---|---|---|---|
| NX |
14867 |
16483 |
19117 | 20733 |


")