
Quick Technical Overview - FTSE 100 Index: bear market rally to the bullish reversal

Ichimoku analysis.
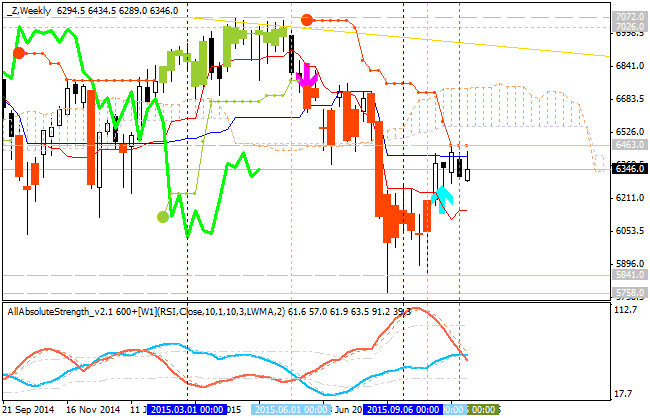
Weekly price is on bearish market condition with the secondary bear market rally to be started in the end of September this year: the price went to the local uptrend and it was stopped by 6463.0 resistance level located near Ichimoku cloud and 'reversal' Senkou Span line which is the border between the primary bearish and the primary bullish on the chart. Chinkou Span line is located below the price indicating the ranging bearish condition by direction. Absolute Strength indicator is
estimating the secondary rally to be continuing. if the price breaks 6463.0 resistance so the price will be started to be reversed to the bullish condition, otherwise - bearish ranging within the levels.
Pivot
Points.
The price is ranging between Central Pivot at 6474 and S1 Pivot at 6045. Strong buy signal was estimated on weekly price for possible breaking Central Pivot at 6474 from below to above for the possible reversal of the price movement to the primary bullish market condition.

| Instrument | S1 Pivot | Yearly PP | R1 Pivot |
|---|---|---|---|
| FTSE 100 |
6045 |
6474 |
6090 |


![[Two Different Approaches to Market Timing]: The Spiral Calendar and the VISTmany Research Project](https://c.mql5.com/6/1012/splash-preview-771691.png "[Two Different Approaches to Market Timing]: The Spiral Calendar and the VISTmany Research Project")
