
EURUSD Technical Analysis 2015, 18.10 - 25.10: ranging bullish
19 October 2015, 08:11

1
1 569
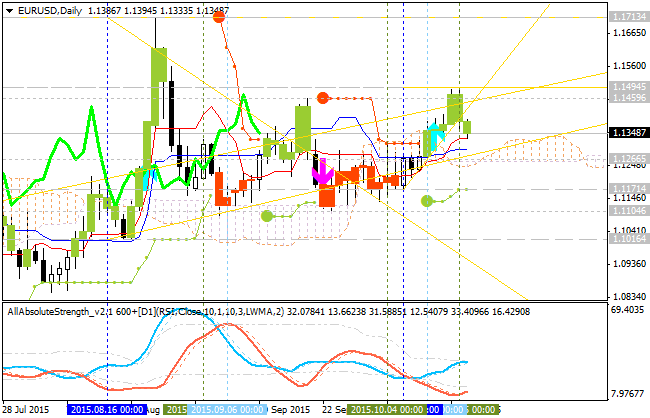
Daily price is on bullish condition located to be above Ichimoku cloud within the following key support/resistance levels:
- 1.1713 key resistance level located far above Ichimoku cloud in the primary bullish area of the chart;
- 1.1016 key support level located far below Ichimoku cloud in the primary bearish area of the chart.
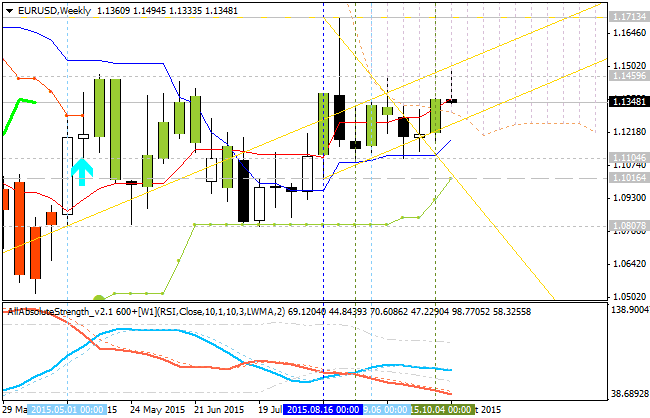
Intermediate
s/r levels for this pair on the way to the key s/r are the following:
- 1.1459 resistance located above Ichimoku cloud in the primary bullish area of the daily chart, and
- 1.1171 bearish support level.
D1 price - ranging:
- Tenkan-sen line is crossed Kijun-sen line from below to above for the bullish condition.
- Absolute Strength indicator's data is estimating the secondary ranging.
- Chinkou Span line is indicating the ranging by direction.
- 'Reversal' Sinkou Span line (as the border between the primary bullish and the primary bearish on the chart) is located below the price.
- Nearest support levels are 1.1171 and 1.1016.
- Nearest resistance levels are 1.1459 and 1.1713.
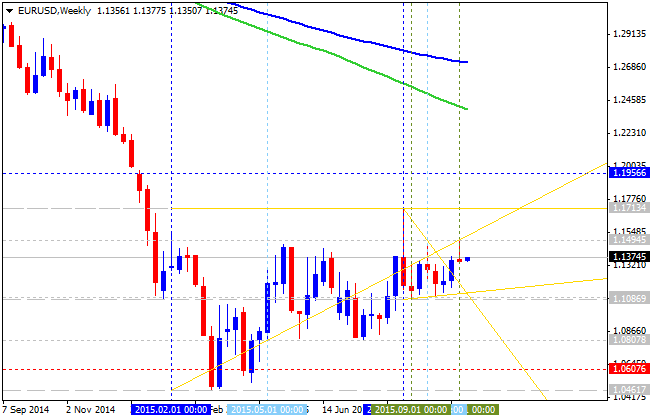
If D1 price will break 1.1016
support level on close D1 bar so we may see the bearish breakdown.
If D1 price will break 1.1713 resistance level on close D1 bar so the bullish trend will be continuing.
If not so the price will be on ranging within the levels.
- Recommendation for long: watch close D1 price to break 1.1713 for possible buy trade
- Recommendation
to go short: watch D1 price to break 1.1016 support level for possible sell trade
- Trading Summary: ranging
| Resistance | Support |
|---|---|
| 1.1459 | 1.1171 |
| 1.1713 | 1.1016 |
SUMMARY : bullish


 Trading Guide")
