
NZD/USD Price Action Analysis - weekly ranging bearish, monthly bearish breakdown
1 October 2015, 18:11

0
1 671
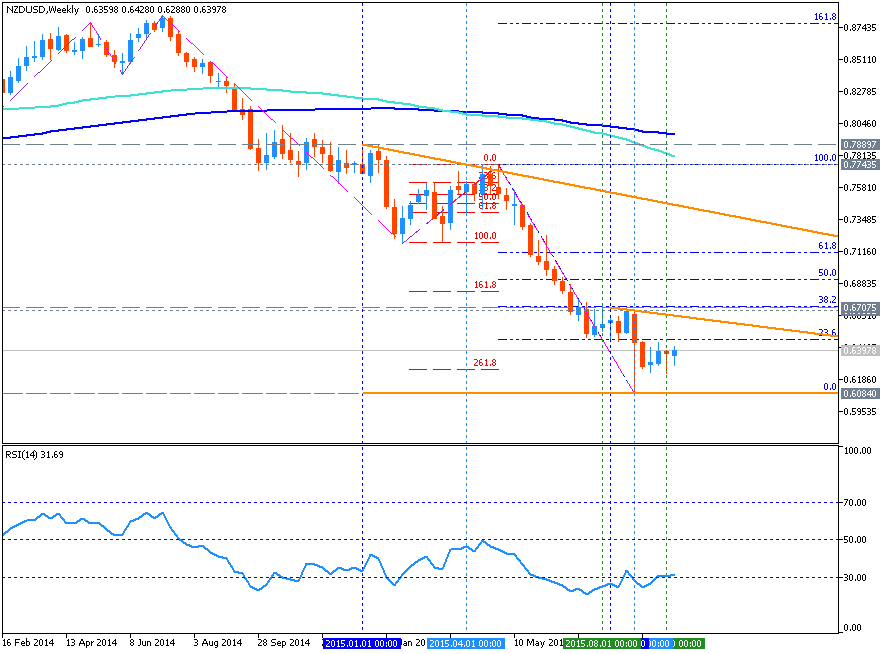
W1 price is located below 200 period SMA (200 SMA) and below 100 period SMA (100 SMA) for the primary bearish market condition with the secondary ranging between Fibo support level at 0.6084 and 38.2 Fibo resistance level at 0.6715:
- 100 SMA crossed with 200 SMA from above to below for the bearish trend to be continuing;
- RSI indicator is estimating the ranging bearish market condition;
- descending triangle pattern was formed by the price to be crossed to below for possible good breakdown possibility.
Trend:
- D1 - ranging bearish
- W1 - ranging bearish
- MN1 - bearish breakdown


