
Quick Technical Overview - S&P 500: floating between bearish and bullish for direction
21 September 2015, 18:11

0
1 232
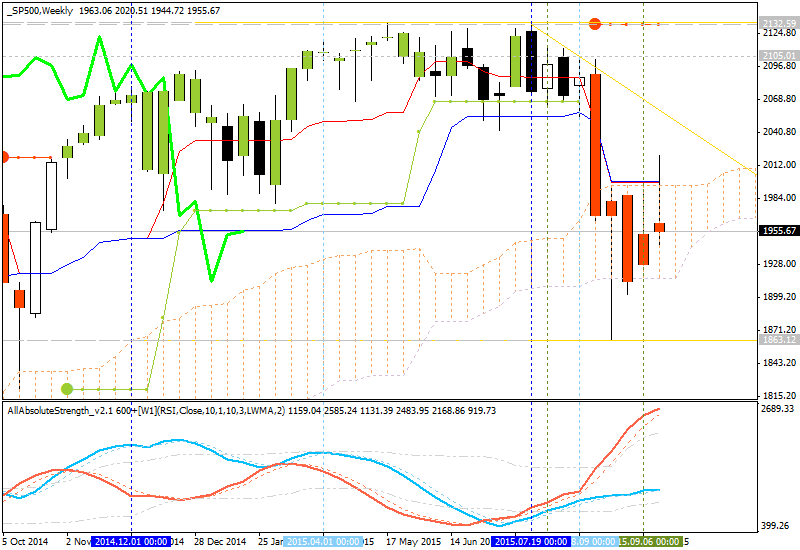
Ichimoku analysis.
Weekly price is on ranging market condition floating to be inside Ichimoku cloud on the border between the primary bullish and the primary bearish trend on the chart. The key reversal s/r levels for the price to choose the direction are the following: 2132.59 key bullish resistance level and 1863.12 key bearish support level. I think the price will be floating within those leevls for ranging untill one of the level will be broken and the direction of the trend will be well-chosen one.
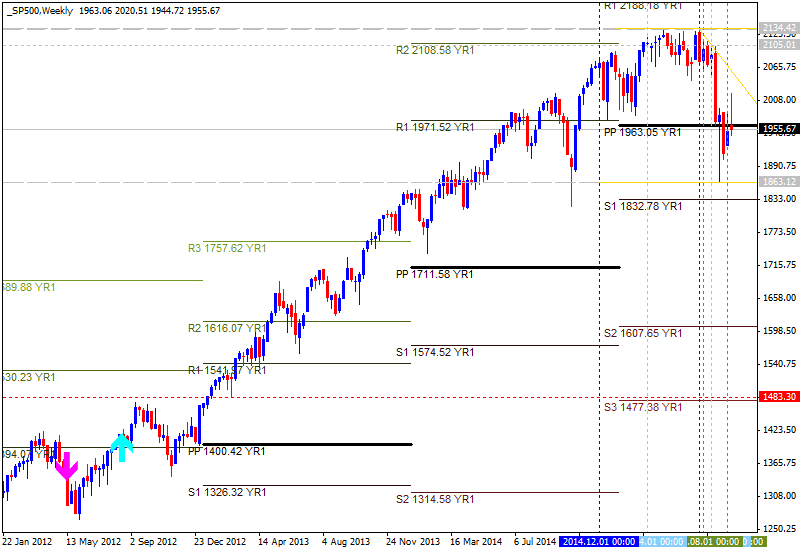
Pivot
Points.
The price is moved to be around
Central YR1 Pivot at 1963.05 between the bullish/bearish area on the chart:
- descending triangle pattern was formed by the price at 1863.12 support on the way to S1 YR1 Pivot bearish target at 1832.78;
- the intermediate resistance at 2134.42 is located above Central Pivot on the way to R1 YR1 Pivot bullish target at 2188.18.
| Instrument | S1 Pivot | Yearly PP | R1 Pivot |
|---|---|---|---|
| S&P 500 |
1832.78 |
1963.05 |
2188.18 |


")
")