

1
1 195
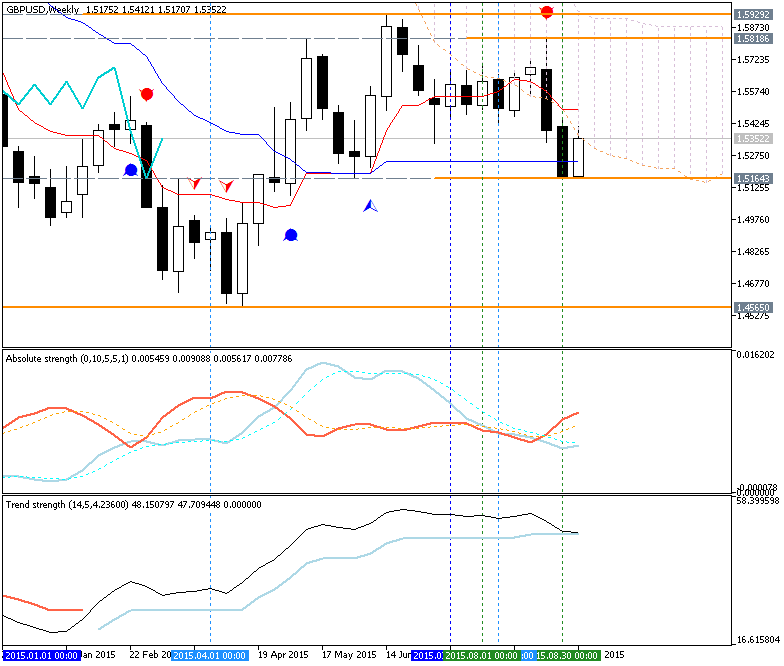
GBP/USD price is ranging within the following s/r levels:
- 1.5929 resistance located above Ichimoku cloud in the bullish area of weekly chart;
- 1.5164 support located below Ichimoku cloud in the bearish area of the chart.
As we see from the forecast made by Bank of Tokyo-Mitsubishi UFJ for this pair - the price will be inside Ichimoku cloud for the next half a year, and it means the totally ranging market condition: the price will be on inside Ichimnoku cloud on the border between the primary bearish and the primary bullish market condition.
So, no trend for GBP/USD till June 2016.
| Pairs | Q3 Sep'15 | Q4 Dec'15 | Q1 Mar'16 | Q2 Jun'16 |
|---|---|---|---|---|
| GBP/USD | 1.556 | 1.536 | 1.534 | 1.538 |


")

![[XAUUSD]: Weekly Liquidity Activation Points (timings), June 22-26, 2026](https://c.mql5.com/6/1013/splash-preview-771790.png "[XAUUSD]: Weekly Liquidity Activation Points (timings), June 22-26, 2026")