
GBPUSD Intra-Day Technical Analysis - Bearish Breakdown or Bullish?

H4 price
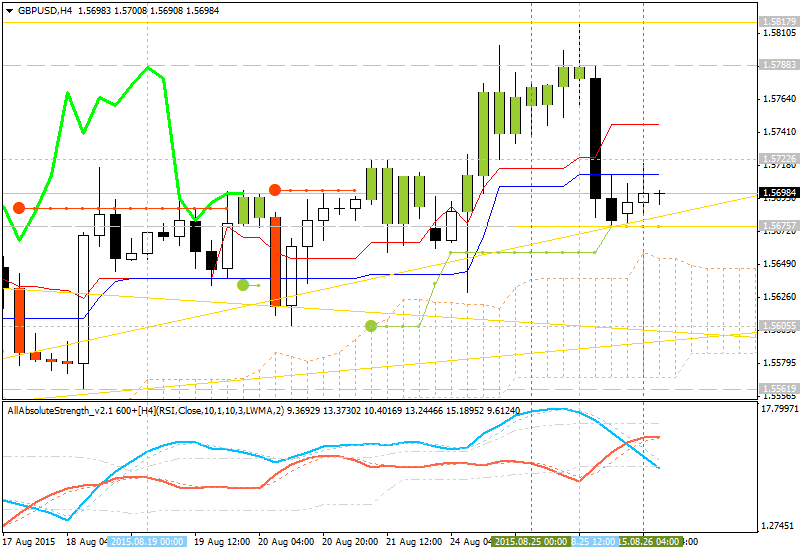
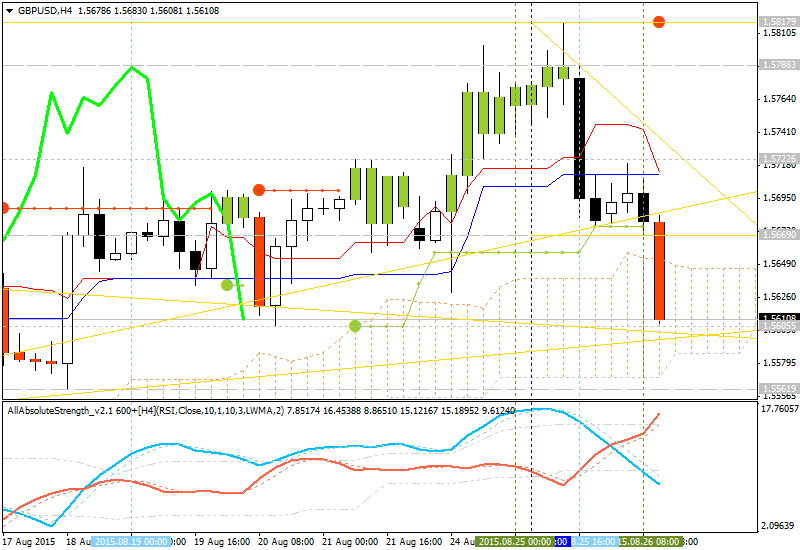
is on bullish market condition with the secondary correction to be started: the price was stopped by 1.5675 support level located near Senkou Span line which is the virtual border between the primary bullish and the
primary
bearish on the chart. If the price crosses this 1.5675 support level so the reversal to the bearish condition may be started with the secondary ranging and 1.5561 support as the next bearish target located below Ichimoku cloud in the primary bearish area of the chart. Key resistance level for intra-day trading is 1.5817, and this level is located on the bullish area of the chart.
- Chinkou Span line is located above and near the price to be ready to break it from above to below for bearish breakdown.
- Absolute Strength indicator is estimating the bearish condition by data.
- The nearest key support levels are 1.5675 and 1.5561.
- The key resistance level is 1.5817.
| Resistance | Support |
|---|---|
| 1.5817 | 1.5675 |
| N/A | 1.5561 |
If
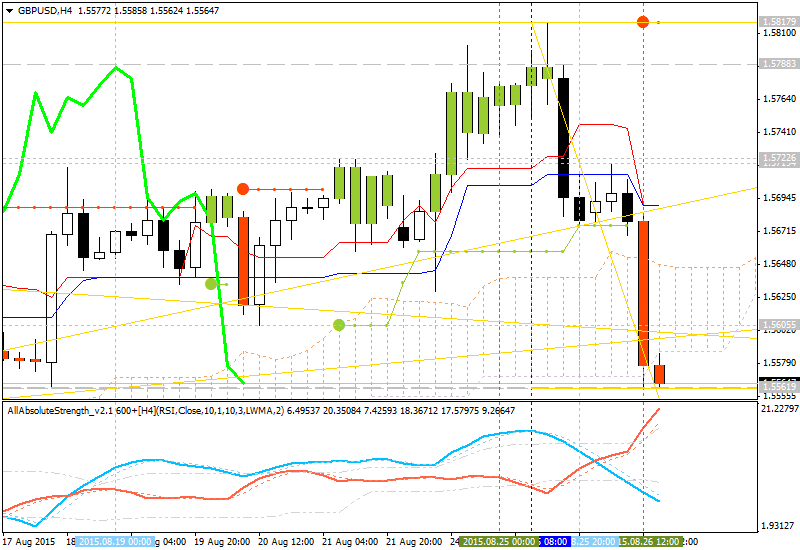
H4 price will break 1.5561 support level on close H4 bar so the price will be reversed to the primary bearish market condition.
If H4 price will break 1.5817 resistance level so the bullish market condition will be continuing with good breakout possibility.
If not so we may see the ranging market condition within the levels.
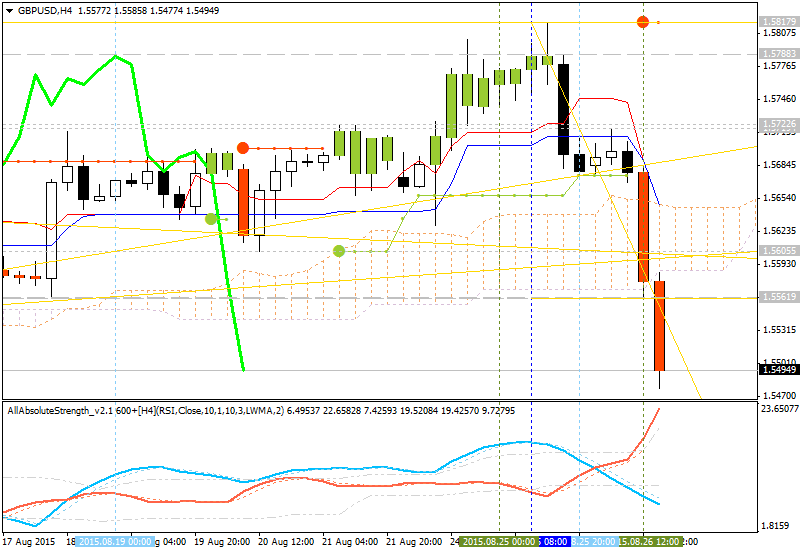
- Recommendation for long: watch close H4 price to break 1.5817 for possible buy trade
- Recommendation
to go short: watch H4 price to break 1.5561 support level for possible sell trade
- Trading Summary: ranging
SUMMARY : ranging


")
![[XAUUSD]: Weekly Liquidity Activation Points (timings), June 22-26, 2026](https://c.mql5.com/6/1013/splash-preview-771790.png "[XAUUSD]: Weekly Liquidity Activation Points (timings), June 22-26, 2026")
")