
USDCHF Next Week Outlook - too closely between near-term support and resistance levels
8 August 2015, 21:11

1
1 264
W1 price is located above 200 period SMA (200-SMA) and above 100 period SMA (100-SMA) for the primary bullish with ranging between resistance level at 1.0239 and 23.6% Fibo support level at 0.9308:
- ascending triangle pattern with 0.9718 support was broken by the price from below to above for the bullish trend to be continuing;
- 23.6% Fibo support level at 0.9308 is located near 100-SMA and 200-SMA which makes this level to be a reversal one between the primary bearish and the primary bullish on W1 chart;
- the nearest resistance levels are Fibo resistance level at 0.9870 and resistance level at 1.0239;
- “The US Dollar continues to grind upward against the Swiss Franc, with prices narrowly establishing a foothold above the 0.98 figure”;
- “Prices are wedged too closely between near-term support and resistance levels to justify taking a trade on a long or short side from a risk/reward perspective. With that in mind, we will continue to stand aside until a more attractive opportunity presents itself”;
- RSI indicator is estimating the uptrend to be continuing.
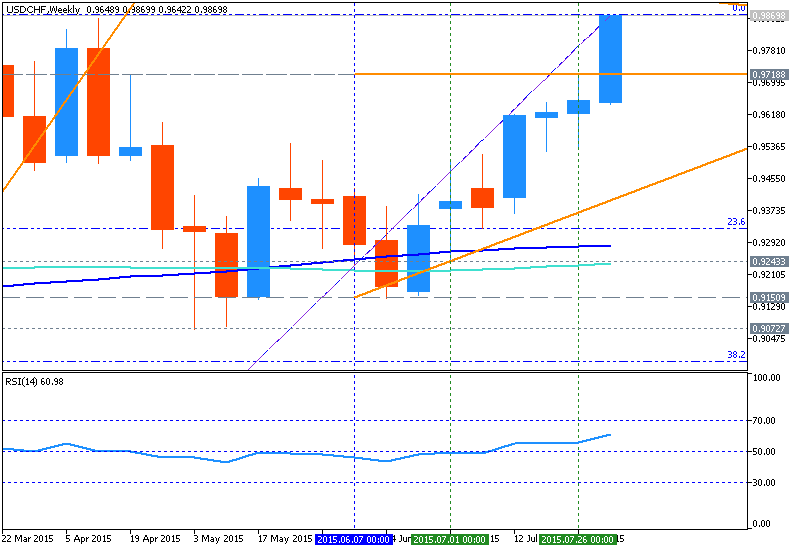
If the price will break Fibo resistance level at 0.9870 on close weekly bar so the bullish trend will be continuing with the secondary ranging up to 1.0239 as the next target in our case.
If the price will break resistance level at 1.0239
from below to above so the bullish breakout may be started.
If not so the price will be ranging between between the levels.
Trend:


")

![[XAUUSD]: Weekly Liquidity Activation Points (timings), June 22-26, 2026](https://c.mql5.com/6/1013/splash-preview-771790.png "[XAUUSD]: Weekly Liquidity Activation Points (timings), June 22-26, 2026")