
USDCAD Price Action Analysis - 61.8% Fibo resistance level with Triangle pattern for breakout
6 July 2015, 10:11

1
873
W1 price is located above 200 period SMA and 100 period SMA for the primary bullish with secondary ranging between 23.6% Fibo support level at 1.2126 and Fibo resistance level at 1.2834:
- 61.8% Fibo resistance level at 1.2485 is going to be crossed by the price from below to above for the bullish trend to be continuing;
- the price is ranging between 23.6% Fibo support level at 1.2126 and Fibo resistance level at 1.2834;
- triangle pattern was formed and it is going to be crossed by the price from below to above for the bullish market condition to be continuing with good breakout possibility.
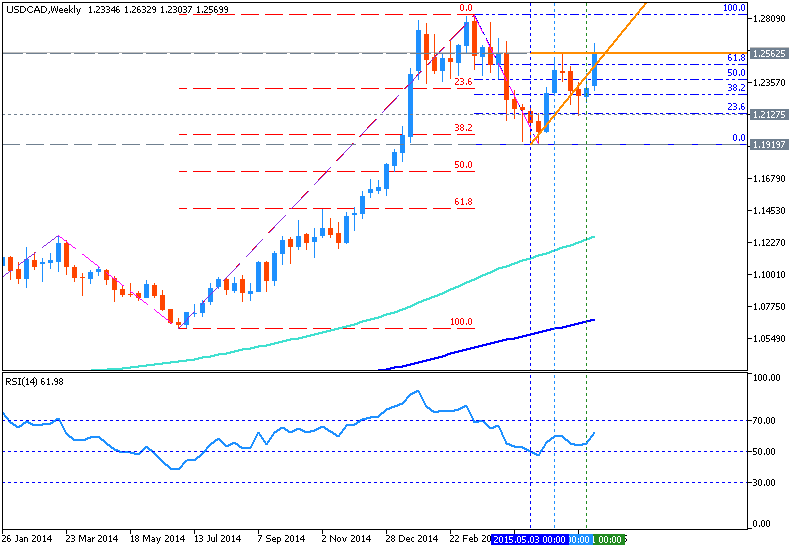
If the price will break 23.6% Fibo support level at 1.2126 so the secondary correction will be started within the primary bullish condition.
If the price will break 61.8% Fibo resistance level at 1.2485 from below to above so the primary bullish trend will be continuing with good possible breakout of the price movement.
If not so the price will be ranging between between support level at 1.2126 and resistance level at 1.2485.
Trend:


