

MTF SCAN & Dashboard User Guide
Table of Contents
- Introduction
- Installation & Adding to Chart
- Input Guide — MTF Scanner
- Input Guide — MTF Scanner Dashboard
- Input Guide — MTF Alerts & Notify
- Input Guide — MTF Timeframes
- How to Use MTF Scan
- How to Use the MTF Dashboard
- Signal Dashboard (Trade Statistics Panel)
- FAQ & Common Issues
1. Introduction
MTF SCAN (Multi-TimeFrame Scanner) is a built-in feature that scans signals across multiple timeframes and multiple symbols simultaneously. Instead of opening separate charts for each symbol and timeframe, MTF Scan automatically scans all symbols in your Market Watch across 8 timeframes (M1 to W1) and displays the results on a Dashboard grid right on your chart.
What you get:
- Scan up to 150+ symbols × 8 timeframes at once
- Grid Dashboard showing BUY/SELL signals per cell (symbol × timeframe)
- Click any signal cell to jump to that chart (symbol + timeframe)
- Alerts when new signals appear, Entry hit, TP hit, SL hit
- Full chart display: Entry, SL, TP1-4 lines, BUY/SELL arrows, price tracking path
2. Installation & Adding to Chart
Step 1: Attach the indicator to a chart
- Open MetaTrader 5
- Open any chart (e.g., XAUUSD, H1)
- Go to Insert → Indicators → Custom → select the indicator name (e.g., MirageTradingSystem )
- Or drag and drop from the Navigator window (Ctrl+N) onto the chart
Step 2: Open the Inputs window
When you attach the indicator, the settings window opens automatically. You will see input groups organized by section:
- === MTF SCANNER === — Enable/disable and configure multi-symbol scanning
- === MTF SCANNER DASHBOARD === — Dashboard position and size
- === MTF SCANNER ALERTS === — Alert settings
- === MTF SCANNER NOTIFY TYPES === — Notification types
- === MTF TIMEFRAMES === — Select timeframes to scan
Tip: If the indicator is already on the chart, right-click the chart → Indicators List → select the indicator → Properties to reopen the Inputs window.
Step 3: Enable Allow DLL imports (if needed)
Go to the Common tab → check ✅ Allow DLL imports (some notification features require this permission).
Step 4: Click OK
The indicator will start scanning. The first time may take 5-15 seconds to load historical data for all symbols.
3. Input Guide — MTF Scanner
Group === MTF SCANNER === in the Inputs window:
| Name in MT5 | Type | Default | Description | Recommendation |
|---|---|---|---|---|
| Enable Multi-Symbol Scanner (150+ pairs) | true/false | true | Master switch to enable/disable multi-symbol scanning. Set to false if you only want to use the indicator on the current chart. | Disable on slow machines or when trading only one symbol. |
| Only Scan Current Symbol (all TFs) | true/false | false | When enabled, only scans the symbol currently open on the chart but across all selected timeframes. Does not scan other symbols. | Enable when you only care about one symbol but want signals across multiple TFs (e.g., XAUUSD on M15, H1, H4, D1). |
| Use MarketWatch Symbols | true/false | true | Scans all symbols currently visible in the Market Watch window. Add symbols to Market Watch to include them. Remove symbols to exclude them. | Always keep enabled. Manage the scan list by adding/removing symbols in Market Watch. |
| History Depth per Symbol (bars, 30=default) | Integer | 30 | Number of recent bars checked on each periodic scan cycle. Higher values look further back but use more resources. | 30 suits most users. Increase to 50-100 to catch older signals. Decrease to 10-20 on slow machines. |
| Batch Size (symbols/scan, 50=default) | Integer | 50 | Number of symbols scanned per cycle (every few seconds). If Market Watch has 150 symbols and Batch Size is 50, scanning completes in 3 rounds. | 50 suits most users. Decrease to 20-30 on slow machines. Increase to 100 on powerful machines. |
| Look Back Bars (history, 50=default) | Integer | 50 / 200 | Number of historical bars scanned on initial startup or when switching timeframes. After the first scan, only new bars are checked (much faster). Default is 50 (Mirage) or 200 (PinBar, InvertedHammer). | 50-200 depending on your needs. Higher = finds older signals but slower startup. |
| EA Signal Slots (50-500 capacity) | Integer | 500 | Maximum signal storage slots for EA (Expert Advisor) to read via buffer. Only relevant if you use an EA to read signals from the indicator. | Keep at 500. Regular users do not need to change this. |
4. Input Guide — MTF Scanner Dashboard
Group === MTF SCANNER DASHBOARD === in the Inputs window:
| Name in MT5 | Type | Default | Description | Recommendation |
|---|---|---|---|---|
| Show Scanner Results Panel | true/false | true | Show/hide the Dashboard grid displaying MTF scan results on the chart. | Disable if you only want alerts without the visual panel. |
| Panel X Position (pixels) | Integer | 380 | Horizontal position (pixels) of the Dashboard from the left edge of the chart. | Adjust if the Dashboard covers important chart areas. You can also drag and drop it directly on the chart. |
| Panel Y Position (pixels) | Integer | 100 | Vertical position (pixels) of the Dashboard from the top edge of the chart. | Same as above — drag and drop directly for convenience. |
| Font Size (8-24 pixels) | Integer | 20 | Font size for text in Dashboard cells. | 20 is comfortable on Full HD. Decrease to 14-16 if it takes too much space. Increase to 22-24 for 2K/4K screens. |
| Row Height (24-50 pixels) | Integer | 36 | Height of each row in the Dashboard. | 36 suits most users. Decrease to 24-28 to show more symbols in the same area. |
5. Input Guide — MTF Alerts & Notify
Group === MTF SCANNER ALERTS ===
| Name in MT5 | Type | Default | Description | Recommendation |
|---|---|---|---|---|
| Enable Scanner Alerts (master switch) | true/false | true | Master switch to enable/disable all alerts from MTF Scanner. When off, no alerts are sent regardless of the notify settings below. | Disable when you don't want to be interrupted. |
| Alert Cooldown (seconds between alerts) | Integer | 30 | Minimum wait time (seconds) between two alerts for the same symbol + timeframe. Prevents alert spam. | 30 seconds suits most users. Increase to 60-120 if overwhelmed by alerts. |
Group === MTF SCANNER NOTIFY TYPES ===
Each event type below can be enabled/disabled independently:
| Name in MT5 | Default | Description | When to enable |
|---|---|---|---|
| Notify: New Pattern Detected | false | Alert when a new pattern is detected on any symbol/TF. This is the earliest signal, before price reaches Entry. | When you want the earliest heads-up on potential setups. May generate many alerts. |
| Notify: Entry Price Hit | true | Alert when price reaches the Entry level of a signal. This is when a trade would be triggered. | Always keep enabled — this is the most important alert for actual trading. |
| Notify: Take Profit Hit | false | Alert when price reaches a Take Profit level (TP1, TP2, TP3, or TP4). | When you want to track results without watching the chart constantly. |
| Notify: Stop Loss Hit | false | Alert when price reaches the Stop Loss level (SL). | When you want immediate notification of a stopped-out trade. |
| Notify: Trailing Stop Hit | false | Alert when the Trailing Stop triggers. Trailing Stop automatically moves SL in your favor as price moves in the right direction. | When using Trailing Stop and you want to know when it activates. |
6. Input Guide — MTF Timeframes
Group === MTF TIMEFRAMES === lets you choose which timeframes to scan:
| Name in MT5 | Default | Description |
|---|---|---|
| Scan M1 (1-minute) timeframe | true | Scan the 1-minute chart |
| Scan M5 (5-minute) timeframe | true | Scan the 5-minute chart |
| Scan M15 (15-minute) timeframe | true | Scan the 15-minute chart |
| Scan M30 (30-minute) timeframe | true | Scan the 30-minute chart |
| Scan H1 (1-hour) timeframe | true | Scan the 1-hour chart |
| Scan H4 (4-hour) timeframe | true | Scan the 4-hour chart |
| Scan D1 (daily) timeframe | true | Scan the daily chart |
| Scan W1 (weekly) timeframe | false | Scan the weekly chart (disabled by default) |
Important notes:
- W1 is disabled by default because weekly signals are rare and scanning them is resource-intensive.
- Disable smaller TFs (M1, M5) if you trade swing/position (H1+) to significantly reduce load.
- Disable larger TFs (D1, W1) if you scalp (M1-M15) to reduce signal "noise."
- The Dashboard will automatically hide columns for disabled TFs.
7. How to Use MTF Scan
7.1. How does scanning work?
After attaching the indicator and enabling the MTF Scanner:
- Startup (5-15 seconds): Loads historical data for all symbols × timeframes
- Historical scan: Finds patterns that appeared in the most recent N bars (per Look Back Bars )
- Real-time scan: Each time a new bar closes, checks for new signals
- Display: Results appear on the Dashboard + alerts fire if enabled
7.2. Signals displayed on chart
When a signal is detected, you will see on the chart:
Arrows:
- ▲ Green = BUY signal
- ▼ Red = SELL signal
- Arrows appear at the price and time where the pattern was detected
Horizontal lines (Trading Lines):
- Blue = Entry (entry level)
- Red = Stop Loss
- Green / Yellow / Orange / Purple = TP1 / TP2 / TP3 / TP4 (take profit levels)
Price labels:
- Show exact price and pip distance at each level
Tracking path:
- Dotted line connecting Entry to TP/SL levels as price moves
- Helps you visualize the price "journey" after the signal appears
Quality Score:
- A number from 0.0 to 1.0 displayed on the arrow
- Closer to 1.0 = stronger, more reliable pattern
7.3. Signal states
Each signal goes through these states:
| State | Visual | Meaning |
|---|---|---|
| PENDING | Dashed Entry line | Waiting for price to reach Entry |
| ACTIVE | Solid Entry line | Price has reached Entry, tracking TP/SL |
| TP HIT | Green marker at TP level | Price hit Take Profit (win) |
| SL HIT | Red marker at SL level | Price hit Stop Loss (loss) |
| EXPIRED | Hidden or faded | Signal expired (price didn't reach Entry within N bars) |
7.4. Signal filters
The indicator applies 7 filters automatically in order:
- Spacing — Filters signals too close together (prevents clustering)
- Quality — Filters low-quality patterns (below Min Quality threshold)
- Extreme Zone — Filters signals in overbought/oversold zones
- Direction — Filters by direction (BUY only, SELL only, or both)
- Stoploss Hunt — Filters signals near stoploss hunt zones
- Signal Zone — Filters by market structure zone (BOS/CHOCH)
- Opposite — Filters opposite signals when an active signal already exists
These filters use settings from other input groups (Quality Filter, Direction Filter, etc.). The indicator automatically syncs between the current chart and multi-symbol scan results.
8. How to Use the MTF Dashboard
8.1. Dashboard layout
The MTF Dashboard displays as a grid on the chart:
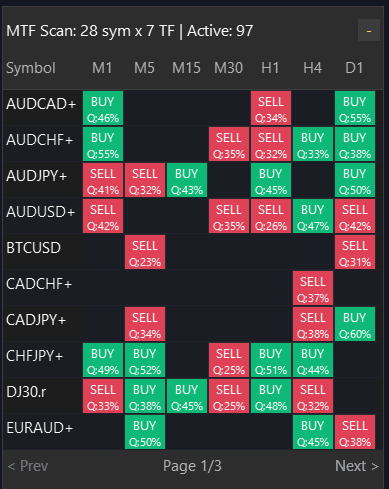
- Rows: One row per symbol
- Columns: One column per timeframe (left to right: M1 → W1)
- Empty cell: No signal
- Cell with BUY (green background): Buy signal
- Cell with SELL (red background): Sell signal
8.2. Information in each signal cell
When a cell contains a signal, you will see:
- BUY or SELL — trade direction
- Q:75% — pattern quality score (e.g., 75% = good quality)
8.3. Click to jump to chart
Most important feature: Click any signal cell on the Dashboard → the chart will automatically:
- Switch to that symbol
- Switch to that timeframe
- Display the signal with full Entry, SL, TP lines on the chart
Example: Click the "BUY" cell in the EURUSD row, H4 column → chart switches to EURUSD H4 and shows the signal.
8.4. Pagination
- The Dashboard shows a maximum of 10 symbols at once
- If more than 10 symbols have signals, use the Prev / Next buttons to navigate pages
- Symbols without signals are not displayed (saves space)
8.5. Drag & Minimize
- Drag: Hold the Dashboard title bar and drag to your preferred position
- Minimize: Click the [ − ] button on the Dashboard corner to minimize/expand
- Position saved: When switching timeframes or restarting, the Dashboard retains its position + minimize state
8.6. Color coding
| Cell color | Meaning |
|---|---|
| Green | BUY signal |
| Red | SELL signal |
| Empty / Gray | No signal |
9. Signal Dashboard (Trade Statistics Panel)
In addition to the MTF Dashboard (multi-symbol grid), the indicator also has a Signal Dashboard — a smaller statistics panel showing trade results for the current chart.
Input group === SIGNAL DASHBOARD ===
| Name in MT5 | Type | Default | Description |
|---|---|---|---|
| Show Signal Dashboard (stats panel) | true/false | true | Show/hide the statistics panel |
| Dashboard X Position (pixels) | Integer | 20 | Horizontal position |
| Dashboard Y Position (pixels) | Integer | 150 | Vertical position |
| Font Size (8-24 pixels) | Integer | 20 | Font size |
| Row Height (18-40 pixels) | Integer | 28 | Row height |
What it displays
The Signal Dashboard shows:
- Total signals on the current chart
- BUY signal count (Bullish) — in green
- SELL signal count (Bearish) — in red
- States: Pending / Active / Finished with respective counts
- TP results: Win/Loss for each TP1-4 + TSL level, win rate, total profit/loss pips
The Signal Dashboard only counts signals on the current chart (1 symbol + 1 timeframe). The MTF Dashboard is the multi-symbol grid.
10. FAQ & Common Issues
Q: Dashboard not visible on chart?
Check:
- Input Show Scanner Results Panel = true
- Input Enable Multi-Symbol Scanner = true
- The Dashboard may be minimized — look for a small title bar on the chart and click to expand
- The Dashboard may have been dragged off-screen — reset Panel X Position = 380 and Panel Y Position = 100
Q: Dashboard shows but no signals?
Possible causes:
- Data still loading — Wait 10-30 seconds after attaching the indicator. Check the Expert tab (Ctrl+Shift+E) to monitor loading progress.
- Filters too strict — Try lowering Min Quality (in the Quality Filter group). For example: from 0.6 down to 0.4.
- Few symbols in Market Watch — Add more symbols to Market Watch (Ctrl+M → right-click → Show All).
- No patterns exist — The market simply has no signals meeting the criteria right now. This is normal.
Q: Dashboard only shows signals for the current timeframe, not other TFs?
Cause: Data for other timeframes hasn't been downloaded by MT5 yet.
Solution:
- Wait an additional 10-30 seconds — the indicator automatically retries loading data
- Manually open charts on a few other TFs (e.g., open EURUSD H1, H4) so MT5 downloads the data
- Check the Expert log — if you see "unverified signals," the indicator is retrying
Q: Signal on Dashboard but clicking doesn't switch chart?
Check:
- Make sure no other window is overlapping the Dashboard
- Click exactly on the cell with BUY/SELL text (not an empty cell)
- The symbol must be in your Market Watch for the switch to work
Q: Too many alerts firing constantly?
Solution:
- Increase Alert Cooldown to 60-120 seconds
- Disable notify types you don't need (e.g., keep only Notify: Entry Price Hit )
- Disable smaller TFs (M1, M5) if you don't scalp — smaller TFs generate more signals
Q: MT5 running slow / lag after enabling MTF Scanner?
Solution:
- Decrease Batch Size to 20-30
- Disable unneeded TFs (e.g., disable M1, M5, W1)
- Reduce symbols in Market Watch (keep 20-30 key symbols)
- Decrease History Depth per Symbol to 15-20
- If still slow, enable Only Scan Current Symbol to scan only one symbol
Q: Signals appear then disappear?
This is normal behavior in these cases:
- Signal expired: Price didn't reach Entry within the designated time period
- Filtered by Opposite Signal: A stronger opposite signal appeared → old signal is hidden
- Filtered by Quality: If you increased Min Quality, weaker signals get filtered out
Q: After switching timeframes, Dashboard goes blank then reappears?
This is normal behavior. When switching timeframes:
- The indicator must reload data for the new TF
- The Dashboard will be blank for 2-5 seconds
- Signals gradually reappear
- Dashboard position and minimize state are preserved
Q: Signals on current chart differ from MTF Dashboard?
This is by design:
- Current chart shows signals for 1 symbol + 1 TF
- MTF Dashboard shows signals from ALL scanned symbols + TFs
- The two sources may differ because each applies filters in its own context
Q: Numbers on Signal Dashboard and MTF Dashboard don't match?
This is normal:
- Signal Dashboard counts all signals on the current chart (including historical)
- MTF Dashboard only shows active signals (Pending or Active)
- The two panels count from different data sources and criteria
Quick Reference
| Want to... | Do... |
|---|---|
| Enable MTF Scanner | Enable Multi-Symbol Scanner = true |
| Scan only 1 symbol | Only Scan Current Symbol = true |
| Show/hide Dashboard | Show Scanner Results Panel = true/false |
| Choose TFs to scan | Enable/disable each TF in the MTF TIMEFRAMES group |
| Get alerts on Entry hit | Enable Scanner Alerts = true + Notify: Entry Price Hit = true |
| Reduce lag | Decrease Batch Size, disable unneeded TFs, reduce Market Watch symbols |
| Move Dashboard | Drag the title bar on the chart |
| Minimize Dashboard | Click the [ − ] button on the Dashboard |


")

")