

This indicator is not only easy to learn, but highly accurate in giving JPY trading signals. When one learns how to use it correctly, one can build a very high accuracy and profit ratio trading the JPY pairs which can be some of the most volatile. Taking this class can give you a chance to master trading the yen and learn a unique approach to trading the Asian pairs as a whole.
Ichimoku is a technical or chart indicator that is also a trend trading
system in and of itself. The creator of the indicator, Goichi Hosada,
introduced Ichimoku as a “one glance” indicator so that in a few
seconds you are able to determine whether a tradable trend is present
or if you should wait for a better set-up on a specific pair.
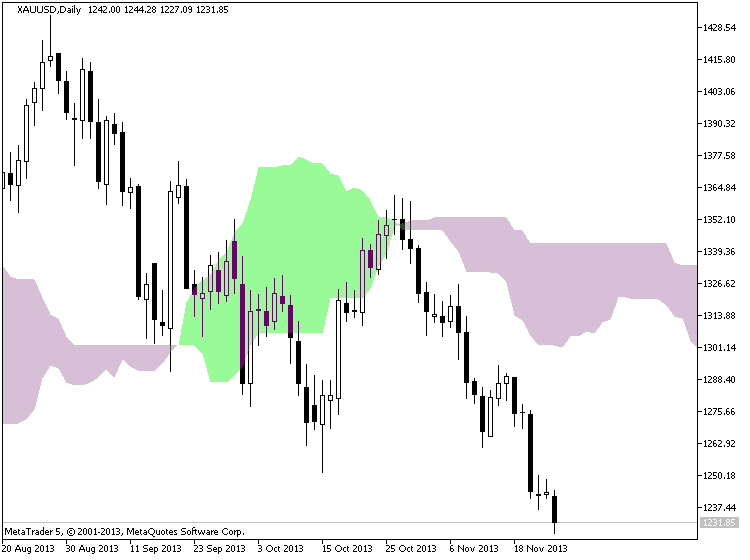
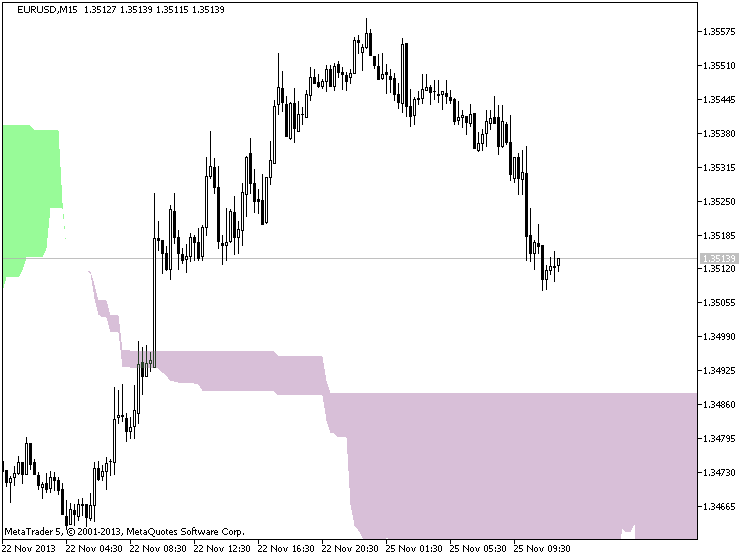
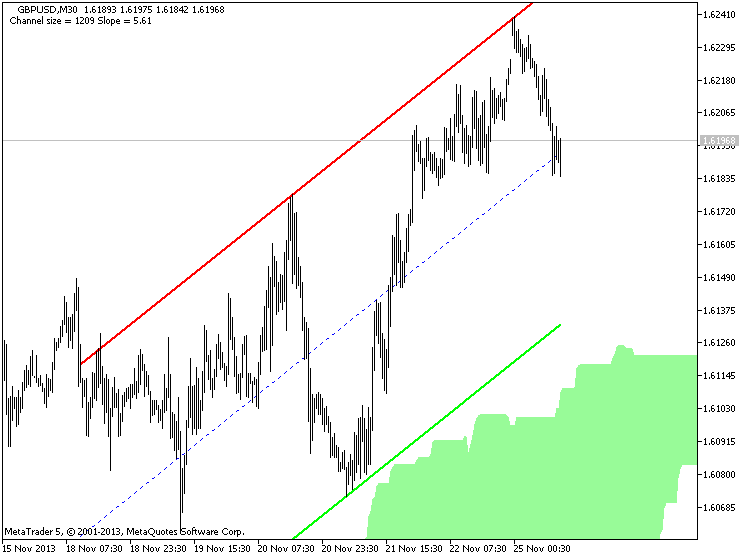
Ichimoku indicator description
- Tenkan Sen - moving average of the highest high and lowest low over the last 9 trading days. (Highest high + Lowest low) / 2 over the last 9 trading days
- Kijun Sen - moving average of the highest high and lowest low over the last 26 trading days. (Highest high + Lowest low) / 2 over the last 26 trading days.
- Senkou Span A - the average of the Tenkan Sen and Kijun Sen, plotted 26 days ahead. (Tenkan Sen + Kijun Sen) / 2 plotted 26 days ahead
- Senkou Span B - the average of the highest high and lowest low over the last 52 days, plotted 26 days ahead. (Highest high + Lowest low) / 2 over the last 52 trading days plotted 26 days ahead.
- Chikou Span - the closing price plotted 26 days behind.


")