Discussion of article "Graphical Interfaces XI: Integrating the Standard Graphics Library (build 16)"
Great library!
Congrantulations again! Nice job!
Good afternoon.
The problem appeared from where I was not expecting it...
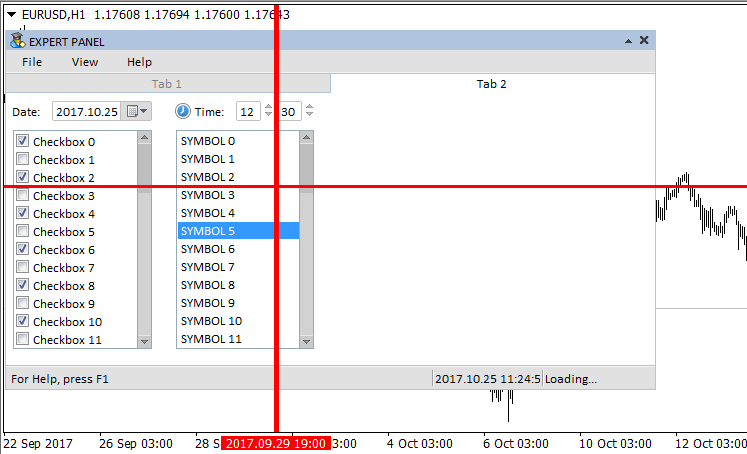
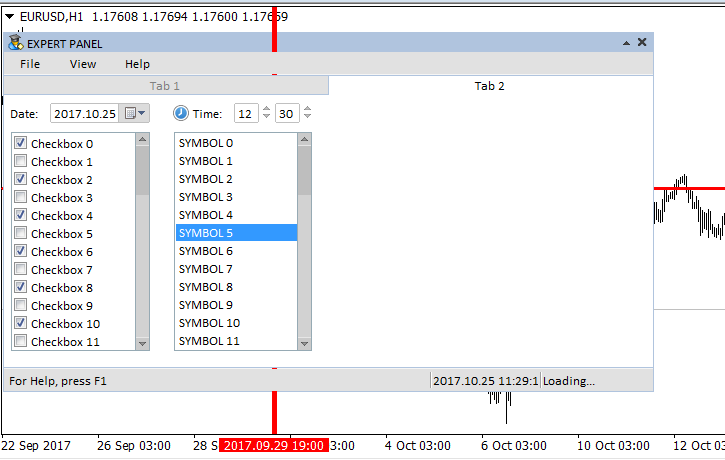
There was a program - one main window, one dialogue window. Everything was fine. I added another dialogue window.
Now this is how they behave. We open one dialogue window - everything is fine, it works. Close it. Open the second one, the elements in it don't react to clicks, or rather they react strangely (on the screenshot). Until you click on the window title, then everything is normal with this window. But the same problem now with the first window, until you click on the title.
Could you please tell me what could be wrong? Or where to look at all?
I downloaded the package, and create a demo GUI of CTable.
#include <\\EasyAndFastGUI\\WndEvents.mqh>

//+------------------------------------------------------------------+
//| Class for creating an application                                |
//+------------------------------------------------------------------+
class CGUI : public CWndEvents {
  private:
    CWindow           m_window;
    CTable            m_table;

  public:
    bool              CreateGUI(const int x, const int y, const string caption_text);

  private:
    bool              CreateWindow(const int x, const int y, const int x_size, const int y_size, const string text);
    bool              CreateTable(const int x_gap, const int y_gap);
};

bool CGUI::CreateGUI(const int x, const int y, const string caption_text) {
  int x_size = 400,
      y_size = 400;

  if (!CreateWindow(x, y, x_size, y_size, caption_text)) {
    return(false);
  }

  if (!CreateTable(1, 20)) {
    return(false);
  }

  m_chart.Redraw();
  return(true);
}

//+------------------------------------------------------------------+
//| Creates form 1 for controls                                      |
//+------------------------------------------------------------------+
bool CGUI::CreateWindow(const int x, const int y, const int x_size, const int y_size, const string caption_text) {
  CWndContainer::AddWindow(m_window);

  m_window.XSize(x_size);
  m_window.YSize(y_size);
  m_window.Alpha(255);

  m_window.IsMovable(true);
  m_window.ResizeMode(true);
  m_window.CloseButtonIsUsed(true);
  m_window.FullscreenButtonIsUsed(true);
  m_window.CollapseButtonIsUsed(true);
  m_window.TooltipsButtonIsUsed(true);
  m_window.RollUpSubwindowMode(true, true);
  m_window.TransparentOnlyCaption(true);

  //--- Set the tooltips
  m_window.GetCloseButtonPointer().Tooltip("Close");
  m_window.GetFullscreenButtonPointer().Tooltip("Fullscreen/Minimize");
  m_window.GetCollapseButtonPointer().Tooltip("Collapse/Expand");
  m_window.GetTooltipButtonPointer().Tooltip("Tooltips");

  m_window.BackColor((color)ChartGetInteger(m_chart_id, CHART_COLOR_BACKGROUND));
  m_window.BorderColor(clrMaroon);

  return(m_window.CreateWindow(m_chart_id, m_subwin, caption_text, x, y));
}

//+------------------------------------------------------------------+
//| Create a rendered table                                          |
//+------------------------------------------------------------------+
bool CGUI::CreateTable(const int x_gap,const int y_gap) {
  m_table.MainPointer(m_window);

  int x_size = 300,
      y_size = 300;

  int column_width[] = {100, 200};

  m_table.XSize(x_size);
  m_table.YSize(y_size);

  m_table.TableSize(2, 10);

  m_table.ColumnsWidth(column_width);
  m_table.CellYSize(30);

  ENUM_ALIGN_MODE column_align[];
  ArrayResize(column_align, 2);
  ::ArrayInitialize(column_align, ALIGN_RIGHT);
  m_table.TextAlign(column_align);

  color bg_color = (color)ChartGetInteger(m_chart_id, CHART_COLOR_BACKGROUND);
  m_table.CellColor(bg_color);
  m_table.GridColor(bg_color);
  m_table.BorderColor(bg_color);
  m_table.FontSize(12);

  /*
  CScrollV *scroll_v = m_table.GetScrollVPointer();
  scroll_v.ChangeThumbSize(0, 0);
  scroll_v.Hide();
  scroll_v.IsVisible(false);

  CScrollH *scroll_h = m_table.GetScrollHPointer();
  scroll_h.ChangeThumbSize(0, 0);
  scroll_h.Hide();
  scroll_h.IsVisible(false);
  //*/


  //m_table.TextXOffset(5);
  //m_table.TextYOffset(4);
  m_table.ShowHeaders(false);
  m_table.SelectableRow(false);
  m_table.ColumnResizeMode(false);
  //m_table.IsZebraFormatRows(clrWhiteSmoke);
  //m_table.AutoXResizeMode(true);
  //m_table.AutoXResizeRightOffset(1);
  //m_table.AutoYResizeMode(true);
  //m_table.AutoYResizeBottomOffset(25);

  if (!m_table.CreateTable(x_gap, y_gap)) {
    return(false);
  }

  CWndContainer::AddToElementsArray(0, m_table);

  m_table.Update(true);

  m_window.Update(true);

  return(true);
}

//+------------------------------------------------------------------+
//| Expert initialization function                                   |
//+------------------------------------------------------------------+
int OnInit()
  {
//---
   CGUI gui;
   gui.CreateGUI(10, 50, "Test GUI");
//---
   return(INIT_SUCCEEDED);
  }
//+------------------------------------------------------------------+
//| Expert deinitialization function                                 |
//+------------------------------------------------------------------+
void OnDeinit(const int reason)
  {
//---

  }
//+------------------------------------------------------------------+
//| Expert tick function                                             |
//+------------------------------------------------------------------+
void OnTick()
  {
//---

  }
//+------------------------------------------------------------------+
But I found CTable control alsways leave H/V scrollbar spaces, I could not remove them by Hide(), IsVisiable(false).
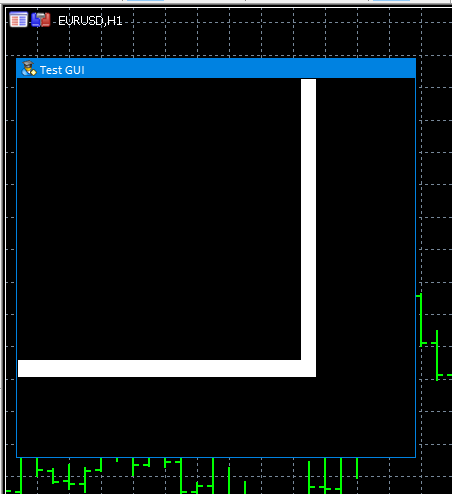
So, could you give me a workaround?
Thanks in advance,
David
Perhaps this question has already been discussed, but I didn't see it. How to make the panel redraw after adding new objects to the chart (e.g. lines)
I noticed that if I minimise the panel, it is already on top of these lines, but not all of them :(((
Perhaps this question has already been discussed, but I didn't see it. How to make the panel redraw after adding new objects to the chart (for example, lines)?
- Download the latest version of the library.
- Try calling the CWndEvents::ResetWindow() method.
P.S. The library will not be updated anymore. All necessary changes, corrections and additions, if such a need arises, users should learn to make on their own.
- Download the latest version of the library.
- Try calling the CWndEvents::ResetWindow() method.
P.S. The library will no longer be updated. All necessary changes, corrections and additions, if such a need arises, users should learn to make on their own.
Got it, thanks
Unfortunately, the various builds (releases) do not fit together.
I mean: all examples from Article01 to Article11 should really work without errors.
However, the compiler throws a lot of warnings and errors in the previous examples.

By 'copying over' the new versions, the older examples no longer work.
Furthermore, the translations are inadequate or non-existent.
![]()
Great!
![]()
It's a shame and typical for so many things at Metaquotes.
It would really be time to put a fully functional and complete release online and not just incompatible bits and pieces.
A table of contents of the sample files and where to find what is missing. This would be a topic for the last article in this series, as it is rumoured that it will not be continued.
It would be a real shame to waste all that work if there were no working examples to use.
Kind regards, Otto Pauser
And what is really missing is a dialogue editor!
I'm going to try
- Free trading apps
- Over 8,000 signals for copying
- Economic news for exploring financial markets
You agree to website policy and terms of use
New article Graphical Interfaces XI: Integrating the Standard Graphics Library (build 16) has been published:
A new version of the graphics library for creating scientific charts (the CGraphic class) has been presented recently. This update of the developed library for creating graphical interfaces will introduce a version with a new control for creating charts. Now it is even easier to visualize data of different types.
Earlier, the developed library had used a copy of the CCanvas class designed for drawing. Due to recent global refactoring of the library's code, this copy is no longer needed and it can be removed by replacing it with the original version from the standard library. This reduced the volume of the library by approximately 10% and almost by 40% relative to the version presented before the refactoring in the articles Graphical Interfaces XI: Refactoring the Library code (build 14.1) and Graphical Interfaces XI: Rendered controls (build 14.2).
The CGraphic class will now be used for creating charts.Fig. 7. Demonstration of an animated hypocycloid.
Author: Anatoli Kazharski