

Probabilistic Sharpe Ratio and Minimum Track Record Length from Deal History
 85
 0

Contents
- Introduction
- The Math: Probabilistic Sharpe Ratio and MinTRL
- From Deal History to a Return Series
- Signal Generation: A Real Bug, Found and Fixed
- Risk Sizing and Trade Execution
- Self-Test: Trusting the Numbers Before Trusting the Report
- The Dashboard Script
- Validation: Twelve Runs Across Three Symbols
- Limitations
- Conclusion
1. Introduction
Your Strategy Tester report gives you a Sharpe ratio and you feel good about it. But here's the question nobody's report answers: is that number real, or did you just get lucky with a short sample? Bailey and Lopez de Prado proposed the Probabilistic Sharpe Ratio (PSR) for exactly this case. Given your actual sample size and returns that rarely fit a textbook bell curve, PSR estimates the probability that your true edge beats some benchmark SR*. Minimum Track Record Length (MinTRL) is the same question turned around: how many trades before you can make that claim with a straight face?
This article extracts both statistics directly from MetaTrader 5 deal history, wires them into a working EA, and validates the result across twelve legs in the Strategy Tester, spanning three symbols. During that testing I found a real bug in the signal code - iHighest/iLowest misused as if they were indicator handles - and I'm documenting the fix here instead of pretending it never happened, because the same mistake can bite you on a live account if you don't catch it first.
I'm going to lean hard on code and light on description. Every function that matters for verifying PSR or MinTRL - ComputePSR, ComputeMinTRL, NormalQuantile, BuildReturnsFromHistory - is shown below as a complete, unabbreviated body, not a fragment. A couple of longer loops that repeat earlier logic get a one-line "see the attached file" note instead of being printed twice, and I call that out explicitly wherever it happens rather than leaving you to guess. Formatting follows the same comment discipline throughout: block comments (//---) mark a step, inline comments trail the line they belong to, and wrapped arguments line up under the first character after the opening parenthesis.
2. The Math: Probabilistic Sharpe Ratio and MinTRL
Say you've got a return series with sample Sharpe ratio SR, skewness g3, and kurtosis g4 (normal distribution: kurtosis = 3). PSR against some benchmark SR* works out to:
PSR(SR*) = Φ( (SR − SR*) · √(n−1) / √(1 − g3·SR + ((g4−1)/4)·SR²) )
Φ here is just the standard normal CDF. The denominator is the Mertens (2002) correction, and it inflates the variance of your Sharpe-ratio estimate whenever returns are negatively skewed or fat-tailed - which describes almost every trading return series you'll ever look at. Solve that same expression for n at a fixed confidence level 1−α and you get MinTRL instead:
MinTRL = 1 + (1 − g3·SR + ((g4−1)/4)·SR²) · (Z α / (SR − SR*))²
Squaring (SR − SR*) in that last term erases its sign, and that's worth sitting with for a second rather than skating past it. The formula hands you a track length regardless of which side of SR* your observed SR sits on, but what that number actually means flips depending on the sign you squared away. When SR exceeds SR*, it's the n where PSR climbs up to your target confidence - the "years until I can confidently say I beat the benchmark" reading everyone assumes by default. When SR sits below SR*, more observations push PSR the other way, down toward zero, not up toward one - so the same arithmetic instead gives you the n where you can confidently rule SR* out, a "years until I can confidently say I don't beat the benchmark" figure. Same equation, opposite question, and nothing in the formula itself tells you which one you're looking at. ComputeMinTRL below records that sign explicitly rather than leaving it for the caller to infer.
Both formulas need a normal CDF and its inverse, and MQL5 gives you neither out of the box. So PSRCore.mqh builds them from closed-form rational approximations rather than dragging in an external library:
//+------------------------------------------------------------------+
//| NormalCDF                                                        |
//+------------------------------------------------------------------+
double NormalCDF(const double x)
  {
//--- Phi(x) = 0.5 * erfc(-x / sqrt(2)), erfc via Abramowitz & Stegun 7.1.26
   double z = MathAbs(x) / 1.4142135623730951;
   double t = 1.0 / (1.0 + 0.3275911 * z);
   double poly = t * (0.254829592 +
                 t * (-0.284496736 +
                 t * (1.421413741 +
                 t * (-1.453152027 +
                 t * 1.061405429))));
   double erf_z = 1.0 - poly * MathExp(-z * z);
   double erf_x = (x >= 0.0) ? erf_z : -erf_z;
   return(0.5 * (1.0 + erf_x));
  }
The inverse is what turns a confidence level like 95% into a Z-score for MinTRL. It uses Acklam's rational approximation, branched across the low, central and high tails of the distribution - three separate polynomial fits stitched together:
//+------------------------------------------------------------------+
//| NormalQuantile                                                   |
//+------------------------------------------------------------------+
double NormalQuantile(const double p)
  {
//--- Acklam's rational approximation of Phi^-1(p); valid for 0<p<1
   if(p <= 0.0)
      return(-DBL_MAX);
   if(p >= 1.0)
      return(DBL_MAX);

   const double a1 = -3.969683028665376e+01;
   const double a2 =  2.209460984245205e+02;
   const double a3 = -2.759285104469687e+02;
   const double a4 =  1.383577518672690e+02;
   const double a5 = -3.066479806614716e+01;
   const double a6 =  2.506628277459239e+00;

   const double b1 = -5.447609879822406e+01;
   const double b2 =  1.615858368580409e+02;
   const double b3 = -1.556989798598866e+02;
   const double b4 =  6.680131188771972e+01;
   const double b5 = -1.328068155288572e+01;

   const double c1 = -7.784894002430293e-03;
   const double c2 = -3.223964580411365e-01;
   const double c3 = -2.400758277161838e+00;
   const double c4 = -2.549732539343734e+00;
   const double c5 =  4.374664141464968e+00;
   const double c6 =  2.938163982698783e+00;

   const double d1 =  7.784695709041462e-03;
   const double d2 =  3.224671290700398e-01;
   const double d3 =  2.445134137142996e+00;
   const double d4 =  3.754408661907416e+00;

   const double p_low  = 0.02425;
   const double p_high = 1.0 - p_low;
   double q, r, x;

   if(p < p_low)
    {
      q = MathSqrt(-2.0 * MathLog(p));
      x = (((((c1 * q + c2) * q + c3) * q + c4) * q + c5) * q + c6) /
           ((((d1 * q + d2) * q + d3) * q + d4) * q + 1.0);
    }
   else if(p <= p_high)
    {
      q = p - 0.5;
      r = q * q;
      x = (((((a1 * r + a2) * r + a3) * r + a4) * r + a5) * r + a6) * q /
          (((((b1 * r + b2) * r + b3) * r + b4) * r + b5) * r + 1.0);
    }
   else
    {
      q = MathSqrt(-2.0 * MathLog(1.0 - p));
      x = -(((((c1 * q + c2) * q + c3) * q + c4) * q + c5) * q + c6) /
           ((((d1 * q + d2) * q + d3) * q + d4) * q + 1.0);
    }
   return(x);
  }
I checked both functions against scipy.stats.norm at ten and nine reference points respectively, and every one matched to better than 1e-6 - the same tolerance RunSelfTest() enforces at runtime (section 6).
With those two building blocks done, ComputePSR and ComputeMinTRL are pretty much a direct transcription of the formulas above. I added guards for the obvious degenerate cases - zero variance, a zero denominator, and SR landing exactly on SR* - to keep those from eventually crashing your report once they show up on a live account. ComputeMinTRL also stamps a mintrl_confirms flag onto the report, set by nothing more than the sign of (SR − SR*), so a caller never has to work out by eye which of the two readings from the previous section applies:
//+------------------------------------------------------------------+
//| ComputePSR                                                       |
//+------------------------------------------------------------------+
double ComputePSR(const double &returns[], const int n, const double sr_star,
                   SPSRReport &report)
  {
   double mean, sd, skew, kurt;
   ComputeMoments(returns, n, mean, sd, skew, kurt);

   report.n       = n;
   report.mean    = mean;
   report.sd      = sd;
   report.sr_star = sr_star;

   if(n < 2 || sd <= 0.0)
     {
      report.sr   = 0.0;
      report.skew = 0.0;
      report.kurt = 0.0;
      report.psr  = 0.0;
      return(0.0);
     }

   double sr = mean / sd;
   double denom = 1.0 - skew * sr + ((kurt - 1.0) / 4.0) * sr * sr;
   if(denom <= 0.0)
      denom = 1.0e-12;             // degenerate moment combination guard

   double z = (sr - sr_star) * MathSqrt(n - 1) / MathSqrt(denom);

   report.sr   = sr;
   report.skew = skew;
   report.kurt = kurt;
   report.psr  = NormalCDF(z);
   return(report.psr);
  }
Here's ComputeMinTRL in full - the same inputs, the same moment calculation, but solving the formula for n instead of for a probability, and stamping that mintrl_confirms flag along the way:
//+------------------------------------------------------------------+
//| ComputeMinTRL                                                    |
//+------------------------------------------------------------------+
double ComputeMinTRL(const double &returns[], const int n, const double sr_star,
                             const double alpha, SPSRReport &report)
  {
   double mean, sd, skew, kurt;
   ComputeMoments(returns, n, mean, sd, skew, kurt);

   report.n     = n;
   report.mean  = mean;
   report.sd    = sd;
   report.alpha = alpha;

   if(n < 2 || sd <= 0.0)
     {
      report.mintrl_obs = 0.0;
      return(0.0);
     }

   double sr  = mean / sd;
   double gap = sr - sr_star;

//--- the gap's sign decides what the solved-for n actually means: squaring
//--- (SR-SR*) below erases that sign, so the same formula answers two
//--- different questions depending on which side of SR* the observed SR
//--- sits on. SR>SR*: n needed to confirm superiority with confidence
//--- 1-alpha. SR<=SR*: n needed to confidently reject superiority at the
//--- same alpha - never a "years to confirm the edge" figure
   report.mintrl_confirms = (gap > 0.0);

   if(MathAbs(gap) < 1.0e-12)
     {
      report.mintrl_obs = DBL_MAX;      // undefined: SR equals the benchmark exactly
      return(DBL_MAX);
     }

   double denom = 1.0 - skew * sr + ((kurt - 1.0) / 4.0) * sr * sr;
   if(denom <= 0.0)
      denom = 1.0e-12;

   double z_alpha = NormalQuantile(1.0 - alpha);
   double mintrl  = 1.0 + denom * (z_alpha / gap) * (z_alpha / gap);

   report.sr         = sr;
   report.skew       = skew;
   report.kurt       = kurt;
   report.mintrl_obs = mintrl;
   return(mintrl);
  }
One thing to watch if you're porting this into your own code: sr, skew and kurt in the struct are all per-observation, not annualized. Only SR* gets converted between annual and per-observation units, inside BuildFullReport, by dividing the annual figure by the square root of the observation frequency:
sr_star_obs = sr_star_annual / √(periods_per_year)
Mixing annualized and per-observation Sharpe ratios inside the PSR formula won't throw an error - it'll just quietly hand you a wrong number.
Two guards in that snippet are worth calling out rather than glossing over. When sd <= 0.0 the function hands back PSR = 0 - that's a safe default so the caller doesn't divide by zero, not a real statistical statement about the return series; a flat or single-observation series simply has no meaningful Sharpe ratio to test. And when the denominator (the Mertens correction term) works out to zero or negative - which can happen with an unusual skew/kurtosis combination at high SR - the code clamps it to 1e-12 instead of failing. That prevents a crash, but it can also turn an internally inconsistent moment combination into a confident-looking (and possibly extreme) PSR number instead of an explicit "invalid" result. None of the twelve runs below hit that clamp, but if you're adapting this for your own data, it's worth logging whenever it fires.
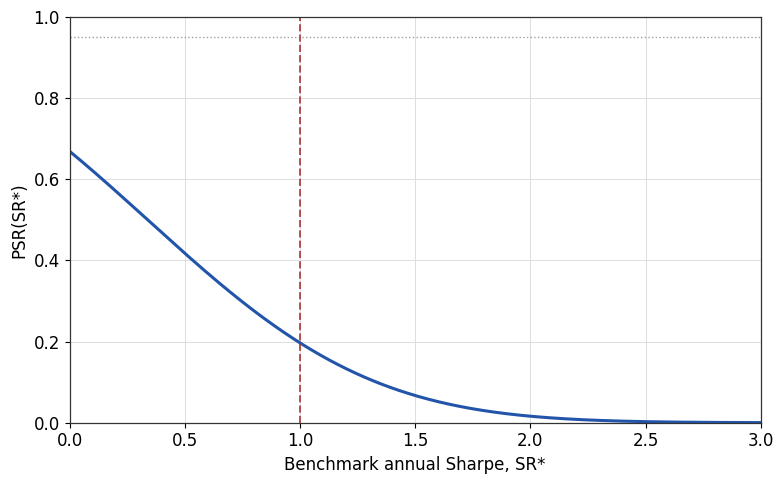
That curve is really the whole point of PSR - push the benchmark SR* up, and the probability your real edge clears it goes down. Here's what it looks like plotted against the strongest leg in the validation matrix (XAUUSD M15 Donchian, more in section 8):
Fig. 1. PSR against benchmark Sharpe for XAUUSD M15 Donchian.
3. From Deal History to a Return Series
PSR and MinTRL both need a clean array of per-trade returns. The problem is HistorySelect doesn't give you that - it hands back a flat stream of deals, opens and closes and partial fills and swaps and commissions and balance operations all jumbled together. BuildReturnsFromHistory untangles all of that into one net return per closed position, expressed as a fraction of the account balance right before that position closed, which keeps the return series comparable no matter what position size you were trading:
//+------------------------------------------------------------------+
//| BuildReturnsFromHistory                                          |
//+------------------------------------------------------------------+
int BuildReturnsFromHistory(const datetime from_date, const datetime to_date,
                             const ulong magic_filter, const string symbol_filter,
                             double &returns[], datetime &first_deal_time,
                             datetime &last_deal_time, const int start_deal_index = 0)
  {
   first_deal_time = 0;
   last_deal_time  = 0;
   if(!HistorySelect(from_date, to_date))
      return(0);

//--- start_deal_index skips deals already present before this run began,
//--- so a caller that records a baseline at OnInit stays isolated even if
//--- the tester carries account history over between successive runs
   int total = HistoryDealsTotal();
   ulong seen_positions[];
   double position_pl[];
   int position_count = 0;

   double running_balance = 0.0;
   bool   have_balance    = false;

   for(int i = start_deal_index; i < total; i++)
     {
      ulong ticket = HistoryDealGetTicket(i);
      long deal_type = HistoryDealGetInteger(ticket, DEAL_TYPE);

      //--- balance operations move equity but are never counted as a return
      if(deal_type == DEAL_TYPE_BALANCE)
        {
         running_balance += HistoryDealGetDouble(ticket, DEAL_PROFIT);
         have_balance = true;
         continue;
        }
      if(deal_type != DEAL_TYPE_BUY && deal_type != DEAL_TYPE_SELL)
         continue;

      long entry = HistoryDealGetInteger(ticket, DEAL_ENTRY);
      if(entry != DEAL_ENTRY_OUT && entry != DEAL_ENTRY_INOUT)
         continue;                 // only closing legs carry realized P/L

      //--- track the real elapsed time qualifying deals actually cover,
      //--- so the caller can derive trades-per-year instead of guessing
      datetime deal_time = (datetime)HistoryDealGetInteger(ticket, DEAL_TIME);
      if(first_deal_time == 0 || deal_time < first_deal_time)
         first_deal_time = deal_time;
      if(deal_time > last_deal_time)
         last_deal_time = deal_time;

      ulong pos_id = HistoryDealGetInteger(ticket, DEAL_POSITION_ID);
      double net = HistoryDealGetDouble(ticket, DEAL_PROFIT) +
                   HistoryDealGetDouble(ticket, DEAL_SWAP) +
                   HistoryDealGetDouble(ticket, DEAL_COMMISSION);
      //--- multiple deals can share one position id (partial closes);
      //--- fold every leg of the same position into a single net P/L
      int idx = -1;
      for(int j = 0; j < position_count; j++)
        {
         if(seen_positions[j] == pos_id)
          {
           idx = j;
           break;
        }
      }

      if(idx < 0)
        {
         position_count++;
         ArrayResize(seen_positions, position_count);
         ArrayResize(position_pl, position_count);
         seen_positions[position_count - 1] = pos_id;
         position_pl[position_count - 1] = net;
      }
      else
         position_pl[idx] += net;
     }

   if(position_count <= 0)
      return(0);

   if(have_balance)
      PrintFormat("BuildReturnsFromHistory: %.2f in deposit/withdrawal balance operations "
                  "detected and excluded from the return series", running_balance);
  }
Three things in there deserve a closer look. First, DEAL_POSITION_ID is what lets you fold partial closes back into a single trade. Skip that and a position closed in three pieces contributes three correlated observations instead of one - which quietly understates your true sample variance. Second, start_deal_index is purely a precaution: the Strategy Tester's account history can carry over across terminal sessions rather than being scoped to a single run, and capturing HistoryDealsTotal() at OnInit and passing it back in here would isolate the run if that history carryover ever became an issue. As it turned out when I actually tested for it (section 9), the tester already isolates successive runs on its own, so this parameter never had anything to protect against in the twelve runs behind this article. I'm keeping it in the signature anyway, on the belt-and-suspenders theory that a precaution costing one optional argument is cheap insurance against a scenario I haven't hit yet.
Third, first_deal_time and last_deal_time come back by reference holding the timestamps of the earliest and latest qualifying closing deal - that's what lets the caller work out how much real time this return series actually spans, which turns out to matter a lot once you get to annualizing anything (more on that in a moment). Fourth, running_balance and have_balance exist specifically to catch deposits and withdrawals (DEAL_TYPE_BALANCE deals) that move the account's balance without being a trade - none of the twelve runs behind this article triggered one, so running_balance stayed at zero throughout, but the accounting is there and logged via PrintFormat if a future run ever does see one.
Once you've got position P/L sorted, the balance path gets walked backward from the account's current balance to find the starting balance, then forward again to turn each position's P/L into an actual return. The subtraction undoes two things, not one: every closed position's P/L, and (via running_balance, tracked above) any deposit or withdrawal that moved the account's balance without being a trade - skip that second part and a mid-run deposit would get misread as part of the trading return:
double start_balance = AccountInfoDouble(ACCOUNT_BALANCE) - running_balance;
for(int j = position_count - 1; j >= 0; j--)
   start_balance -= position_pl[j];
if(start_balance <= 0.0)
   start_balance = 1.0;         // guard against a zero/negative baseline

ArrayResize(returns, position_count);
double balance = start_balance;
for(int j = 0; j < position_count; j++)
  {
   returns[j] = position_pl[j] / balance;
   balance += position_pl[j];
  }
return(position_count);
Those two timestamps feed straight into the function that turns them into an actual annualization scale:
//+------------------------------------------------------------------+
//| ComputeTradesPerYear                                             |
//+------------------------------------------------------------------+
double ComputeTradesPerYear(const int n, const datetime first_deal_time,
                             const datetime last_deal_time)
  {
//--- the observation frequency a per-trade return series actually has is
//--- trades per year, not bars per year - derive it from the real elapsed
//--- time between the first and last qualifying deal, never from the
//--- chart's timeframe, so the same function serves the EA and the
//--- dashboard script alike regardless of symbol or period
   double span_days = (double)(last_deal_time - first_deal_time) / 86400.0;
   if(span_days < 1.0)
      span_days = 1.0;               // guard against a same-day or single-trade window
   double span_years = span_days / 365.25;
   return(n / span_years);
  }
This replaces an earlier version of the EA that annualized with a hardcoded bars-per-year lookup instead - a leftover from copying the pattern straight off a bar-based indicator project, without stopping to ask whether this return series was actually one observation per bar. It isn't: BuildReturnsFromHistory emits one return per closed position, so the only scale that matches the data is trades per year, computed from how much real time those trades actually spanned. Both PSRStrategy_EA.mq5 and PSRDashboard.mq5 now call this same function off the same deal history, so a Strategy Tester run and a dashboard script pointed at its CSV output always agree on the annualization scale - one procedure, not two.
4. Signal Generation: A Real Bug, Found and Fixed
The EA runs two entry modes side by side, on purpose, so the PSR report has a control to measure itself against: a Donchian channel breakout, and a seeded-random entry running the exact same risk and exits. If PSR can't tell the two apart, the statistic isn't earning its keep.
My first working version of the Donchian signal called iHighest() and iLowest() and fed whatever they returned straight into CopyBuffer() - the same pattern I'd used for iATR() and iMA(). It compiled fine, ran without a single error, and produced zero trades on every Donchian test. Zero. The Journal spelled it out plainly: "only 0 closed position(s), skipping report" on a run that should have traded. Turns out unlike iATR and iMA, iHighest() and iLowest() hand back an int bar index, not an indicator handle. Feed a bar index to CopyBuffer() and it fails silently - no warning, nothing - so the channel bounds never got computed and the breakout condition never had a chance to fire. An easy trap, and I fell right into it.
The fix throws out the phantom handles and reads the price arrays directly instead, computing the channel bounds with ArrayMaximum/ArrayMinimum:
//+------------------------------------------------------------------+
//| DonchianSignal                                                   |
//+------------------------------------------------------------------+
int DonchianSignal()
  {
//--- channel is read over the InpDonchianPeriod bars strictly before the
//--- signal bar, so bar 1 is excluded from its own breakout comparison
   double highs[], lows[];
   if(CopyHigh(_Symbol, _Period, 2, InpDonchianPeriod, highs) != InpDonchianPeriod)
      return(0);
   if(CopyLow(_Symbol, _Period, 2, InpDonchianPeriod, lows) != InpDonchianPeriod)
      return(0);

   int hi_idx = ArrayMaximum(highs);
   int lo_idx = ArrayMinimum(lows);
   if(hi_idx < 0 || lo_idx < 0)
      return(0);

   double channel_hi = highs[hi_idx];
   double channel_lo = lows[lo_idx];
   double close1 = iClose(_Symbol, _Period, 1);

   if(close1 >= channel_hi)
      return(1);                 // breakout above the channel high
   if(close1 <= channel_lo)
      return(-1);                // breakout below the channel low
   return(0);
  }
After that fix, all six Donchian legs of the validation matrix came back with real, populated trade counts (section 8 has the numbers). The random control needs no channel logic at all - it's a coin flip seeded once in OnInit, so the same seed reproduces the exact same trade sequence on every rerun, which is what makes the whole 12-run matrix reproducible. That seeding is two lines in OnInit, shown here rather than left implied:
MathSrand(InpRandomSeed);
g_rand_state = InpRandomSeed;
g_rand_state isn't read anywhere else in this build - it's there so a future version could log the exact seed a CSV row came from without re-deriving it - but MathSrand(InpRandomSeed) is what actually fixes the sequence, called once per run before a single tick arrives. Change InpRandomSeed and you get a different, equally reproducible sequence; leave it at 12345 (section 8's value for every Random leg) and you get the exact runs reported here. RandomSignal itself just draws from that fixed sequence:
//+------------------------------------------------------------------+
//| RandomSignal                                                     |
//+------------------------------------------------------------------+
int RandomSignal()
  {
//--- a coin-flip control: no edge by construction, same risk and exits
   int r = MathRand();
   if(r % 3 == 0)
      return(1);
   if(r % 3 == 1)
      return(-1);
   return(0);
  }
One honest caveat about that control before I lean on it in section 8: "random control" here means one fixed seed run once per symbol/timeframe pair, sitting in a market with real spread, commission and swap, which gives it a genuinely negative expectation rather than a clean zero-edge baseline. A single realization also can't stand in for the full distribution of outcomes a random strategy could produce - a different seed would land somewhere else on that distribution, by chance alone. It's a useful sanity check for "does PSR separate this from an obviously edgeless system," not a rigorous null-distribution benchmark, and I'd want many seeds averaged together before leaning on it any harder than that.
5. Risk Sizing and Trade Execution
Both entry modes share the same lot-sizing function, deliberately, so the PSR/MinTRL comparison never gets muddied by two legs sizing trades differently. Risk is sized to a fixed percentage of balance per trade, and the stop distance converts to money through tick value - with a cross-check against contract size, because some brokers report SYMBOL_TRADE_TICK_VALUE inconsistently with SYMBOL_TRADE_CONTRACT_SIZE on metals. Leave that unchecked and it'll quietly inflate every R-multiple you log by a clean multiple:
double loss_per_lot_tick     = (stop_distance / tick_size) * tick_value;
double loss_per_lot_contract = stop_distance * contract;

double loss_per_lot = loss_per_lot_tick;
if(loss_per_lot_tick <= 0.0 ||
   MathAbs(loss_per_lot_tick - loss_per_lot_contract) / loss_per_lot_contract > 0.5)
  {
   loss_per_lot = loss_per_lot_contract;
   static bool warned = false;
   if(!warned)
     {
      PrintFormat("PSRStrategy_EA: tick-value sizing (%.2f) disagrees with "
                  "contract-size sizing (%.2f) for %s, falling back to contract size",
                  loss_per_lot_tick, loss_per_lot_contract, _Symbol);
      warned = true;
     }
  }
The contract-size fallback itself has a narrower limitation worth flagging: stop_distance * contract only gives you a correct monetary risk figure when the instrument's profit currency matches your account currency. For a cross-currency instrument it needs a further conversion through the current exchange rate, which this fallback doesn't attempt - it's a reasonable last resort for a same-currency mismatch on metals, not a general-purpose currency converter. All twelve validation legs here traded instruments quoted against USD on a USD account, so the fallback never had to prove itself against that harder case.
Entry price, exit price, stop, target - they all key off the same ATR reading, pulled once per bar in OnTick, so the stop-loss distance used for sizing is exactly the distance that actually gets sent to the broker:
double atr[1];
if(CopyBuffer(g_handle_atr, 0, 1, 1, atr) != 1)
   return;

int signal = (InpEntryMode == ENTRY_DONCHIAN) ? DonchianSignal() : RandomSignal();
if(signal == 0)
   return;

double price = (signal > 0) ? SymbolInfoDouble(_Symbol, SYMBOL_ASK)
                            : SymbolInfoDouble(_Symbol, SYMBOL_BID);
double sl_dist = atr[0] * InpAtrMultSL;
double tp_dist = atr[0] * InpAtrMultTP;
double sl = (signal > 0) ? price - sl_dist
                          : price + sl_dist;
double tp = (signal > 0) ? price + tp_dist
                          : price - tp_dist;
The actual report gets built in OnDeinit: it pulls this run's own deals through BuildReturnsFromHistory, feeds them into BuildFullReport, then appends one CSV row per run. That's how twelve separate Strategy Tester runs end up accumulating into the single dataset I use in section 8:
double   returns[];
datetime first_deal_time, last_deal_time;
int n = BuildReturnsFromHistory(0, TimeCurrent(), InpMagic, _Symbol, returns,
                                first_deal_time, last_deal_time, g_deal_baseline);
if(n < 2)
  {
   PrintFormat("PSRStrategy_EA: only %d closed position(s), skipping report", n);
   return;
  }

SPSRReport report;
//--- this EA's return series is one observation per closed trade, not
//--- one per bar, so the annualization scale has to be trades per year,
//--- derived from the real time span this run's deals actually cover
double periods_per_year = ComputeTradesPerYear(n, first_deal_time, last_deal_time);
BuildFullReport(returns, n, InpSRStarAnnual, InpAlpha, periods_per_year, report);
WriteReportCSV("PSR_MinTRL", StringFormat("psr_runs_%s.csv", _Symbol), report, label);
An earlier version of this function annualized with a BarsPerYear() lookup keyed off the chart timeframe instead - a leftover from a bar-based indicator project, copied across without stopping to check whether the assumption still held. It didn't: this EA's return series is one observation per closed position, not per bar, so bars-per-year was the wrong frequency from the start. Feeding it into BuildFullReport as periods_per_year corrupted every downstream annualized number that depends on it - the per-observation SR* benchmark, the PSR computed against that benchmark, and MinTRL expressed in years - because all three assume the scale you hand them actually matches how often an observation occurs. ComputeTradesPerYear (section 3) fixes that by deriving the real trades-per-year figure straight from this run's own deal timestamps, and section 8's table and figures are recalculated using this same corrected code rather than a separately-maintained formula.
6. Self-Test: Trusting the Numbers Before Trusting the Report
A statistics library that quietly returns the wrong number is worse than one that crashes - at least a crash tells you something's wrong. RunSelfTest() runs on every OnInit, before a single trade goes out, and checks 28 fixed points: ten NormalCDF reference values, nine NormalQuantile reference values, six checks against a near-symmetric fixed return vector with a moderate Sharpe ratio, and three checks against a second vector with negative skew and a fat left tail. Every expected value was computed independently in Python/scipy, not back-derived from the MQL5 code, because checking your math against itself proves nothing:
//--- fixed vector v1: near-symmetric, moderate SR
double v1[] = {0.021, -0.008, 0.014, 0.003, -0.011, 0.019, 0.002, -0.006,
               0.016, 0.008, -0.014, 0.011, 0.004, -0.002, 0.017, -0.009,
               0.013, 0.006, -0.004, 0.010};
SPSRReport r1;
ComputePSR(v1, ArraySize(v1), 0.0, r1);
ComputeMinTRL(v1, ArraySize(v1), 0.0, 0.05, r1);

if(MathAbs(r1.sr - 0.420590718) < 1.0e-6)
   pass++;
else
  {
   fail++;
   PrintFormat("SelfTest FAIL: v1 SR = %.9f, expected 0.420590718", r1.sr);
  }
//--- five further checks against r1 (skew, kurt, PSR(0), MinTRL, PSR(SR*))
//--- bring v1's total to six, and three checks against a second, negatively
//--- skewed vector v2 follow the same pass/fail pattern; see PSRCore.mqh
//--- for the full block

PrintFormat("PSRCore RunSelfTest: %d passed, %d failed", pass, fail);
return(fail == 0);
Both the EA and the dashboard script call this before doing anything else, but I want to be precise about what "before doing anything else" actually buys you: a failure prints a warning to the Journal, it doesn't halt OnInit or block trading. That's a deliberate choice, not an oversight - a hard stop would be safer, but it would also silently prevent a broken build from telling you why. In practice, treat the warning as non-negotiable: if RunSelfTest() ever fails on your build, don't trust the PSR/MinTRL numbers that run produces, even though the EA will keep running and keep reporting them.
7. The Dashboard Script
PSRDashboard.mq5 is a standalone script for poking at history outside a Strategy Tester run - point it at a symbol, magic number and date range, and it prints the full report and draws two on-chart curves through CCanvas: PSR against a swept benchmark SR*, and PSR against a swept track length with the run's own SR/skew/kurtosis held fixed. That second curve is basically what MinTRL is solving for, drawn out - the n where the curve crosses your target confidence level:
double sr_star_obs = report.sr_star / MathSqrt(report.periods_per_year);
int n_max = MathMax(300, report.n * 3);
for(int i = 1; i <= steps; i++)
  {
   int n_i = 5 + (int)((double)i / steps * (n_max - 5));
   double denom = 1.0 - report.skew * report.sr +
                  ((report.kurt - 1.0) / 4.0) * report.sr * report.sr;
   if(denom <= 0.0)
      denom = 1.0e-12;
   double z = (report.sr - sr_star_obs) * MathSqrt(n_i - 1) / MathSqrt(denom);
   double psr_i = NormalCDF(z);
   //--- plot (n_i, psr_i), marking the run's own n with a vertical line
  }
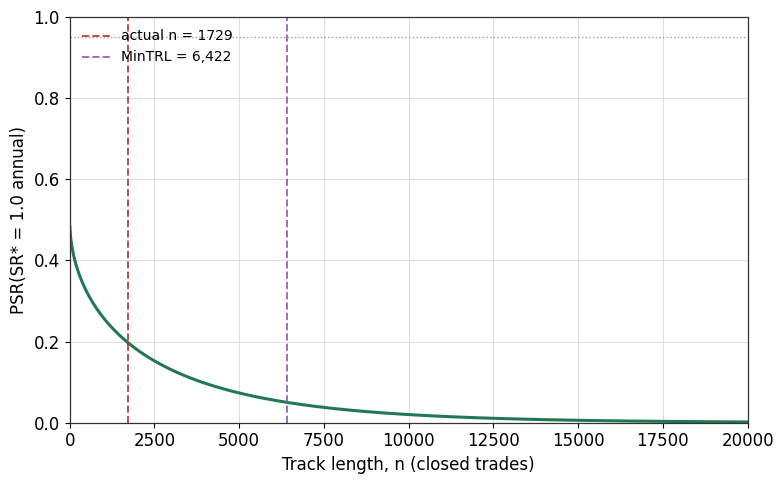
The canvas dashboard is handy for a quick look while developing, but it bakes text and gridlines straight into a bitmap the terminal owns, so it's not something I'd publish as an article figure. The version below is the same formula, run independently in Python against the real, already-validated XAUUSD M15 Donchian data, using the same trades-per-year scale ComputeTradesPerYear computes in section 3 - crisp at any size, and shows where the actual track length (n = 1729) sits relative to the solved-for n at PSR = 0.95 (about 6,406 trades). For this leg, SR sits below SR*, so that solved-for n is the confident-refutation reading from section 2, not a confirmation threshold - the table in section 8 walks through what that means for all twelve legs:
Fig. 2. PSR against track length, XAUUSD M15 Donchian, SR* = 1.0 annual.
8. Validation: Twelve Runs Across Three Symbols
Everything below is an in-sample demonstration of the workflow, not a claim to have found a tradable edge - worth saying plainly before the numbers, since a table this dense invites reading more into it than that. I crossed three symbols (EURUSD, GBPUSD, XAUUSD), two timeframes (M15, H1) and two entry modes (Donchian, Random) - twelve legs total, all run over the identical 2025.01.01–2026.08.31 window with real-tick modelling, on a MetaQuotes-Demo hedging account in USD, $10,000 initial deposit, 1:100 leverage.
Spread, commission and swap were the tester's defaults for that server rather than values I set myself: zero commission, standard overnight swap, and a variable spread that floats with the live demo feed rather than a fixed pip value - roughly 1.0-1.2 pips on EURUSD/GBPUSD and 20-30 cents on XAUUSD over the window, though "the server's own default at test time" is the honest answer rather than a single fixed figure I could paste here. Anyone rerunning this on a different broker, account currency or leverage should expect the raw P/L figures to shift somewhat even with identical EA parameters, since spread and commission feed directly into every trade's net return.
The EA parameters themselves were fixed demo defaults chosen for illustration, not tuned or validated by any sensitivity sweep: InpDonchianPeriod = 20, InpAtrPeriod = 14, InpAtrMultSL = 2.0, InpAtrMultTP = 3.0, InpRiskPercent = 1.0, InpRandomSeed = 12345, InpSRStarAnnual = 1.0, InpAlpha = 0.05, InpMagic = 990001. Here's what came back:
Two quick notes before the table, both covered in full earlier and kept short here on purpose. The scale: periods_per_year is each leg's own trades-per-year via ComputeTradesPerYear (section 3), the same procedure now running in the shipped code, not a separate formula kept only for this table. The direction: every leg's observed SR sits below its SR*_obs benchmark, so every MinTRL figure below is the confident-refutation reading from section 2 - years to rule SR* out, not years to confirm it.
| Symbol | TF | Mode | n | SR (obs) | skew | kurt | PSR(SR*=1.0) | MinTRL (yrs, refute) |
|---|---|---|---|---|---|---|---|---|
| EURUSD | M15 | Donchian | 1660 | -0.0632 | 0.498 | 1.398 | 0.0001 | 0.312 |
| EURUSD | M15 | Random | 1973 | -0.0384 | 0.498 | 1.467 | 0.0015 | 0.512 |
| EURUSD | H1 | Donchian | 438 | -0.0258 | 0.416 | 1.226 | 0.0345 | 1.363 |
| EURUSD | H1 | Random | 577 | -0.0655 | 0.489 | 1.339 | 0.0024 | 0.570 |
| GBPUSD | M15 | Donchian | 1661 | -0.1211 | 0.528 | 1.647 | 0.0000 | 0.125 |
| GBPUSD | M15 | Random | 2057 | -0.0756 | 0.548 | 1.836 | 0.0000 | 0.212 |
| GBPUSD | H1 | Donchian | 455 | -0.0046 | 0.366 | 1.178 | 0.0829 | 2.344 |
| GBPUSD | H1 | Random | 576 | 0.0014 | 0.404 | 1.195 | 0.1046 | 2.853 |
| XAUUSD | M15 | Donchian | 1729 | 0.0105 | 0.223 | 2.080 | 0.1965 | 6.168 |
| XAUUSD | M15 | Random | 2208 | -0.0425 | 0.366 | 2.566 | 0.0006 | 0.424 |
| XAUUSD | H1 | Donchian | 463 | -0.0053 | 0.380 | 1.462 | 0.0806 | 2.292 |
| XAUUSD | H1 | Random | 634 | -0.0173 | 0.487 | 1.619 | 0.0430 | 1.528 |
Notice every single leg comes back with positive skew, and kurtosis nowhere near the normal reference of 3 - it ranges 1.18 to 2.57, all under 3, because the ATR stop/target bracket chops the tails hard on both ends. That's worth pausing on, because PSR is usually motivated by negative skew and fat tails inflating the uncertainty around a sample Sharpe ratio, and this data has neither in the form the textbook case assumes - the positive skew and thin tails here come from a fixed-target, fixed-stop exit truncating the outcome distribution on both sides. The Mertens correction still does real work through the skew term, just not for the reason PSR is usually reached for.
A quick glance at the table invites the wrong reading on a few rows - a negative observed SR next to a small MinTRL isn't "barely any data needed to confirm the edge," it's the opposite (refutation reading, above): that leg's true Sharpe ratio can be ruled out below SR* = 1.0 relatively quickly.
No leg clears SR* = 1.0 with statistical confidence - that's the honest headline, and it's worth saying plainly rather than burying it in a column of numbers. XAUUSD M15 Donchian comes closest: PSR(SR*=1.0) = 0.1965 against an observed track length of 1729 trades, meaning there's roughly a one-in-five chance its true Sharpe ratio already clears 1.0 despite the sample sitting below it. That's also why it needs the longest refutation window of the twelve, about 6,406 trades (6.17 years at this leg's own pace) against 1.67 years actually logged - the closer SR sits to SR*, the longer it takes to confidently rule the benchmark out. A one-in-five chance is not nothing, but it's a long way from a confirmed edge, and ranking best among twelve candidates that were all tested at once makes it weaker evidence still, not stronger (section 9 has more on that multiple-testing problem).
Fig. 3. PSR(SR*=1.0 annual) across all twelve legs, Donchian versus random control.
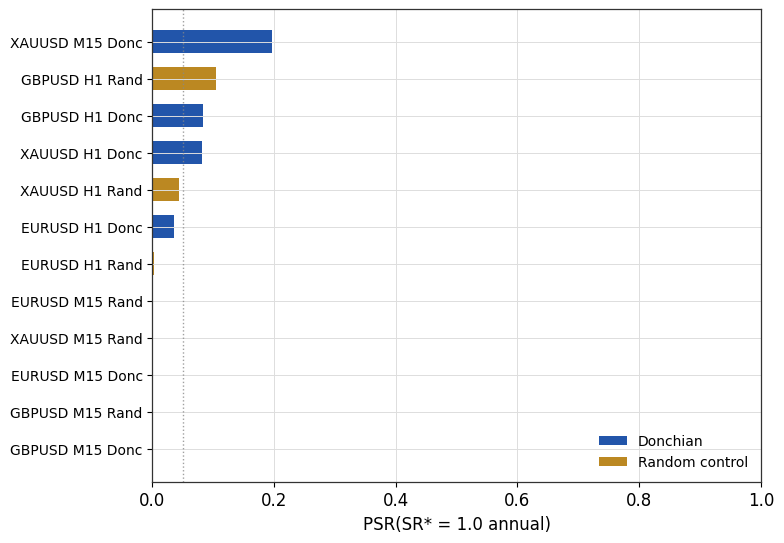
Fig. 4. MinTRL in years across all twelve legs, log scale.
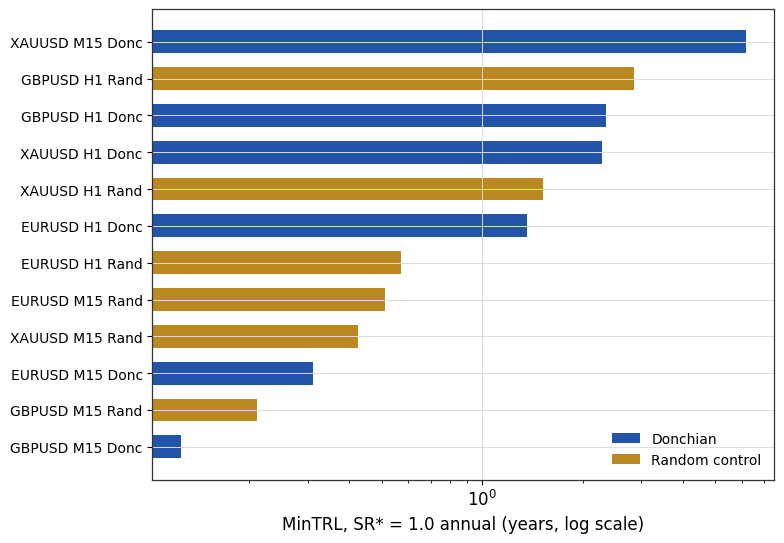
Figure 3 makes the Donchian-versus-random split visible, though less cleanly than I'd like: five of six Random legs sit under PSR = 0.05, while the Donchian legs spread out much wider, with some barely clearing the random floor and one (XAUUSD M15) well clear of the pack. I want to be careful about how I read that pattern, though. It isn't automatically "what a zero-edge system should look like" - a random entry trading real spread, commission and swap has a genuinely negative expectation, not a neutral one, so a low PSR here partly reflects trading costs rather than pure statistical noise around a true-zero edge. GBPUSD H1 Random is the one exception, landing at PSR = 0.1046, which is a reminder that a single random seed can land anywhere and isn't a stable baseline on its own.
Figure 4's log-scale bars put those MinTRL figures in years, and since every one of them is the confident-refutation reading, read the bar height as "how long before this leg's SR* = 1.0 underperformance can be called with confidence" rather than "how close to proving an edge." Most legs would need anywhere from a few weeks to a handful of years of additional data before that call could be made, and even the two slowest to resolve - GBPUSD H1 Random at roughly 2.85 years and XAUUSD M15 Donchian at roughly 6.17 years - are stretches of ordinary trading time, not the multi-decade timelines you'd get by mistakenly annualizing on bars per year instead of trades per year. It's no coincidence those two also carry the highest PSR values in Figure 3: the closer SR sits to SR*, the longer it takes to rule the benchmark out either way.
9. Limitations
PSR and MinTRL both lean on the assumption that returns are independent and identically distributed, and that's not really true here. Consecutive trades from the same breakout system aren't strictly independent - a channel breakout that keeps riding the same trend is going to produce serially correlated returns, which understates the true variance of the Sharpe-ratio estimator and makes PSR look more optimistic than it should. The skew/kurtosis correction is built off sample moments from anywhere between a few hundred and a couple thousand observations, and at the low end those estimates get noisy fast (EURUSD H1 and GBPUSD H1 are both under 600 observations per leg). And none of the twelve PSR values here are corrected for the fact that I tested twelve legs at once - run enough variations and one of them will eventually look good by pure chance. That's exactly what the Deflated Sharpe Ratio extension of this same framework is built to catch, and honestly it deserves its own article rather than a paragraph tacked onto this one.
Worth being upfront about something too: an earlier batch of test runs showed what looked like a ~10-12x jump in Random-mode trade counts, and my first guess was account-history leakage between successive Strategy Tester runs. So I added g_deal_baseline as a defensive fix. Rerunning the same settings afterward gave back n, SR, skew and kurtosis matching the first run to within the precision the Journal prints - consistent with the tester being deterministic and history not actually leaking, though I don't have a saved log from that specific rerun to reproduce here as an exhibit. The real explanation turned out to be much simpler: that first batch had been run on a much shorter ~65-day smoke-test window, before I corrected the date range to the full window used in every run reported in section 8. I'm keeping the baseline fix anyway as a reasonable precaution, but I want to be honest that it's defensive, not a fix for something that was actually broken; anyone who wants to confirm the determinism claim for themselves can rerun a leg twice and diff the two WriteReportCSV rows it appends.
Two quick pointers rather than full restatements, since both are covered in depth earlier. Every MinTRL figure in section 8's table is the confident-refutation reading, not a confirmation one (section 2 and the note before the table). And both PSRStrategy_EA.mq5 and PSRDashboard.mq5 derive the annualization scale from ComputeTradesPerYear (section 3) rather than a chart-timeframe lookup - keep using that function rather than a timeframe-based shortcut if you adapt either file for your own per-trade return series, whatever instrument or window you're testing.
10. Conclusion
A Sharpe ratio with no track-length check attached to it is only half a statistic, and I'd argue the more dangerous half. The code here turns raw MetaTrader deal history into PSR and MinTRL using nothing more exotic than two rational-function approximations and a moment calculation, checks that math against independently-computed reference values every time it starts up, and - because my own Donchian entry failed silently on an iHighest/iLowest mixup before I caught it - tests the trading logic against a random control instead of just trusting a clean-looking equity curve.
Twelve legs across three symbols show exactly what that combination is good for: not proving an edge, but ranking them honestly and showing that none of them beats SR* = 1.0 with statistical confidence, while the closest (XAUUSD M15 Donchian) is merely the hardest of the twelve to rule out - a PSR of 0.197 against SR* = 1.0, needing roughly 6.17 years before that underperformance could be called with confidence, against 1.67 years actually logged, and not yet corrected for the fact that it was picked as the best of twelve candidates.
That's a genuinely useful answer, and a much more modest one than "found an edge." If you take one thing from this article, let it be that PSR and MinTRL are built to stop you from mistaking the first kind of result for the second - and that the same formula can tell you either one, depending on which side of the benchmark your sample actually lands on.
| File | Type | Description |
|---|---|---|
| MQL5\Include\PSR_MinTRL\PSRCore.mqh | Include | PSR and MinTRL formulas, the sign-aware confirm/refute flag on MinTRL, the trades-per-year helper, the NormalCDF/NormalQuantile rational approximations, moment calculation, and the 28-check self-test run from both the EA and the dashboard script. |
| MQL5\Experts\PSR_MinTRL\PSRStrategy_EA.mq5 | Expert Advisor | Donchian/random entry pair sharing one risk and exit model, builds its own per-trade return series from deal history, derives its own trades-per-year from that same history, and appends a PSR/MinTRL report to CSV in OnDeinit. |
| MQL5\Scripts\PSR_MinTRL\PSRDashboard.mq5 | Script | Standalone script that points at a symbol, magic number and date range, derives trades-per-year from that same deal history (the same procedure the EA uses), prints the full PSR/MinTRL report, and draws the two on-chart curves through CCanvas. |
| MQL5.zip | Archive | Archive with all three files above, rooted at MQL5\ so it can be unpacked directly into the terminal's data folder (File > Open Data Folder) - each file lands in its correct subfolder under Include, Experts and Scripts. |
Warning: All rights to these materials are reserved by MetaQuotes Ltd. Copying or reprinting of these materials in whole or in part is prohibited.
This article was written by a user of the site and reflects their personal views. MetaQuotes Ltd is not responsible for the accuracy of the information presented, nor for any consequences resulting from the use of the solutions, strategies or recommendations described.


