

Per-Setup Trade Ledger in MQL5: Find Out Which of Your EA's Entries Is Losing Money
 205
 0

Contents
- Introduction
- Why two setups drift apart
- Putting the setup Id in the magic number
- Reading the history correctly
- The account history is the database
- Why the raw win rate lies
- Wiring it into an EA
- Results
- Limitations
- What comes next
- Conclusion
- References
- Attached files
Introduction
I ran my liquidity-sweep scalper over eight months of USDCAD M1, from the first of January to early September. It closed 1,365 trades and gave back roughly two-thirds of a 10,000 USD account. The Strategy Tester summed it up in one line: profit factor 0.88, net loss 6,838.22 USD.
That line is true and almost useless. The EA trades two setups, a bullish order block after a swing low gets swept and the mirror image of it on the sell side. Same entry code, same risk model, same magic number, so as far as the tester is concerned it is one system. It isn't. When I finally split the trades by setup, 82% of the loss came from the bullish side alone. The bearish side lost money too, but less than a quarter as much. I had spent two weeks optimizing inputs that applied to both.
That is what this article fixes. CSetupLedger is a small class that keeps a separate record for every setup type in an EA. It rebuilds itself from the account's own deal history, so a restart or a deleted file doesn't wipe the record. Next to the raw win rate it prints a Wilson score interval, which answers the question I kept asking during testing: has this win rate earned any trust yet, or is it still three lucky trades? Then it compares that interval with the breakeven win rate implied by the setup's own wins and losses. How often a setup wins does not tell you, on its own, whether its trades were worth taking. What comes back is one of four short answers instead of a percentage you have to interpret: too few trades, undecided, trusted or rejected.Everything below comes out of code that runs, and the files are attached at the end of the article.
Why two setups drift apart
Take an EA with two entries. One buys the bullish sweep, one sells the bearish sweep. In the source file they look symmetrical, and in mine they are. The sell branch is the buy branch with the comparisons flipped.
The market has no reason to be. In a pair that spent the year drifting one way, one of those entries trades with the drift and the other leans against it. The spread is the same on both sides but the stops are not, so it eats a different share of each. That is a list of ways two mirror-image setups can end up with different results, not a claim about which one applies to mine. The account report never gets that far. It adds the two up and shows you one number that averages an edge with a leak, and describes neither.
The M15 run in the results section is exactly that situation: two setups, 131 trades, profit factor 1.00, net result 2.12 USD on a 10,000 USD account. Eight months of trading to move the balance by 0.02%. On its own I would file that under noise and move on. Split by setup it is +150.65 on one side and -148.53 on the other, and now there is something to work with.
Putting the setup Id in the magic number
Before anything can be scored, the trade record has to remember which setup opened it. There are two places to write that tag and only one of them survives.
The obvious one is the order comment. It's a string, you control it, and it shows up in the history. It is still the wrong choice. The documentation only calls it "order comment" and never promises to keep it intact, and in practice brokers overwrite it: a stop-out often comes back with so:, and plenty of brokers replace the whole comment with [sl] or [tp] when the stop or target fires. So the tag goes missing precisely on the trades that lost, which are the ones the statistics need most.
The magic number is the field MQL5 gives you for this job, and nothing in the broker's fill or stop-out handling rewrites it. That alone does not make it safe. Nothing stops a second EA, or an older version of this one, from using the same range and writing into the same record. What the field gives you is a place the broker leaves alone, not protection from your own bookkeeping.
The encoding is about as plain as it gets. One base value, one Id added on top:
//+------------------------------------------------------------------+
//| MagicFor                                                         |
//| Magic number a setup trades under                                |
//+------------------------------------------------------------------+
long CSetupLedger::MagicFor(const int setupId) const
  {
   return m_magicBase + (long)setupId;
  }

//+------------------------------------------------------------------+
//| SetupFromMagic                                                   |
//| Decode a magic number back to a setup id. Returns -1 when the    |
//| magic does not belong to this EA.                                |
//+------------------------------------------------------------------+
int CSetupLedger::SetupFromMagic(const long magic) const
  {
   long offset = magic - m_magicBase;
   if(offset < 0 || offset >= (long)m_count)
      return -1;
   return (int)offset;
  }
In the scalper, whose magic base input is 552001, the bullish setup trades on 552001 and the bearish one on 552002. The demo EA does the same thing from a base of 772001, so the two can run on one account without ever being confused for each other. SetupFromMagic() returns -1 for anything outside the registered range, which is what keeps another EA's trades, or a trade you opened by hand, out of your numbers. Every read of the history goes through this function first.
Setups register themselves at startup and get their Id back:
ledger.Init(InpMagicBase, _Symbol);
SETUP_RSI_BOUNCE = ledger.Register("RSI Bounce");
SETUP_MA_CROSS   = ledger.Register("MA Cross");
SETUP_BREAKOUT   = ledger.Register("Breakout");
There is a consequence here that is easy to miss, and it is the one thing in this article that will hurt you if you get it wrong. Registration order is a data format. The Id lives nowhere except inside the magic numbers of trades that have already closed. Insert a new setup at position 1 next month and every old trade belonging to the previous setup 1 quietly becomes a trade of the new one. Nothing throws an error. The numbers are simply wrong from then on.
So new setups go at the end of the list, and if you retire a setup, leave its Register() call where it is so the Id stays taken. A three-line comment above the registration block explaining this earns its keep.
The base needs the same discipline one level up. Treat it as a namespace: one base per EA, a gap above it for the setups you have not written yet, and a new base when a rewrite changes what a setup actually means, so trades taken under the old definition are not folded into the new one. Init() also takes the chart symbol, and the rebuild skips history from anything else, which stops one base from mixing EURUSD trades into a USDCAD record. It cannot separate timeframes or EA versions for you. That part stays manual.
Writing the tag onto the trade is one line before the order goes out:
trade.SetExpertMagicNumber((ulong)ledger.MagicFor(setupId)); Reading the history correctly
This is where hand-rolled statistics code usually goes wrong. There are three traps and none of them announce themselves.
Trap 1: deals are not trades
MetaTrader 5 history is a list of deals, not a list of trades. A position closed in three parts produces three OUT deals. Loop over deals, count every profitable one as a win, and a single winning trade shows up as three wins. If your EA scales out, the win rate it prints is fiction. The entry side behaves the same way: an order filled in pieces leaves several IN deals behind, all carrying one position Id.
The unit of a trade is the position, keyed by DEAL_POSITION_ID, and every deal belonging to it has to be summed back into one result:
//+------------------------------------------------------------------+
//| ProcessClosedPosition                                            |
//|                                                                  |
//| Score one closed position and fold it into the ledger. Every deal|
//| belonging to the position is summed, so a partially closed trade |
//| collapses back into a single result instead of counting as       |
//| several.                                                         |
//|                                                                  |
//| Pass setupId = -1 to recover the setup from the entry deal's     |
//| magic number. Returns false if the position is still open or does|
//| not belong to this EA.                                           |
//+------------------------------------------------------------------+
bool CSetupLedger::ProcessClosedPosition(const long positionId,
                                         const int setupId,
                                         double &net)
  {
   net = 0.0;
   if(positionId == 0)
      return false;
   if(!HistorySelectByPosition(positionId))
      return false;

   int  sid    = setupId;   // setup id, -1 until the entry deal is read
   bool closed = false;     // true once an OUT deal is found

   //--- sum every deal of the position
   int dealsInPos = HistoryDealsTotal();
   for(int j = 0; j < dealsInPos; j++)
     {
      ulong dd = HistoryDealGetTicket(j);
      if(dd == 0)
         continue;

      net += HistoryDealGetDouble(dd, DEAL_PROFIT)
           + HistoryDealGetDouble(dd, DEAL_SWAP)
           + HistoryDealGetDouble(dd, DEAL_COMMISSION);

      long entry = HistoryDealGetInteger(dd, DEAL_ENTRY);

      if(entry == DEAL_ENTRY_IN && sid < 0)
         sid = SetupFromMagic(HistoryDealGetInteger(dd, DEAL_MAGIC));

      if(entry == DEAL_ENTRY_OUT || entry == DEAL_ENTRY_OUT_BY)
         closed = true;
     }

   //--- an open position, or one that is not ours, is not scored
   if(!closed || sid < 0)
      return false;

   Record(sid, net);
   return true;
  }
The closed flag matters more than it looks. Without it, a position that so far only has an entry deal would be scored the first time it is seen, as a loss of zero.
Trap 2: DEAL_PROFIT is not the result
DEAL_PROFIT is the raw price result. Swap and commission sit in separate fields. On a swing EA with wide targets the commission hardly moves the result, although the swap does. On a scalper whose target is a few pips, the commission can decide whether a trade won at all. A trade that made 3 USD of price movement and paid 4 USD in commission is a losing trade, and a ledger that scores it as a win is flattering you.
net above is profit plus swap plus commission. Commission already comes back negative, so it is added rather than subtracted.
Trap 3: POSITION_TICKET is not POSITION_IDENTIFIER
HistorySelectByPosition() expects a position identifier, and the identifier is what every deal carries in DEAL_POSITION_ID. POSITION_TICKET is a different property that usually holds the same number, which is why an earlier version of my scalper passed the ticket for months without anything looking broken. The documentation is specific about when the two come apart. The ticket is replaced when the server re-opens a position as part of a service operation, and charging swap is the most common one. On a netting reversal the ticket becomes that of the reversing order, while the identifier stays with the position.The identifier is the value the history is indexed by, so it is the one to pass.
There is no PositionSelectByIdentifier() in the language, so checking whether a tracked position is still open means walking the open list:
//+------------------------------------------------------------------+
//| IsPositionOpenById                                               |
//| There is no PositionSelectByIdentifier(), so this walks the list.|
//+------------------------------------------------------------------+
bool IsPositionOpenById(const long posId)
  {
   for(int i = PositionsTotal() - 1; i >= 0; i--)
     {
      if(PositionGetTicket(i) == 0)
         continue;
      if(PositionGetInteger(POSITION_IDENTIFIER) == posId)
         return true;
     }
   return false;
  }
It is O(open positions), and that is a handful of iterations. I would rather have the slow version that is right.
The account history is the database
The first version of this scorecard in the scalper was four global counters. They started at zero on every OnInit(). Restart the terminal, change one input, or let the EA reload after a weekend and the whole record was gone, and gone in a way nobody notices, because the panel just says 0/0 and you assume it is a fresh start.
Writing those counters to a file fixes the restart. It does not fix the file being deleted, the EA being moved to a second terminal, or a trade you closed by hand from your phone.
The account already stores every one of those events. So the ledger keeps no state that it cannot rebuild:
//+------------------------------------------------------------------+
//| RebuildFromHistory                                               |
//|                                                                  |
//| Rebuild the whole ledger from the account's deal history.        |
//| Pass 1 finds every position this EA opened, via the entry deal's |
//| magic number, and keeps each position id once. A partially filled|
//| entry produces several DEAL_ENTRY_IN deals carrying the same     |
//| DEAL_POSITION_ID, and without that check the position would be   |
//| scored once per fill.                                            |
//| Pass 2 scores each of them.                                      |
//+------------------------------------------------------------------+
void CSetupLedger::RebuildFromHistory(void)
  {
   Reset();

   if(!HistorySelect(0, TimeCurrent()))
     {
      Print("CSetupLedger: HistorySelect() failed, ledger left empty.");
      return;
     }

   long posIds[];     // position ids found in pass 1
   int  posSetup[];   // setup id of each of them
   int  n = 0;        // number of positions found

   //--- pass 1: collect the positions this EA opened
   int total = HistoryDealsTotal();
   for(int i = 0; i < total; i++)
     {
      ulong d = HistoryDealGetTicket(i);
      if(d == 0)
         continue;

      //--- only the entry deal tells us which setup opened this position
      if(HistoryDealGetInteger(d, DEAL_ENTRY) != DEAL_ENTRY_IN)
         continue;

      //--- trades this magic base made on another symbol are not ours
      if(m_symbol != "" && HistoryDealGetString(d, DEAL_SYMBOL) != m_symbol)
         continue;

      int sid = SetupFromMagic(HistoryDealGetInteger(d, DEAL_MAGIC));
      if(sid < 0)
         continue;

      long pid = HistoryDealGetInteger(d, DEAL_POSITION_ID);
      if(pid == 0)
         continue;

      bool known = false;
      for(int k = 0; k < n && !known; k++)
         if(posIds[k] == pid)
            known = true;
      if(known)
         continue;   // another fill of an entry we already have

      ArrayResize(posIds,   n + 1);
      ArrayResize(posSetup, n + 1);
      posIds[n]   = pid;
      posSetup[n] = sid;
      n++;
     }

   //--- pass 2: score each position
   for(int k = 0; k < n; k++)
     {
      double net = 0.0;
      ProcessClosedPosition(posIds[k], posSetup[k], net);
     }

   //--- leave the global history selection in a sane state for the caller
   HistorySelect(0, TimeCurrent());
  }
Two filters sit in pass one and both earn their place. History from another symbol is dropped, because a magic base does not stop the same EA on a second chart from writing into the same account history. And a position Id is collected once, however many entry deals carry it. An order filled in three pieces leaves three IN deals behind, and without that check the position would be scored three times, which is trap 1 arriving from the entry side. The rebuild uses two passes because ProcessClosedPosition() calls HistorySelectByPosition().
That call replaces the global history selection, so iterating a full selection while calling it would pull the array out from under the loop. Pass one collects position IDs and setup IDs into local arrays, and pass two scores them. At the end the full selection is restored for whatever the caller does next.If you extend the class, keep that side effect in mind. It isn't a bug today because both callers expect it, but it is the kind of thing that breaks later in a way that takes an afternoon to find.
This runs in OnInit(), and once more in OnDeinit(). Nothing rebuilds while the EA is trading; a closed position is folded in one at a time, so the per-trade cost stays flat however long the account history gets.
The rebuild in OnDeinit() is there because of the tester. If a position is still open when a test ends, the tester closes it after the EA's last trade event. No handler ever scores that close, so without the rebuild the final block misses the tester's net by exactly that trade.
My first run of the demo EA did.
Why the raw win rate lies
Three wins out of three is a 100% win rate. It is also something a coin that lands heads 44% of the time manages about one attempt in twelve. Any statistic computed on a small sample is mostly noise, and a per-setup ledger creates small samples on purpose, by splitting one sample into several.
So next to the raw rate the class reports a Wilson score interval. The question it answers is a practical one: given this record, which true win rates are still consistent with it at 95% confidence? The lower bound is the pessimistic end of that range and the upper bound is the optimistic one, and both ends are useful. One stops you trusting a setup too early, the other tells you when the evidence has turned against it.
//+------------------------------------------------------------------+
//| WilsonBound                                                      |
//|                                                                  |
//| Wilson score interval. Three wins out of three is a 100% raw win |
//| rate and means nothing. The bounds answer a better question:     |
//| which true win rates are still consistent with this record at the|
//| given confidence level? Small samples get a wide interval. Large |
//| samples get a narrow one.                                        |
//+------------------------------------------------------------------+
double CSetupLedger::WilsonBound(const int setupId, const double z,
                                 const bool upper) const
  {
   int total = Total(setupId);
   if(total <= 0)
      return upper ? 1.0 : 0.0;

   double p  = (double)Wins(setupId) / (double)total;   // raw win rate
   double z2 = z * z;

   double centre = p + z2 / (2.0 * total);
   double margin = z * MathSqrt(p * (1.0 - p) / total + z2 / (4.0 * total * total));
   double denom  = 1.0 + z2 / total;

   double bound = (upper ? (centre + margin) : (centre - margin)) / denom;

   //--- keep the bound inside 0..1
   if(bound < 0.0) bound = 0.0;
   if(bound > 1.0) bound = 1.0;
   return bound;
  }
WilsonLower() and WilsonUpper() are one-line wrappers around it. The z argument defaults to 1.96 in the class declaration, so the 95% case needs no extra parameter at the call site.
I used Wilson rather than the textbook normal approximation because the normal one falls apart at exactly the values that matter here. At 3 wins from 3 trades it produces an interval of zero width around 100%, an answer that is plainly nonsense. Wilson stays sensible at the extremes and at small counts, which is most of what a fresh ledger contains.
The four rows below are illustrations, not my data:
| W/L | Raw win rate | Wilson interval (95%) | What it means |
|---|---|---|---|
| 3/0 | 100% | 43.8% to 100% | The record rules out almost nothing |
| 8/2 | 80% | 49.0% to 94.3% | Still mostly a guess |
| 24/6 | 80% | 62.7% to 90.5% | Same raw rate, three times the evidence |
| 47/39 | 54.7% | 44.2% to 64.7% | Boring, and the most solid row in the table |
Rows two and three have the same raw win rate and should not be read the same way. The width of the interval is what stops you. The first row is the clearest case: three wins from three trades leaves a range wide enough to include a coin that comes up heads 44% of the time, which is why the raw 100% deserves no weight at all.
Turning a percentage into a verdict
A win rate on its own is not a decision. 35% is excellent at 1:3 reward-to-risk and a slow death at 1:1. The breakeven rate falls straight out of the reward ratio:
//--- breakeven win rate for a nominal reward ratio
static double BreakevenWinRate(const double rewardRatio)
  { return (rewardRatio <= 0.0) ? 1.0 : 1.0 / (1.0 + rewardRatio); }
At 1:2 that is 33.3%, at 1:1 it is 50%, at 1:3 it is 25%.
That formula was the first version of the test, and it has a hole in it. The ratio it uses is the one you asked for in the inputs, not the one the account paid out. A 2R target is not 2R once spread, slippage and commission have been taken off it, and a stop that is really hit at the worst price inside a spike is not 1R either. Judge a setup against the nominal ratio and you are grading it against a trade it never actually took.
The ledger already has the real version of that number, because it sums the winning nets and the losing nets separately as trades come in. Divide each by its count and you have the average win and the average loss the account really saw, commission and swap included:
//+------------------------------------------------------------------+
//| RealisedReward                                                   |
//| Reward-to-risk as the closed trades actually came out, not the   |
//| ratio the EA aimed for. Returns 0 until the setup has at least   |
//| one win and one loss.                                            |
//+------------------------------------------------------------------+
double CSetupLedger::RealisedReward(const int setupId) const
  {
   double avgLoss = AvgLoss(setupId);
   if(avgLoss <= 0.0) return 0.0;
   return AvgWin(setupId) / avgLoss;
  }

//+------------------------------------------------------------------+
//| BreakevenFor                                                     |
//|                                                                  |
//| The win rate this setup has to clear to break even. Once the     |
//| setup has both a win and a loss on record, the ratio of its own  |
//| averages is used, so spread, slippage and commission are already |
//| priced in. Before that there is nothing to measure, so the       |
//| nominal ratio from the EA inputs stands in.                      |
//+------------------------------------------------------------------+
double CSetupLedger::BreakevenFor(const int setupId,
                                  const double nominalRatio) const
  {
   double realised = RealisedReward(setupId);
   if(realised > 0.0)
      return 1.0 / (1.0 + realised);
   return BreakevenWinRate(nominalRatio);
  }
Until a setup has both a win and a loss on record there is nothing to measure, so the nominal ratio stands in. After that the bar moves to whatever the setup is actually achieving. A setup running at 1:1.2 in practice needs 45.5% to break even, not the 33.3% its 1:2 input suggested.
The verdict then compares the interval against that bar, but only once the setup has enough closed trades behind it:
//+------------------------------------------------------------------+
//| Verdict                                                          |
//|                                                                  |
//| Below the minimum sample there is no verdict at all. Above it:   |
//|   the whole interval above breakeven   -> trusted                |
//|   the whole interval below breakeven   -> rejected               |
//|   breakeven inside the interval        -> undecided              |
//+------------------------------------------------------------------+
ENUM_SETUP_VERDICT CSetupLedger::Verdict(const int setupId,
                                         const double nominalRatio,
                                         const double z) const
  {
   int total = Total(setupId);
   if(total <= 0)
      return SETUP_NO_DATA;
   if(total < m_minTrades)
      return SETUP_TOO_FEW;

   double breakeven = BreakevenFor(setupId, nominalRatio);

   if(WilsonLower(setupId, z) > breakeven)
      return SETUP_TRUSTED;
   if(WilsonUpper(setupId, z) < breakeven)
      return SETUP_REJECTED;
   return SETUP_UNDECIDED;
  }
My first version had two answers, trusted and not trusted, and the second one covered too much. Twenty trades that have not proved anything yet, several hundred trades that still sit on the fence, and several hundred trades that have proved the setup does not clear its own bar all printed the same words, and they call for different reactions. They now read as too few trades, undecided and rejected. IsTrusted() is still there and still returns a boolean, because an EA gating entries only cares about one of the answers.
The minimum is 30 closed trades unless you change it with SetMinTrades(). I added it after reading my own logs. Without it, the M15 run marked the bullish setup trusted after two trades, both winners, because the Wilson lower bound for two wins from two is 34.2% and the bar before the first loss is the nominal 33.3%. Once a setup is past the minimum, almost everything reads undecided for a long time, which is the right answer, and it annoyed me for about a week before I accepted it.
The minimum only deals with tiny samples, not with streaks. In all five M1 runs the bearish setup read trusted on 23 January, at 16 wins from 31 trades, and the loss that followed took it straight back to undecided. In two of the runs it happened again four days later, at 20 wins from 41. By the end of the test the same setup had lost between 991 and 1,346 USD, depending on the run. If you check the verdict after every close,a short winning streak can push a marginal setup over the line for a trade or two. The bound makes that harder, not impossible, and an EA that acts on the verdict should use a stricter z or only look at fixed checkpoints.
One compromise is buried in Record(): a net result of exactly zero counts as a loss, because the test is net > 0.0. That is a judgement call. Scratch trades are rare, and if I am going to be wrong about them I would rather be wrong in the pessimistic direction.
Wiring it into an EA
The demo EA registers three setups that have nothing to do with each other: an RSI bounce out of oversold, an EMA cross in both directions, and a close outside the last N bars. The entry rules are plain on purpose. They exist to produce three different streams of trades, not to make money.
The ledger part of OnInit() is six lines. The second argument to Init() is the chart symbol, which is what the history filter above compares against:
ledger.Init(InpMagicBase, _Symbol);
SETUP_RSI_BOUNCE = ledger.Register("RSI Bounce");
SETUP_MA_CROSS   = ledger.Register("MA Cross");
SETUP_BREAKOUT   = ledger.Register("Breakout");

//--- the account history is the record, so a restart or an input
//--- change no longer wipes it
ledger.RebuildFromHistory();
Print(ledger.Report(InpRewardRatio));
An EA can also be attached while one of its own positions is already open, which is normal after a restart. Adopting that position back takes a few more lines:
//--- adopt a position that was already open before this init
if(PositionSelect(_Symbol))
  {
   int sid = ledger.SetupFromMagic(PositionGetInteger(POSITION_MAGIC));
   if(sid >= 0)
      g_activePositionId = PositionGetInteger(POSITION_IDENTIFIER);
  }
Scoring the close
There are two ways to notice that a position has closed, and the two attached EAs use one each.
The demo EA uses OnTradeTransaction(), which fires the moment the deal lands:
//+------------------------------------------------------------------+
//| TradeTransaction function                                        |
//| Score a position the moment it is fully closed.                  |
//+------------------------------------------------------------------+
void OnTradeTransaction(const MqlTradeTransaction &trans,
                        const MqlTradeRequest     &request,
                        const MqlTradeResult      &result)
  {
   //--- only a closing deal of our own position is of interest
   if(trans.type != TRADE_TRANSACTION_DEAL_ADD || trans.deal == 0)
      return;
   if(!HistoryDealSelect(trans.deal))
      return;

   long entry = HistoryDealGetInteger(trans.deal, DEAL_ENTRY);
   if(entry != DEAL_ENTRY_OUT && entry != DEAL_ENTRY_OUT_BY)
      return;

   long posId = HistoryDealGetInteger(trans.deal, DEAL_POSITION_ID);
   if(posId == 0 || posId != g_activePositionId)
      return;

   //--- a partial close sends an OUT deal and leaves the position
   //--- open. Wait until the position is gone, then score it once.
   if(IsPositionOpenById(posId))
      return;

   int sid = ledger.SetupFromMagic(HistoryDealGetInteger(trans.deal, DEAL_MAGIC));
   if(sid < 0)
      sid = SetupOfPosition(posId);   // the entry deal always has the right magic
   if(sid < 0)
      return;

   //--- score it and show the new record
   double net = 0.0;
   if(ledger.ProcessClosedPosition(posId, sid, net))
     {
      PrintFormat("%s closed: net %.2f -> %s",
                  ledger.Name(sid), net, (net > 0.0) ? "WIN" : "LOSS");
      Print(ledger.Report(InpRewardRatio));
      ShowPanel();
     }

   g_activePositionId = 0;
  }
The IsPositionOpenById() guard in the middle is the line to pay attention to. A partial close raises DEAL_ENTRY_OUT and leaves the position open, so scoring it there lets one trade enter the ledger several times, which is trap 1 coming back in through a different door.
The scalper takes the other route and checks on each new bar:
//+------------------------------------------------------------------+
//| ManageOpenPosition                                               |
//| Check whether our open position has closed, and score it         |
//+------------------------------------------------------------------+
void ManageOpenPosition()
  {
   if(g_activePositionId == 0)
      return;
   if(IsPositionOpenById(g_activePositionId))
      return;   // still open

   //--- fold this one position into the ledger. every deal belonging
   //--- to it is summed, so a partial close counts as one trade and
   //--- the result includes swap and commission, not just profit.
   double net = 0.0;
   if(ledger.ProcessClosedPosition(g_activePositionId, g_activeSetupId, net))
     {
      bool win = net > 0.0;

      PrintFormat("Setup closed: %s  net %.2f -> %s",
                  ledger.Name(g_activeSetupId), net, win ? "WIN" : "LOSS");
      PrintStats();
      UpdateSetupLabel(win);
     }

   //--- forget the trade, the next setup can be evaluated
   g_activePositionId = 0;
   g_activeSetupId    = -1;
   g_activeRectName   = "";
   g_activeLabelName  = "";
  }
Polling is simpler and it survives a missed event. The cost is that the scorecard updates one bar late, and on M15 I have never cared. If you want the panel to react instantly, use the transaction handler.
The scorecard
Report() builds one block of text that works as a Print() and as a Comment():
//+------------------------------------------------------------------+
//| Report                                                           |
//|                                                                  |
//| Two lines per setup. The first line is the frequency question,   |
//| the second is the money question, and the verdict needs both.    |
//+------------------------------------------------------------------+
string CSetupLedger::Report(const double nominalRatio) const
  {
   string s = StringFormat("Per-setup ledger  (95%% Wilson interval, nominal reward 1:%.1f)\n",
                           nominalRatio);
   s += "---------------------------------------------------------------------\n";

   for(int i = 0; i < m_count; i++)
     {
      ENUM_SETUP_VERDICT v = Verdict(i, nominalRatio);

      //--- line 1: how often the setup wins, and the verdict
      s += StringFormat("%-14s %3d/%-3d  raw %5.1f%%  wilson %4.1f-%4.1f%%  %s\n",
                        m_stats[i].name,
                        Wins(i), Losses(i),
                        RawWinRate(i) * 100.0,
                        WilsonLower(i) * 100.0,
                        WilsonUpper(i) * 100.0,
                        VerdictText(v));

      double realised = RealisedReward(i);
      string rrText   = (realised > 0.0) ? StringFormat("1:%.2f", realised) : "n/a";

      //--- line 2: what the wins and losses were worth
      s += StringFormat("               net %9.2f  per trade %7.2f  realised %s  breakeven %5.1f%%\n",
                        NetProfit(i),
                        Expectancy(i),
                        rrText,
                        BreakevenFor(i, nominalRatio) * 100.0);
     }
   return s;
  }
Two lines per setup, because the two questions are separate. The first line is how often the setup wins and how sure of that you can be. The second is what those wins were worth, what a trade is worth on average, and where the bar sits for this setup. Printed after every close it leaves a running record in the journal. Passed to Comment() it sits in the chart corner during a visual test.
The scalper goes one step further and writes the setup's prior record onto the chart at the moment of entry, then appends the outcome when the trade closes:
text = StringFormat("%s | prior %d/%d  raw %.0f%%  wilson %.0f%%",
                    ledger.Name(setupId), wins, total, rawPct, wilPct);
Reading a chart back afterwards, each box tells you what the EA knew before it committed, not after.
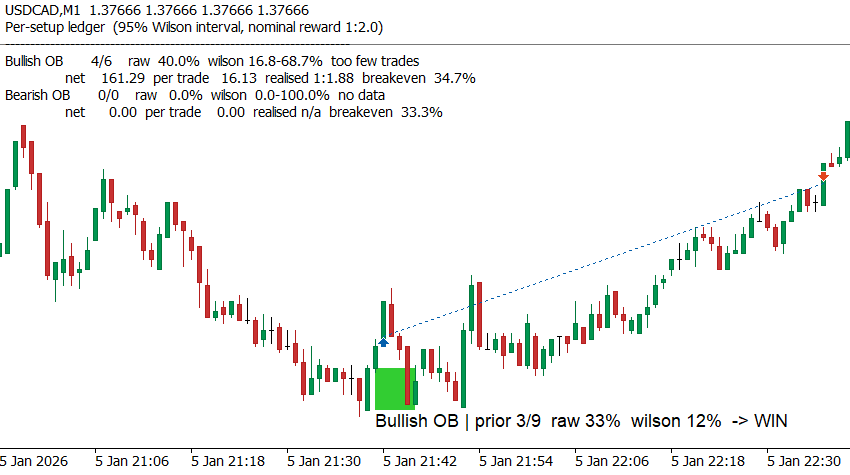
Fig. 1. Ledger panel in the chart corner and the entry label under the order block, USDCAD M1 visual test
The two readouts use different formats, so check which is which before you read your own. The panel in the corner comes from Report(), and the first figure on each line is wins/losses. The label on the chart comes from the snippet above and prints wins/total, so the same setup can read 4/6 in the corner and 3/9 on the label without either being wrong. Before this entry the bullish setup stood at three wins from nine trades, a raw rate of 33% against a Wilson lower bound of 12%. The trade won, and the panel now reads 4/6: four wins, six losses. Ten trades is nowhere near enough to say anything, and the panel says so. The interval runs from 16.8% to 68.7%, which covers both a setup I should drop and one I should double, and ten is below the 30-trade minimum, so the verdict column reads too few trades.
Results
The scalper
I ran the scalper in the Strategy Tester on USDCAD M15 from 2026.01.01 to 2026.09.10: every tick with random delay, 10,000 USD starting balance, leverage 1:100, 1% risk per trade, 1:2 reward ratio. Both the tester's own statistics and the final ledger were printed to the journal, from OnTester() and OnDeinit() respectively.
Random delay means no two runs fill at quite the same prices, so I ran each test five times and report the first run in full. Where the other four matter, I say so.
The account-level view:
| Metric | Value |
|---|---|
| Bars/ticks | 17,151/21,410,204 |
| History quality | 100% |
| Initial deposit | 10,000.00 USD |
| Trades | 131 |
| Total net profit | +2.12 USD |
| Gross profit | 10,076.04 USD |
| Gross loss | -10,073.92 USD |
| Profit factor | 1.00 |
| Expected payoff | 0.02 USD |
| Recovery factor | 0.00 |
| Sharpe ratio | 0.00 |
| Equity drawdown maximal | 2,203.24 USD (18.38%) |
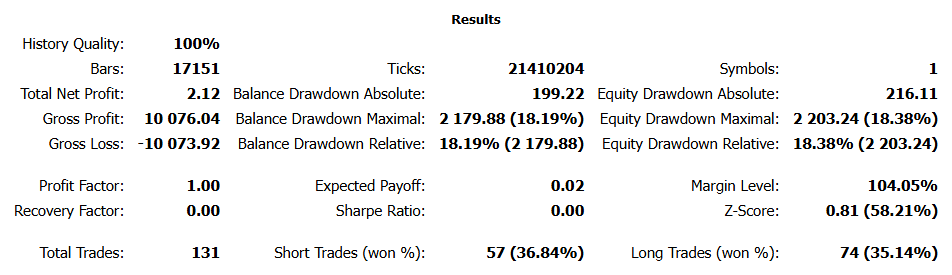
Fig. 2. Results section of the Strategy Tester report, USDCAD M15, run 1
A profit factor of 1.00 is about as close to nothing as a backtest can report. The EA moved a 10,000 USD balance by 2.12 USD over eight months and risked nearly a fifth of the account to do it. On those numbers alone there is nothing here.
The ledger's view of the same 131 trades, as OnDeinit() printed it to the journal:
Per-setup ledger  (95% Wilson interval, nominal reward 1:2.0)
---------------------------------------------------------------------
Bullish OB      26/48   raw  35.1%  wilson 25.2-46.5%  undecided
               net    150.65  per trade    2.04  realised 1:1.90  breakeven  34.5%
Bearish OB      21/36   raw  36.8%  wilson 25.5-49.8%  undecided
               net   -148.53  per trade   -2.61  realised 1:1.66  breakeven  37.6%
The same numbers as tables, with a row for the whole EA added. The ledger does not print that row; I worked it out from the same 131 closed positions, using the same formulas.
How often each side won:
| Setup | W / L | Trades | Raw win rate | Wilson interval (95%) |
|---|---|---|---|---|
| Bullish OB | 26/48 | 74 | 35.1% | 25.2% to 46.5% |
| Bearish OB | 21/36 | 57 | 36.8% | 25.5% to 49.8% |
| Whole EA | 47/84 | 131 | 35.9% | 28.2% to 44.4% |
What those wins were worth:
| Setup | Net (USD) | Per trade (USD) | Realized reward | Breakeven | Verdict |
|---|---|---|---|---|---|
| Bullish OB | +150.65 | +2.04 | 1:1.90 | 34.5% | undecided |
| Bearish OB | -148.53 | -2.61 | 1:1.66 | 37.6% | undecided |
| Whole EA | +2.12 | +0.02 | 1:1.79 | 35.9% | undecided |
Run the cross-check before you believe any ledger, mine included. 74 + 57 = 131, the tester's trade count, and the tester's own long/short split is 74 and 57 as well. 150.65 - 148.53 = 2.12 USD, the tester's net profit to the cent. If those two lines do not reconcile, the ledger is miscounting positions somewhere and every percentage above them is worthless.
Three things come out of the split.
The two setups are not one trade and its mirror image. One made money, the other lost very nearly the same amount, and between them they canceled out. Their raw win rates are almost the same, 35.1% and 36.8%, so on win rate alone you would call them twins, and the bearish side would look like the slightly better of the two. It is the one that lost money. The difference is in how much each win paid against each loss, not in how often they won, and a win rate cannot show you that.
Both raw win rates clear the 33.3% that a nominal 1:2 ratio asks for, so on the input sheet both sides look profitable. Eight months of that produced 2.12 USD. The realized column is where the difference shows up. The bullish wins averaged 1.90 times the bullish losses, close to what the inputs asked for. The bearish wins averaged only 1.66 times, and that moves the bearish bar from 33.3% up to 37.6%, above its own 36.8% win rate. Against the input sheet the bearish setup clears its bar by three and a half points. Against the account it misses by nearly one. That is the gap between paper breakeven and account breakeven, measured instead of guessed. Why the bearish wins came out short, the ledger cannot tell you. Exits, spread and fills all end up in the same number.
And neither side gets a verdict beyond undecided. Both intervals are more than twenty points wide and both contain their bar: 25.2% to 46.5% against 34.5% on the bullish side, 25.5% to 49.8% against 37.6% on the bearish one. With that much room, the record cannot tell a setup that clears its bar from one that misses it, and it does not pretend to. The bullish side ended in profit, but that is not a verdict.
The other four runs agree. The wins and losses were identical in all five, 26/48 and 21/36, and only the fills moved: the bullish net landed between +131.32 and +174.22 USD, the bearish between -156.64 and -139.22, and the verdicts did not change.
The same EA on a different timeframe
Changing only the timeframe also changed which side lost the money.
| Timeframe | Period tested | Bullish OB net | Bearish OB net | Worse setup |
|---|---|---|---|---|
| M1 | 2026.01.01 to 2026.09.10 | -5,580.10 | -1,258.12 | Bullish |
| M15 | 2026.01.01 to 2026.09.10 | +150.65 | -148.53 | Bearish |
The symbol, the period, the code and the inputs were identical in both rows. Only the timeframe changed, and the losing side changed with it. That is an observation, not an explanation. Moving from M1 to M15 also changes how often the setups fire, how wide the stops are and how much of each stop the spread eats, so the ledger tells you where to look, not why it happened. The M15 row is also the weaker of the two: at 131 trades neither side gets past undecided, so it points at the bearish side without convicting it.
The M1 row has far more trades behind it, so here it is in full. The tester's own summary first:
| Metric | Value |
|---|---|
| Bars / ticks | 257,154 / 21,410,204 |
| History quality | 100% |
| Initial deposit | 10,000.00 USD |
| Trades | 1,365 |
| Total net profit | -6,838.22 USD |
| Gross profit | 49,640.68 USD |
| Gross loss | -56,478.90 USD |
| Profit factor | 0.88 |
| Expected payoff | -5.01 USD |
| Recovery factor | -0.72 |
| Sharpe ratio | -5.00 |
| Equity drawdown maximal | 9,506.51 USD (78.34%) |
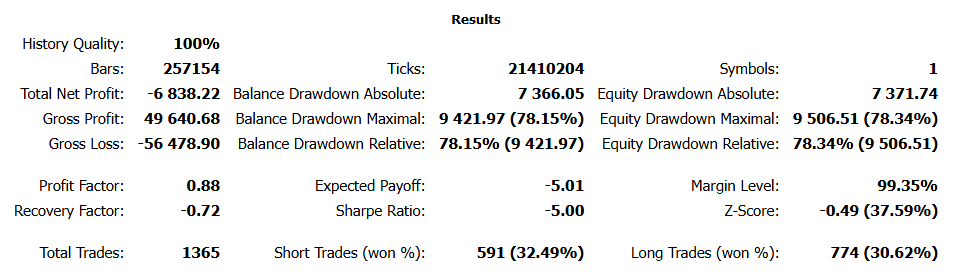
Fig. 3. Results section of the Strategy Tester report, USDCAD M1, run 1
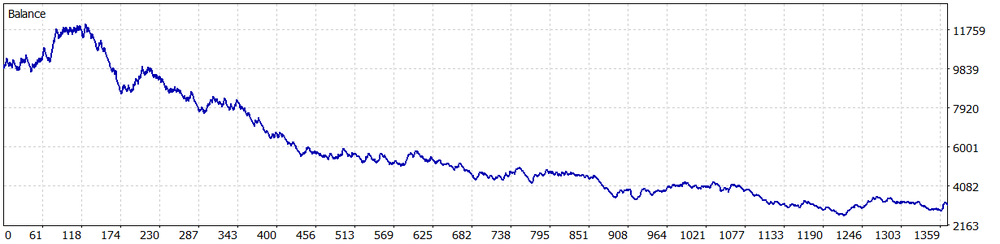
Fig. 4. Balance graph from the same report, x axis in trades
Eight months pointing one way. Every number in that table describes how badly the run went and not one of them says where to look. That is the complaint this article opened with.
The ledger printed this at the end of the same run:
Per-setup ledger  (95% Wilson interval, nominal reward 1:2.0)
---------------------------------------------------------------------
Bullish OB     237/537  raw  30.6%  wilson 27.5-34.0%  rejected
               net  -5580.10  per trade   -7.21  realised 1:1.88  breakeven  34.7%
Bearish OB     192/399  raw  32.5%  wilson 28.8-36.4%  undecided
               net  -1258.12  per trade   -2.13  realised 1:1.97  breakeven  33.7%
Reconcile it before reading anything into it. The counts are wins/losses, so the bullish setup traded 237 + 537 = 774 times and the bearish one 192 + 399 = 591, giving 1,365 trades against the tester's 1,365, and the same 774 long and 591 short the report lists. The two nets add to -6,838.22 USD, the tester's net loss to the cent.
Now the split says something. The bullish setup took 57% of the trades and produced 5,580.10 of the 6,838.22 loss, which is 82% of the damage. Across the five runs that share sat between 80.5% and 85.3%. The intervals are much narrower too, about six and a half points wide on the bullish side and seven and a half on the bearish, against more than twenty in the M15 run.
This is where the rejected verdict earns its place. Under the old two-way test both setups printed "not yet trusted", the same words the M15 run printed after 131 trades. Now they come apart. The bullish setup reads rejected: even the optimistic end of its interval, 34.0%, sits under the 34.7% its own wins and losses need. The bearish setup is still undecided. Its interval runs from 28.8% to 36.4% around a bar of 33.7%, so most of the range is below the line, but not all of it, and a net loss of 1,258.12 USD over 591 trades is not yet enough for the ledger to tell a slightly losing setup from a breakeven one. All five runs gave the same two verdicts.
How many trades would settle it? A rough answer comes from asking when the interval gets narrower than the gap it has to resolve. With a win rate p and a bar b, that takes about n = z^2 p (1 - p) / (p - b)^2 trades. For the bearish setup, p = 32.5% and b = 33.7%, which comes to roughly 6,000 trades, ten times what it has. The count grows with the square of how close a setup sits to its bar, so a setup that is nearly breakeven can stay undecided for as long as you care to test it. The formula treats the bar as exact, and it is not, so read the answer as a floor.
The bullish margin is thin, though.34.0% against 34.7% is less than a point. Trades are also not independent (see Limitations), so the real interval is wider than the one printed.
I read the rejection as strong evidence against this setup in this test, not as proof.
There is a limit to what any of it tells you. Both setups were graded on one symbol over one period with one set of inputs, so the finding is about this backtest, not about bullish order blocks in general. What it does buy is direction. Without the split, M1 is just a bad result, and the natural reaction is to start retuning every input in the EA. With the split, the cheapest useful experiment is obvious: take the bullish entries out and run the same test again.
That shortens the list of things worth trying next, which is the job the ledger was built for.
The demo EA
SetupLedgerDemo.mq5 is there so you can watch the mechanism work on trades you can read through in an afternoon. Three unrelated setups, one position at a time, ordinary risk-based sizing.
Run it on any symbol with default inputs, "Every tick" with random delay and a 10,000 USD balance, over enough history to produce a couple of hundred trades. The final Report() block in the journal is the whole result, in the same shape as the scalper's block above, with three setup rows instead of two and your own numbers in them.
I have deliberately not printed my run of it here. The demo entries are a plain RSI bounce, an EMA cross and an N-bar breakout, chosen because they fire often and differ from each other, not because they make money. Whatever they earn on your symbol over your date range is a different number from whatever they earned on mine, and quoting mine would advertise a result you cannot reproduce.
Check two things against your own output instead. The three nets have to add up to the tester's net result exactly, the same reconciliation the scalper passed above; if they do not, the ledger is miscounting positions and nothing above that line means anything. And the three win rates will almost certainly not resemble each other, even though the aggregate report treats all three as one strategy.
One detail in the demo EA is worth copying whether or not you use the ledger. It opens the position with no stops attached, selects it, reads the real fill price back, and only then sets the stop loss and take profit:
ulong  ticket = (ulong)PositionGetInteger(POSITION_TICKET);
double open   = PositionGetDouble(POSITION_PRICE_OPEN);
double sl     = isBuy ? open - stopDist : open + stopDist;
double tp     = isBuy ? open + stopDist * InpRewardRatio
                      : open - stopDist * InpRewardRatio;

if(!trade.PositionModify(ticket, NormalizeDouble(sl, _Digits),
                         NormalizeDouble(tp, _Digits)))
  {
   //--- never leave a filled position sitting without a stop
   PrintFormat("%s: stop attach failed (retcode %d), closing.",
               ledger.Name(setupId), trade.ResultRetcode());
   trade.PositionClose(ticket);
   return;
  }
Stops computed from a price snapshot taken before the order went out get rejected as invalid when the market moves during the fill. Computing them from POSITION_PRICE_OPEN avoids that. The failure branch matters just as much: if the modify fails, the position is closed immediately rather than left running naked. The scalper still sends its stops with the order, which is the older pattern and the next item on its own fix list.
Limitations
Netting accounts, stacked entries and reversals. A second entry in the same direction merges into the existing position and keeps its identifier, so two setups share one record and the first one is credited with all of it. A netting reversal is the same problem wearing a different hat: the position identifier survives the reversal, so one record now spans trades in both directions. Neither attached EA can hit either case, because both hold one position at a time. If yours stacks or reverses, the ledger needs a per-deal model instead of a per-position one.
One magic base, one symbol. The rebuild filters history by the chart symbol, which keeps a base from mixing two symbols together. Nothing filters by timeframe or by EA version. Run the same base on M5 and M15, or keep it across a rewrite that changes what a setup means, and the ledger will happily add both into one record.
The Wilson interval assumes trades are independent. They are not. Trades cluster by session, by volatility regime and by whatever the market was doing that week, so the true uncertainty is wider than a binomial interval says. Treat the bounds as the best case for how much you know, not the last word.
The breakeven bar is an estimate too. It comes from the setup's own average win and average loss, which are themselves small-sample numbers early on, and one unusually large loss moves the bar more than it should. It is a better bar than the nominal ratio, not an exact one.
One position tracked at a time. Both EAs keep a single g_activePositionId. An EA running several positions at once needs an array of tracked Ids, or it should drop the tracking and rebuild from history on a timer instead.
Sixteen setups maximum. SETUP_LEDGER_MAX is 16 and Register() refuses anything past it. Raise the constant if you need more, but sixteen setups on one account also means sixteen small samples, and the Wilson column will tell you so.
A verdict is not a diagnosis. A setup is scored on what its trades did, which mixes the entry with the stop, the target, the sizing and the execution. A setup that is right about direction and wrong about stop placement scores as a bad setup. For deciding what to trade tomorrow that is arguably fine, but a rejected verdict only says the setup did not clear its bar in this record. Finding out which part of it failed is the next job.
Some M1 signals never become trades. The scalper risks 1% of the balance on an ATR-based stop, and on M1 that stop can be so tight that the volume needs more margin than a 10,000 USD account at 1:100 has. In M1 run 1 the tester refused 641 such orders, split almost evenly between buys and sells. The attached version checks the margin first and skips those setups with a line in the journal instead of an error. Either way they never reach the ledger, so the split above describes the trades that were filled, not every signal the EA saw.
Statistics do not validate a strategy. A per-setup ledger built on a single in-sample backtest measures that backtest and nothing more. Out-of-sample testing on a period that was never used for tuning is a separate job, and this class does not replace it.
What comes next
The obvious extension is to let the EA act on the ledger instead of only reporting it. Verdict() already returns an enum, so gating entries on it is a two-line change: skip a setup once the ledger has rejected it, or only take one it trusts. That deserves its own article, because a filter that learns from its own results can overfit to a drawdown and switch itself off at the worst possible moment. The January flip in the M1 runs is exactly the kind of thing it would have to survive.
Two smaller additions come first, though. A per-session or per-weekday breakdown inside each setup often finds the leak faster than the setup split alone. And the 30-trade minimum is a blunt instrument. A sequential test, which is built for a sample you look at after every trade, would be the proper replacement, and it is what I would add before letting an EA switch a setup off by itself.
Conclusion
The class is about 560 lines. It writes the setup type into the magic number where the broker's own handling leaves it alone, then aggregates by position so that partial fills and partial closes do not multiply your trades, and counts swap and commission so the account and the ledger agree on what a trade was worth. The part that took longest to get right is the grading: each setup is measured against the breakeven rate its own average win and average loss imply, with no verdict at all until it has 30 closed trades, and with an interval that a small sample cannot flatter.
The M15 run is a 131-trade backtest with a profit factor of 1.00, the kind of result the aggregate report tells you to ignore, and on its own it deserves to be ignored. The split says one setup made 151 USD, the other lost 149, and the record cannot yet tell either of them from breakeven. On M1 the same split marks one setup as rejected and leaves the other undecided, which is a different answer from "not enough data" and deserves a different reaction. None of that comes out of the standard report.
Put it in an EA that trades more than one kind of setup, and the next bad run gives you somewhere to start looking instead of a single number.
References
- MQL5 Reference, Trade Functions: HistorySelectByPosition, HistoryDealGetInteger, HistoryDealGetDouble
- MQL5 Reference, Event Handling: OnTradeTransaction and the MqlTradeTransaction structure
- MQL5 Reference, Position Properties: POSITION_IDENTIFIER, POSITION_TICKET, POSITION_MAGIC
- Wilson, E. B. (1927). Probable Inference, the Law of Succession, and Statistical Inference. Journal of the American Statistical Association, 22(158), 209-212.
- Brown, L. D., Cai, T. T., DasGupta, A. (2001). Interval Estimation for a Binomial Proportion. Statistical Science, 16(2), 101-133.
Attached files
| File | Install to | Description |
|---|---|---|
| CSetupLedger.mqh | MQL5/Include/SetupLedger/ | The ledger class. No dependencies. |
| SetupLedgerDemo.mq5 | MQL5/Experts/SetupLedger/ | Minimal three-setup demo EA with the ledger wired in. Magic base 772001. |
| SMC_LiquiditySweepScalper.mq5 | MQL5/Experts/SetupLedger/ | The liquidity-sweep scalper used for the results above. Magic base 552001. |
| MQL5.zip | Terminal data folder | Archive with all three files. Unpack it into the terminal data folder (File > Open Data Folder) and every file lands in its place. |
Warning: All rights to these materials are reserved by MetaQuotes Ltd. Copying or reprinting of these materials in whole or in part is prohibited.
This article was written by a user of the site and reflects their personal views. MetaQuotes Ltd is not responsible for the accuracy of the information presented, nor for any consequences resulting from the use of the solutions, strategies or recommendations described.

 How to Implement R/S Analysis and the Hurst Indicator in MQL5
 Property-Based Testing for Trading Rules in MQL5 (Part 1): Generate Market Scenarios, Test Invariants, Find Edge Cases
 Uncertainty as a Model (Part 6): Multiple Regression and Diagnostics
 Neural Networks in Practice: When to Use an Artificial Neuron and How It Works in MQL5

- Free trading apps
- Over 8,000 signals for copying
- Economic news for exploring financial markets
You agree to website policy and terms of use