

From Deal History to Hazard Curves: Survival Analysis Applied To Strategies
 736
 0

Introduction
A position has been open for ten bars. It has not hit the target and it has not hit the stop. You are deciding whether to keep holding, and the only statistic most of us have to hand is a win rate: this strategy wins 22% of the time. That number is true and useless here, because it describes every trade the strategy ever opened, not the smaller group still alive after ten bars.
The question you actually have is conditional: given that this trade has survived ten bars without resolving, what is the chance it reaches target in the next ten? No slicing of a single aggregate win rate produces that number, but an entire branch of statistics was built to produce it. Medicine asks whether a patient who has survived two years will reach five; reliability engineering asks whether a component that has run a thousand hours is about to fail. Kaplan-Meier estimation, hazard functions and cumulative incidence transfer to trade duration almost unchanged.
On the run shown later, a trade of this strategy that has just come through its opening bar has a 6.28% chance of reaching target within the following ten, while one that has survived ten bars has 18.18%. Same strategy, same target, same history: the survivors are a different population from the entrants.
There is one trap on the way, and it is the reason this article exists. The obvious way to apply survival analysis to trading is to treat "reached target" as the event and everything else as censored. That is wrong in a predictable direction, and on the same run it nearly triples the estimate. We build the correct estimator alongside the incorrect one and display both, because seeing the gap is what makes the point stick.
What we build is a library, an indicator that puts these numbers on your chart, and a small Expert Advisor that generates a trade history for it to read. The indicator reports probabilities; it never issues a close instruction.
We will cover:
- Why a Win Rate Cannot Answer the Question
- From Deal History to Observations
- Every Curve from One Sweep
- The Panel
- The Demonstration Expert, and How to Attach the Panel
- Reading the Panel
- Edge Cases and Pitfalls
- Conclusion
Why a Win Rate Cannot Answer the Question
Survival analysis needs two numbers per subject: how long it was observed, and what ended the observation. A closed trade supplies both. The duration is how long the position was open and the outcome is how it closed. The difficulty is entirely in the second, because it has three answers rather than two, and almost every mistake here comes from collapsing three into two.
A trade can end in profit, end at a loss, or still be running when we stop looking. The first two are terminal events: the trade is over. The third is censoring: we ran out of observation time, and the trade could still go on to do anything.
It is tempting to treat a win as the event we care about and everything else as censoring. That is incorrect: censoring means the outcome is unobserved, not impossible. It carries a specific promise, that the subject left our view but the event could still happen out there. A patient who moves away and stops attending follow-ups is censored, because they might develop the condition where we cannot see it. A stopped-out trade is closed: the target can never be reached, not because we stopped watching but because there is nothing left to watch.
Wins and losses are competing risks: two terminal events racing for the same position, whichever arrives first permanently ruling out the other. Only a position still open at the moment of measurement is censored.
The consequence is mechanical. Call a stopped-out trade "censored" and the estimator does what it should with censored subjects: it assumes they behave like the trades still under observation. It hands each dead trade the future of the survivors, so the estimated chance of reaching target is inflated. The bias only ever runs one way, and that is algebra rather than a claim about averages: on any sample the naive figure is greater than or equal to the correct one, with equality only where no competing event has occurred.

Fig. 1. A win and a loss are competing terminal events, not one event with opposite signs. Only a position still open at the cutoff is censored.
The vocabulary lives in a small header of its own, so the estimator and the history reader cannot drift apart in naming.
//--- cause selector for the routines that work one event type at a
//--- time. SURV_CAUSE_ALL pools both terminal events into one.
#define SURV_CAUSE_ALL   (-1)
#define SURV_CAUSE_WIN     0
#define SURV_CAUSE_LOSS    1

//+------------------------------------------------------------------+
//| What ended the observation of one trade. WIN and LOSS compete;   |
//| OPEN is the censoring category.                                  |
//+------------------------------------------------------------------+
enum ENUM_SURV_OUTCOME
  {
   SURV_OUTCOME_WIN=0,                 // closed in profit  - terminal event
   SURV_OUTCOME_LOSS=1,                // closed at a loss  - terminal event
   SURV_OUTCOME_OPEN=2                 // open at cutoff    - censored
  };

//+------------------------------------------------------------------+
//| One trade, reduced to what an estimator actually needs.          |
//+------------------------------------------------------------------+
struct SurvObservation
  {
   int               duration;         // bars survived, entry to exit
   ENUM_SURV_OUTCOME outcome;          // which of the three ended it
   long              group;            // magic number / strategy id
  };
Three fields is the whole input to everything that follows: a duration, an outcome, and the magic number of the strategy that opened the trade. The two classifications answer different questions. ENUM_SURV_OUTCOME labels what happened to one trade, so it has a third value for trades nothing has happened to yet. The SURV_CAUSE constants select which curve a caller wants read back, and censoring is not a curve, so there are two plus a pooled option.
From Deal History to Observations
MetaTrader 5 does not store positions in its history. It stores deals, and a position is reconstructed from them. That reconstruction is the first pass of CTradeHistoryReader, and it has more edge cases than the statistics that follow.
Pass one: joining deals into positions
The join key is DEAL_POSITION_ID, not the order ticket. A single position can be built and dismantled by any number of orders: an entry, two partial closes, a stop-out of the remainder. Each is a separate deal with its own order ticket, and all carry the same position id. Grouping on it turns four deals back into one trade with one duration; grouping on anything else fragments it.
//--- Select everything: narrowing to the cutoff would leave a
//--- part-closed position showing a partial exit as its final one.
   if(!HistorySelect(0,(datetime)TimeCurrent()+86400))
      return(0);

   const int deals=HistoryDealsTotal();
   for(int i=0;i<deals;i++)
     {
      const ulong ticket=HistoryDealGetTicket(i);
      if(ticket==0)
         continue;

      const ENUM_DEAL_TYPE dtype=
         (ENUM_DEAL_TYPE)HistoryDealGetInteger(ticket,DEAL_TYPE);
      if(dtype!=DEAL_TYPE_BUY && dtype!=DEAL_TYPE_SELL)
         continue;                     // balance, credit, corrections

      const string sym=HistoryDealGetString(ticket,DEAL_SYMBOL);
      if(m_symbol!="" && sym!=m_symbol)
         continue;

      const long pid=HistoryDealGetInteger(ticket,DEAL_POSITION_ID);
      if(pid==0)
         continue;

      const ENUM_DEAL_ENTRY entry=
         (ENUM_DEAL_ENTRY)HistoryDealGetInteger(ticket,DEAL_ENTRY);
      if(entry==DEAL_ENTRY_STATE)
         continue;                     // state change, not a fill
The selection is deliberately unbounded, for a narrower reason than it looks. A position whose only close falls after the cutoff survives a narrowed selection perfectly well: the opening deal is there, no closing deal is, so the second pass censors it correctly. What breaks is a position closed in pieces either side of the cutoff. Its partial close lands inside the narrowed range and stamps the record closed before it, so a position still open and still at risk is scored as resolved on partial money.
Four filters then run, each removing a way the sample can be poisoned. Balance and credit operations go first: a deposit is a deal with a profit attached, and would reach the estimator as a phantom zero-duration trade that "won". Then the symbol filter, deals carrying no position id, and DEAL_ENTRY_STATE, a state change rather than a fill.
A deal that survives the filters is attached to a position record: the deal's money is accumulated into that record and its timestamp noted.
      const datetime dt=(datetime)HistoryDealGetInteger(ticket,DEAL_TIME);

      //--- Only money realised by the cutoff. A position closing after
      //--- censor_at is reported open below, and adding its closing
      //--- deal would stamp it with a result not yet knowable.
      if(dt<=censor_at)
         m_pos[k].pnl += HistoryDealGetDouble(ticket,DEAL_PROFIT)
                         +HistoryDealGetDouble(ticket,DEAL_SWAP)
                         +HistoryDealGetDouble(ticket,DEAL_COMMISSION);

      if(entry==DEAL_ENTRY_IN)
        {
         if(!m_pos[k].has_in)
           {
            m_pos[k].t_in  =dt;
            m_pos[k].magic =HistoryDealGetInteger(ticket,DEAL_MAGIC);
            m_pos[k].symbol=sym;
            m_pos[k].has_in=true;
           }
        }
      else
        {
         //--- OUT, OUT_BY and the netting reversal INOUT all end the
         //--- position that was running; the last one wins so a
         //--- partially closed position is timed to its final exit.
         m_pos[k].t_out =dt;
         m_pos[k].closed=true;
        }
Money is summed across every deal of the position rather than read off the closing one. Commission is charged on the entry, swap accrues over the life of the trade, and a partial close books its profit in instalments. The entry timestamp comes from the first DEAL_ENTRY_IN, guarded by has_in; the exit comes from the last exit deal, because assignment simply overwrites. A position scaled into and closed in pieces therefore spans first fill to final one.
Looking the record up is where a naive implementation becomes quadratic, so it gets a fast path.
//+------------------------------------------------------------------+
//| Locate a position record by id.                                  |
//|                                                                  |
//|  Deals are iterated in time order and a position's deals sit     |
//|  together, so the previous match is usually the right answer;    |
//|  that check is what keeps the join near-linear. The backward     |
//|  scan behind it is the correctness fallback for a position       |
//|  closed long after it was opened, and it is linear in the worst  |
//|  case - see the article for when that starts to matter.          |
//+------------------------------------------------------------------+
int CTradeHistoryReader::Find(const long pid)
  {
   if(m_last>=0 && m_last<m_used && m_pos[m_last].pid==pid)
      return(m_last);

   for(int i=m_used-1;i>=0;i--)
     {
      if(m_pos[i].pid!=pid)
         continue;
      m_last=i;
      return(i);
     }
   return(-1);
  }
The one-line cache in front of the scan makes this practical. Deals arrive in time order and a position's deals sit next to each other, so most lookups hit the cached index and never enter the loop. The scan covers what the cache cannot, a position opened months before it was closed, and each miss costs a linear scan, so a history full of long-overlapping positions is where the join stops being cheap.
Duration is measured in bars, not in clock time
A position opened on Friday afternoon and closed on Monday morning has existed for roughly sixty-five hours, about forty-eight of them with the market shut. Charging the trade for hours in which it had no opportunity to reach its target treats dead calendar as exposure and smears the curves for every position that spans a weekend. A bar count charges only the periods in which price could move, and it is also what an indicator compares against the age of the position in front of it.

Fig. 2. The same trade measured two ways. Clock time credits the closed weekend as exposure; the bar count charges only the periods in which price could move.
The measurement is a single free function, and it deliberately does not live inside the reader.
//+------------------------------------------------------------------+
//| Bars of 'tf' spanned by an interval, endpoints included.         |
//|                                                                  |
//|  Bars, not seconds: a position carried over a weekend accrues    |
//|  clock time in which price could not move, and charging the      |
//|  trade for it smears every curve. Subtracting one turns "bars    |
//|  touched" into "bars survived", so a trade opened and closed     |
//|  inside one bar is zero. The reader and the panel must both      |
//|  call this or they will disagree about how old a position is.    |
//|  The fallback covers a symbol whose history is not built yet.    |
//+------------------------------------------------------------------+
int SurvBarsBetween(const string symbol,const ENUM_TIMEFRAMES tf,
                    const datetime t0,const datetime t1)
  {
   if(t1<=t0)
      return(0);

   const int counted=Bars(symbol,tf,t0,t1);
   if(counted>0)
      return(counted-1);

   const int secs=PeriodSeconds(tf);
   if(secs<=0)
      return(0);
   return((int)((t1-t0)/secs));
  }
Two measurements have to agree on what a duration means: the reader times the closed trades, and the panel ages the position in front of you to find where it sits on them. Neither would report a problem if they drifted, so the definition lives in the shared header.
Pass two: what "still open" means
The reader is driven by three timestamps: entry_from and entry_to, which bound the entry times of the trades that belong to the sample, and censor_at, the moment observation stops.
//--- second pass: censor, measure, emit.
   if(m_used>0 && ArrayResize(out,m_used)<0)
      return(0);

   int n=0;
   for(int k=0;k<m_used;k++)
     {
      if(!m_pos[k].has_in)
        {
         if(m_pos[k].closed)
            m_skipped_no_in++;
         continue;
        }

      const datetime t_in=m_pos[k].t_in;
      if(t_in<entry_from || t_in>=entry_to || t_in>censor_at)
         continue;

      const bool decided=(m_pos[k].closed && m_pos[k].t_out<=censor_at);
      const datetime t_end=(decided ? m_pos[k].t_out : censor_at);

      out[n].duration=SurvBarsBetween(m_pos[k].symbol,m_tf,t_in,t_end);
      out[n].group   =m_pos[k].magic;

      if(!decided)
         out[n].outcome=SURV_OUTCOME_OPEN;
      else
         out[n].outcome=(m_pos[k].pnl>0.0 ? SURV_OUTCOME_WIN
                         : SURV_OUTCOME_LOSS);
      n++;
     }

   ArrayResize(out,n);
   return(n);
The decided flag carries the argument. A position counts as resolved only if it closed and closed at or before the cutoff. One that closed after it is reported as open, its duration truncated there, even though the deal history in memory plainly shows how it ended. Refusing to look is the point: a curve fitted from outcomes that were not yet knowable describes a past nobody could have traded.
The same branch makes the live case work. Pass TimeCurrent() as the cutoff and the positions open right now fall through it with no special handling: still under observation, outcome undecided, contributing to the risk set and nothing else.
The first branch counts rather than drops silently. A closing deal whose opening deal is nowhere in the selected history means the broker has trimmed the account's records, so the sample is missing its earliest trades. SkippedNoEntry() surfaces that count as a warning row, because such a sample is biased in a way no correct arithmetic downstream will fix.
Outcome is taken from the sign of net money, profit plus swap plus commission, rather than the closing deal's reason code: reason codes classify the exits the terminal places itself, so a strategy that closes under its own logic would leave holes in the sample. A flat result counts as a loss, since the two categories have to partition the outcomes.
That fixes what the estimator is about, and the distinction is worth making before any number is read. The two competing events are closed in profit and closed at a loss, not take-profit fired and stop-loss fired. They come apart whenever a strategy closes a position itself, whenever a target nets negative after costs, and whenever partial closes at both levels arrive as one signed total. For the demonstration Expert they coincide; on your own program they may not.
Every Curve from One Sweep
Durations are non-negative bar counts, so the estimator never has to sort anything. Each trade is dropped into a bucket indexed by its duration, and the bucket array is walked once from bar zero upward, carrying the risk set along. There are three bucket arrays because the outcomes stay separated all the way to the sweep: m_d_win and m_d_loss count terminal events landing on each bar, b_cens counts trades still open when observation stopped.
The risk set at bar t is the number of trades whose duration is at least t. It is read before the events at t are applied and decremented afterwards, the standard convention that a subject censored at exactly t was still at risk there. Getting that order backwards shifts every curve by one bar.
Four curves come out of that traversal, plus one quantity from the counts it leaves behind.
The all-cause survival curve S(t) is Kaplan-Meier with both terminal events pooled, so S(t) is the fraction of trades still running after t bars. Each event bar multiplies the running product by one minus the fraction of the risk set that ended there:
S(t) = S(t-1) * (1 - d_all(t) / n(t))
Here d_all(t) is the number of trades, won or lost, that ended exactly on bar t, and n(t) is the risk set. Censored trades never appear in the numerator, which is precisely why calling a loss "censored" changes the answer.
The hazard h(t) is the rawest quantity: of the trades that reached bar t, the share that resolved exactly on that bar. It is the one the sweep does not store, since the per-bar counts stay resident and the hazard divides out of them on demand. Read across bars it is the aging profile, and that profile is why a conditional answer can differ from an unconditional one: a flat hazard would make surviving uninformative.
The cumulative incidence of each cause is the Aalen-Johansen estimator, the correct answer to "what fraction of trades reach target by bar t" under competing risks. Its increments look almost like the naive ones, with one crucial factor:
CIF_win(t) = CIF_win(t-1) + S(t-) * d_win(t) / n(t) Here d_win(t) is the number of wins landing exactly on bar t, n(t) is the risk set, and S(t-) is the all-cause survival immediately before the bar. That last factor is what makes this Aalen-Johansen rather than two independent Kaplan-Meier fits: weighting by the probability of still being in contention prevents a trade already removed by the other outcome from counting as a future case of this one.
The naive curve is the same question answered the wrong way: Kaplan-Meier run on wins alone, every loss treated as censored. We keep it because the gap between it and the cumulative incidence is the finding this article is built around.
//--- pass three: the sweep. Everything below is one traversal of
//--- the bucket array carrying five running quantities.
   int    n_risk   =count;             // trades with duration >= t
   double surv     =1.0;               // all-cause S(t)
   double surv_win =1.0;               // wins-only KM, the naive curve
   double cif_win  =0.0;               // Aalen-Johansen, wins
   double cif_loss =0.0;               // Aalen-Johansen, losses

   for(int t=0;t<=dmax;t++)
     {
      m_at_risk[t]=n_risk;

      const int d_win =m_d_win[t];
      const int d_loss=m_d_loss[t];
      const int d_all =d_win+d_loss;

      if(d_all>0 && n_risk>0)
        {
         const double n     =(double)n_risk;
         const double s_prev=surv;

         //--- the two increments that make this Aalen-Johansen and
         //--- not two independent Kaplan-Meiers: each is scaled by
         //--- the probability of still being in contention at all.
         cif_win  += s_prev*(double)d_win /n;
         cif_loss += s_prev*(double)d_loss/n;

         surv     *= 1.0-(double)d_all/n;
         surv_win *= 1.0-(double)d_win/n;
        }

      m_surv[t]     =surv;
      m_cif_win[t]  =cif_win;
      m_cif_loss[t] =cif_loss;
      m_naive_win[t]=1.0-surv_win;

      n_risk -= d_win+d_loss+b_cens[t];
     }
surv multiplies by one minus the fraction of the risk set removed by either outcome; surv_win multiplies by one minus the fraction removed by wins only, which is what treating losses as censoring does. That single identifier is the difference between the correct estimate and the inflated one. In the last line the censoring bucket does its work: a trade still open at bar t leaves the risk set without entering a numerator.
//+------------------------------------------------------------------+
//| Hazard at one bar: of the trades that reached it, the share      |
//| that resolved there. Read across bars this is the aging          |
//| profile, and it is the raw material every curve above is built   |
//| from rather than a separate estimate.                            |
//+------------------------------------------------------------------+
double CSurvival::HazardAt(const int bar,const int cause) const
  {
   if(m_count<=0 || bar<0 || bar>m_dmax)
      return(0.0);
   const int n=m_at_risk[bar];
   if(n<=0)
      return(0.0);

   int d=0;
   if(cause==SURV_CAUSE_WIN)
      d=m_d_win[bar];
   else
      if(cause==SURV_CAUSE_LOSS)
         d=m_d_loss[bar];
      else
         d=m_d_win[bar]+m_d_loss[bar];

   return((double)d/(double)n);
  }
All four curves go into dense per-bar arrays rather than a sparse table of event times, so a lookup is an array index instead of a search, which matters because the panel evaluates them on every refresh.

Fig. 3. The all-cause survival curve with its shrinking risk set, and the growing gap between the Aalen-Johansen cumulative incidence and the naive curve that miscalls losses censored. The gap widens as the risk set thins.
Conditioning on having got this far
The conditional probability is a short calculation on top of those arrays, and the one the library exists to produce.
//+------------------------------------------------------------------+
//| Forward incidence, conditioned on having survived this far.      |
//|                                                                  |
//|  Dividing by S(bar) re-bases the increment on the trades that    |
//|  survived bar 'bar' rather than on every trade ever opened, so   |
//|  the window it reports on is bars bar+1 to bar+horizon and a     |
//|  trade resolving on bar 'bar' itself is in neither end of it.    |
//+------------------------------------------------------------------+
double CSurvival::ConditionalIncidence(const int bar,const int horizon,
                                       const int cause) const
  {
   if(m_count<=0 || horizon<=0 || bar<0)
      return(0.0);
   const double s=SurvivalAt(bar);
   if(s<=0.0)
      return(0.0);
   const double lo=IncidenceAt(bar,cause);
   const double hi=IncidenceAt(bar+horizon,cause);
   const double p =(hi-lo)/s;
   if(p<0.0)
      return(0.0);
   return(p>1.0 ? 1.0 : p);
  }
The incidence gained between the current bar and the horizon is divided by the survival at the current bar. That division is the trick: without it you have the fraction of all trades reaching target in that window, with it the fraction of those that got this far. On the demonstration run the two differ by nearly a factor of three.
One convention decides how every conditional figure should be read. S(bar) is the survival after the events of that bar, and both lookups sit on the same footing, so what comes back is the chance of resolving in bars bar+1 through bar+horizon, given the trade survived bar itself. The age-zero row therefore reads as a trade that has survived its first bar, and the risk set printed beside it is read one step earlier in the sweep: the sample size behind the curve, not the denominator of the probability.
Knowing where to stop reading
Every survival curve degenerates at its right-hand end. The risk set shrinks monotonically, and by the final observation it is often a single trade, at which point the estimator reports the fate of that one trade with two decimals of false precision. This afflicts any method that conditions on survival, not just the naive curve.
So the library exposes the point beyond which its own output should not be quoted.
//+------------------------------------------------------------------+
//| Last bar whose risk set is still worth quoting a figure from.    |
//|                                                                  |
//|  The risk set is non-increasing, so this is a plain scan for the |
//|  point where it drops through min_n. Returns -1 when even bar    |
//|  zero has fewer trades than that, which is the honest answer     |
//|  for a sample too small to read anywhere.                        |
//+------------------------------------------------------------------+
int CSurvival::ReliableBar(const int min_n) const
  {
   if(m_count<=0)
      return(-1);
   int last=-1;
   for(int t=0;t<=m_dmax;t++)
     {
      if(m_at_risk[t]<min_n)
         break;
      last=t;
     }
   return(last);
  }
The panel reads its headline comparison at this bar rather than at the end of the curve, which is the difference between a figure a reader can defend and one that merely looks dramatic.
The threshold is a convention and nothing stronger. Twenty puts a floor under the risk set rather than a bound on any estimate's variance, and it is weakest where it is most tempting to lean on: a rare event over a small risk set, where twenty survivors may hold one win or none. Raise it on a strategy with a low win rate.
The Panel
The display is an indicator rather than an Expert Advisor for a practical reason. A chart has exactly one Expert slot and your strategy is already occupying it, while an indicator coexists with whatever else is running.
It declares no buffers and no plots. Everything is drawn with label objects on a rectangle, since the quantities are numbers to read rather than series to plot.
Inputs
| Input | Default | What it does |
|---|---|---|
| InpLookbackDays | 0 | Entry-time lookback in days; 0 uses the whole history. Filters on entry, so a still-open position older than the window drops out of the sample |
| InpMagicA | -1 | Magic to analyse; -1 pools every trade on the account, sensible only if it runs one system |
| InpHorizon | 10 | Forward window in bars for every conditional probability |
| InpMinAtRisk | 20 | Smallest risk set worth reading; drives the thin-sample warnings and the comparison bar |
| InpCorner, InpX, InpY, InpFontSize | upper left, 14, 14, 9 | Placement and size; the font face is fixed at Consolas, for reasons below |
| InpColBg … InpColWarn | see source | Panel colours; InpColLive marks the live-position block, InpColWarn anything to distrust |
When it recomputes
Selecting the entire deal history on every tick would be correct and unusably slow over a long visual test, so the refresh is gated on what can move the numbers.
//+------------------------------------------------------------------+
//| Refit only when the sample can actually have changed.            |
//|                                                                  |
//|  The numbers move when a bar closes (the live position ages) or  |
//|  when the position state changes (the sample changes), and       |
//|  LiveKey() folds the second into one comparison. Selecting the   |
//|  whole deal history per tick would crawl in a long test.         |
//+------------------------------------------------------------------+
int OnCalculate(const int rates_total,
                const int prev_calculated,
                const datetime &time[],
                const double &open[],
                const double &high[],
                const double &low[],
                const double &close[],
                const long &tick_volume[],
                const long &volume[],
                const int &spread[])
  {
   const datetime bar=(rates_total>0 ? iTime(_Symbol,Period(),0) : 0);
   const string   key=LiveKey();

   if(prev_calculated==0 || bar!=g_last_bar || key!=g_last_key)
     {
      g_last_bar=bar;
      g_last_key=key;
      Rebuild();
      Render();
     }
   return(rates_total);
  }
A bar timestamp catches the live position aging; the key catches everything else. A count on its own would miss every change that leaves it intact: a partial close, a netting reversal, a close and an open inside one bar, and a swap of which position is described all keep PositionsTotal() constant while the numbers underneath move.
//+------------------------------------------------------------------+
//| Everything the panel reads besides the bar, as one string.       |
//|                                                                  |
//|  A position count alone misses every change that leaves it       |
//|  intact: a partial close, a netting reversal, a close and an     |
//|  open inside one bar, or a swap of which position is first.      |
//+------------------------------------------------------------------+
string LiveKey(void)
  {
   datetime t_open=0;
   ulong    ticket=0;
   double   volume=0.0;
   LivePosition(t_open,ticket,volume);
   return(StringFormat("%d|%I64u|%.2f|%I64d",PositionsTotal(),ticket,
                       volume,(long)t_open));
  }
The count is global while the sample is not, so a position on an unrelated symbol still forces a rebuild that changes nothing. Wasted work is the cheaper failure.
The rebuild itself is four lines of substance.
//+------------------------------------------------------------------+
//| Read the history and fit the curves for the selected magic.      |
//|                                                                  |
//|  TimeCurrent() as the cutoff is what makes the open positions    |
//|  censored observations rather than missing ones: they are still  |
//|  under observation and their outcome is genuinely undecided, so  |
//|  they belong in the risk set and nowhere else.                   |
//+------------------------------------------------------------------+
void Rebuild(void)
  {
   const datetime now=TimeCurrent();
   const datetime from=(InpLookbackDays>0
                        ? now-(datetime)InpLookbackDays*86400 : 0);

   g_obs_count=g_reader.Read(from,now+1,now,g_obs);

//--- Fit resets itself on an empty or rejected sample, so a failure
//--- needs no handling here: the panel reads Count()==0 and says so.
   if(InpMagicA>=0)
     {
      const int kept=SurvFilterByGroup(g_obs,g_obs_count,InpMagicA,g_fit);
      g_surv.Fit(g_fit,kept);
     }
   else
      g_surv.Fit(g_obs,g_obs_count);
  }
Passing now as the cutoff makes currently-open positions arrive as censored observations. The magic filter lets the panel describe one strategy on an account running several, since durations pooled across strategies that age differently describe none of them.
The aging block
A single conditional probability hides the shape that produced it, so the panel also asks the same question at four ages, chosen from the data rather than hard-coded.
//+------------------------------------------------------------------+
//| The ages the aging block is sampled at: entry, then the three    |
//| quartiles of holding time.                                       |
//|                                                                  |
//|  Quartiles rather than fixed bar numbers, so the block scales to |
//|  whatever this strategy's holding times happen to be instead of  |
//|  printing the same row four times on a fast system. Duplicates   |
//|  and unreached quantiles both fall out of the ascending test.    |
//+------------------------------------------------------------------+
int AgingAges(int &ages[])
  {
   ArrayResize(ages,4);
   ages[0]=0;
   int n=1;

   const double q[3]={0.75,0.5,0.25};
   for(int i=0;i<3;i++)
     {
      const int a=g_surv.QuantileDuration(q[i]);
      if(a>ages[n-1])
        {
         ages[n]=a;
         n++;
        }
     }
   ArrayResize(ages,n);
   return(n);
  }
Quartiles of the survival curve scale with the strategy. On a system whose trades resolve in three bars the block samples ages 0, 1, 2 and 3; on one that holds for weeks it spreads to match, where hard-coded ages would print four identical rows on the first and miss the interesting region on the second. Quantiles the curve never reaches come back as -1 and fall out of the comparison.
Drawing it
Three details in the rendering separate a panel that looks deliberate from one that looks broken.
//+------------------------------------------------------------------+
//| "label ................ value", padded to one value column.      |
//|                                                                  |
//|  Right-aligning by padding only works because the face is fixed  |
//|  width; in a proportional font the same character count is a     |
//|  different number of pixels and the column would wander.         |
//+------------------------------------------------------------------+
string Kv(const string k,const string v)
  {
   int pad=PANEL_COLS-2-StringLen(k)-StringLen(v);
   if(pad<1)
      pad=1;

   string s="  "+k;
   for(int i=0;i<pad;i++)
      s+=" ";
   return(s+v);
  }
First, the numbers are right-aligned by padding to a fixed character column, which only produces a straight edge because the label font is pinned to Consolas. Swap in a proportional face and the same character count becomes a different pixel width on every row.
Second, the horizontal rules cannot be composed with the rows, because their width is unknown until every row exists. Rows carrying a sentinel string are filled in during Commit, once the widest line has been measured.
Third, the background plate is sized from TextGetSize rather than a guess at character width, and created with OBJPROP_BACK false so it draws over the candles and OBJPROP_SELECTABLE false so clicks still reach the chart. A plate created behind the chart is invisible; a selectable one swallows every mouse interaction in its rectangle.
What the panel refuses to report
Every figure on the panel is descriptive: probabilities, sample sizes, and the estimation error the naive approach would make. It does not recommend closing anything, and that restraint is deliberate. A rule converting these probabilities into an exit instruction has to assume the payoff structure that produced them will persist, and payoff structures are exactly what shifts between regimes.
The model itself is the second reason. These curves condition on age and on nothing else, so two positions of the same age receive the same numbers whether one is a tick from its target or a tick from its stop. Everything else a hold-or-close decision needs is outside them by construction, and bringing it in means covariates and a larger article than this one.
The Demonstration Expert, and How to Attach the Panel
To demonstrate the panel we need a trade history for it to read, so the attached Expert Advisor implements a plain Donchian channel breakout: enter when the previous bar closes beyond the extreme of the preceding forty bars, stop at 1.5 ATR, target at 4.0 ATR, one position at a time. It is untuned and not a recommendation. A wide target with a tight stop gives the shape that makes these curves worth looking at: mostly short losers, a few long winners, a low win rate.
One detail matters for the statistics rather than the trading: the Expert never closes a position itself, so every duration the panel reads is the natural life of the trade rather than an artefact of the Expert interfering.
The attachment is the part you will want to reuse on your own programs.
//--- The panel travels inside this Expert rather than beside it.
//--- A tester agent unpacks the Expert into its own sandbox, so an
//--- indicator merely sitting in Indicators\ would not follow it
//--- there; an embedded one always does.
#resource "\\Indicators\\Survival\\SurvivalPanel.ex5"
Embedding the compiled indicator as a resource keeps the Expert self-contained. The handle is then created in the usual way, with one detail that deserves a warning.
//+------------------------------------------------------------------+
//| Create the ATR, then the panel.                                  |
//|                                                                  |
//|  Note the two empty strings in the iCustom call. An 'input       |
//|  group' occupies a parameter slot of its own, so every group     |
//|  needs a "" placeholder. Omit one and every argument after it    |
//|  shifts down by a position, silently, because the types still    |
//|  convert. Trailing arguments may be dropped, which is why the    |
//|  panel's appearance inputs are absent and keep their defaults.   |
//+------------------------------------------------------------------+
int OnInit(void)
  {
   g_trade.SetExpertMagicNumber(InpMagic);
   g_trade.SetTypeFillingBySymbol(_Symbol);

   g_atr=iATR(_Symbol,PERIOD_CURRENT,InpAtrPeriod);
   if(g_atr==INVALID_HANDLE)
     {
      Print("SurvivalDemo: cannot create ATR handle");
      return(INIT_FAILED);
     }

   if(InpShowPanel)
     {
      g_panel=iCustom(_Symbol,PERIOD_CURRENT,
                      "::Indicators\\Survival\\SurvivalPanel.ex5",
                      "",                    // group: Sample
                      0,                     // InpLookbackDays
                      InpMagic,              // InpMagicA
                      "",                    // group: Diagnostic
                      InpHorizon,            // InpHorizon
                      InpMinAtRisk);         // InpMinAtRisk
      if(g_panel==INVALID_HANDLE)
        {
         Print("SurvivalDemo: cannot create SurvivalPanel handle");
         return(INIT_FAILED);
        }
     }

   g_bar=0;
   return(INIT_SUCCEEDED);
  }
Passing the Expert's own magic number into the panel's filter means the panel automatically describes that Expert's trades. To put it on your own program, add the #resource line, the iCustom call in OnInit with the correct placeholders, and an IndicatorRelease in OnDeinit.
Two operational notes. The panel only appears in the Strategy Tester with visual mode enabled, since a non-visual run has no chart. And because #resource bakes the compiled indicator into the Expert, editing the panel means recompiling the panel first and the Expert second.
Reading the Panel
Running the Expert on EURUSD H4 from January 2021 to January 2026 in visual mode, paused on 12 December 2025 with a position ten bars old, produces this.
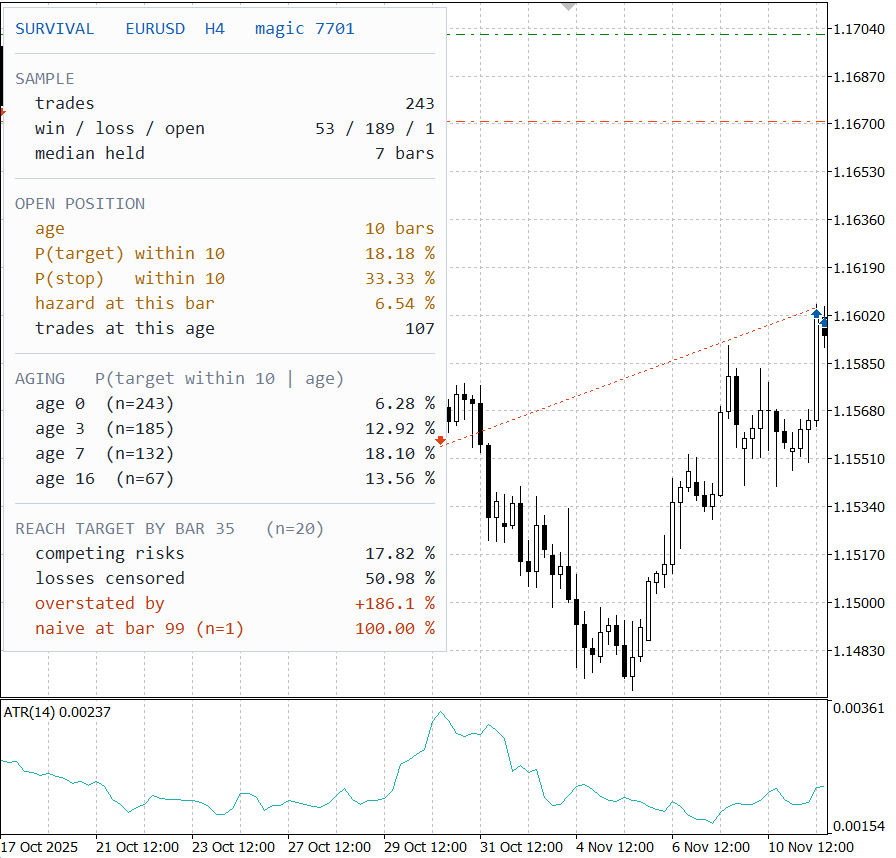
Fig. 4. The panel during a visual test on EURUSD H4, paused on 2025.12.12 with a ten-bar-old position on the chart.
The sample
243 trades: 53 won, 189 lost, 1 still open. That last one is a live censored observation, contributing to the risk set at every bar it has survived and nothing to either outcome count, because its outcome is genuinely undecided. Of the 242 decided trades, 53 won, a win rate of 21.9%, the "22%" from the opening paragraph. The median holding time is 7 bars.
The open position, and why conditioning is not cosmetic
The position has been running for 10 bars. Given that, the panel puts the chance of reaching target within the next ten bars at 18.18% and of being stopped out at 33.33%; 107 trades in this sample reached that age. The trade is roughly 1.8 times more likely to die than to reach target over the window, and against a target worth 4.0 ATR and a stop costing 1.5 ATR those figures do not settle whether to hold. They cannot: that needs the unrealised result and the distance left to each level.
Now compare that against the first row of the aging block. A trade of the same strategy that has only just come through its opening bar has 6.28% over the ten that follow. The trade in front of you, which has done nothing except survive, has 18.18%. Neither number is wrong; they answer different questions.
The aging block is where the mechanism becomes visible:
- at entry, 6.28% over the next ten bars, risk set 243
- at bar 3, the first quartile of holding time, 12.92%, risk set 185
- at bar 7, the median, 18.10%, risk set 132
- at bar 16, the third quartile, 13.56%, risk set 67
Read the first row with the convention from the previous section in mind: it describes a trade that has survived its opening bar, not one at the instant of entry. That is not academic here. Twenty of the 243 trades have a duration of zero, opened and closed inside one H4 bar, and every one of them is a loss.
The probability rises steeply and then falls back. The tight 1.5 ATR stop is the obvious candidate for the rising half: it kills most trades early, so reaching bar three selects against the entries that were going to fail immediately. Whether that amounts to the breakout working is more than these curves support, since the survivors at bar three mix trades well on their way with trades that have simply not moved. None of the shape is visible in a win rate, and none of it is a causal account of why it is there.

Fig. 5. The aging profile behind the four rows above. The conditional chance of reaching target within ten bars climbs from 6.28% at entry to 18.10% at the median, then falls back over a risk set thin enough that the fall is within the sampling error.
The hazard at this bar row, 6.54%, is the raw quantity underneath: of the 107 trades that reached bar 10, seven resolved exactly there. Single-bar hazards are noisy, which is why the panel leads with the ten-bar forward window.
The competing-risks gap
The bottom block is the one to dwell on. By bar 35 the Aalen-Johansen cumulative incidence puts the probability of having reached target at 17.82%. The naive estimator, the one that treats every stopped-out trade as censored, puts it at 50.98%, overstated by 186.1%, very nearly triple.
Bar 35 is not arbitrary. It is the last bar at which at least 20 trades were still at risk, which is what InpMinAtRisk asks for, and the panel prints that count beside the heading so the figure can be checked. The existence of the gap and its direction are guaranteed by construction; what this sample fixes is its size. How much larger it is than sampling error alone accounts for is measured at the end of this section.
The last row shows what happens if you ignore that discipline. Read at bar 99, the end of the fitted curve, the naive estimator reports 100.00%: every trade this strategy opens will eventually reach its target, in a sample where 189 of 243 have already been stopped out. By the final event bar the risk set has thinned to one trade, that trade was a winner, and with losses removed as "censored" the wins-only curve drops to zero.
Those two readings are two different failures:
- 186.1% at bar 35 is the competing-risks bias. It is systematic, it always runs upward, and because it is a property of the estimator rather than of the sample size, it does not go away with more data. The figure is this sample's; the sign is not.
- 100.00% at bar 99 is tail degeneracy. A small-sample artefact afflicting every survival estimator in its right-hand tail, and it goes away the moment you refuse to read the curve where the risk set has emptied.
The first is the point of this article. The second is the reason the panel prints a risk set beside every figure.
How much of this is noise
Every figure above is a point estimate, and two decimals on a probability read from twenty surviving trades look like precision the sample cannot supply. The library answers that even though the panel does not print the answer. Greenwood's formula gives the error of the survival curve; Aalen's gives the error of a cumulative incidence under competing risks, and since conditioning only re-bases the same increments, one routine serves the conditional figures too, from a different starting bar.
//+------------------------------------------------------------------+
//| Aalen variance of the incidence gained over [from, to], given    |
//| survival past from-1.                                            |
//|                                                                  |
//|  Three terms: the variance of the survival weight, the binomial  |
//|  variance of the cause-specific jumps, and the covariance of     |
//|  the two. Conditioning only re-bases the same increments, so     |
//|  from=0 gives the plain cumulative incidence and from=bar+1      |
//|  the conditional figure, out of one routine.                     |
//+------------------------------------------------------------------+
double CSurvival::IncidenceVar(const int from,const int to,
                               const int cause) const
  {
   if(m_count<=0 || from<0 || to<from)
      return(0.0);
   const int hi=(to>m_dmax ? m_dmax : to);
   if(from>hi)
      return(0.0);
   const double base=SurvivalAt(from-1);
   if(base<=0.0)
      return(0.0);

//--- pass one: the total the deviations below are measured against.
   double f_end=0.0;
   for(int t=from;t<=hi;t++)
     {
      const int n=m_at_risk[t];
      if(n<=0)
         continue;
      f_end += (SurvivalAt(t-1)/base)*(double)EventsAt(t,cause)/(double)n;
     }

//--- pass two: accumulate the three terms.
   double f=0.0,v_surv=0.0,v_jump=0.0,cov=0.0;
   for(int t=from;t<=hi;t++)
     {
      const int n=m_at_risk[t];
      if(n<=0)
         continue;
      const int    d_all=m_d_win[t]+m_d_loss[t];
      const int    d_k  =EventsAt(t,cause);
      const double s_pre=SurvivalAt(t-1)/base;

      f += s_pre*(double)d_k/(double)n;
      const double gap=f_end-f;

      if(d_all>0 && n>d_all)
         v_surv += gap*gap*(double)d_all/((double)n*(double)(n-d_all));
      if(d_k>0)
        {
         v_jump += s_pre*s_pre*(double)(n-d_k)*(double)d_k
                   /((double)n*(double)n*(double)n);
         cov    += gap*s_pre*(double)d_k/((double)n*(double)n);
        }
     }

   const double v=v_surv+v_jump-2.0*cov;
   return(v>0.0 ? v : 0.0);
  }
The interval is taken on the log-log scale, since a plain Wald interval on these risk sets runs outside zero and one.
CI = F ^ exp( +/- z * SE / (F * ln F) )
Applied to the run in Fig. 4, at the same snapshot, with z at 1.96:
| Figure | Estimate | Std. error | 95% interval | Risk set |
|---|---|---|---|---|
| Reached target by bar 35, competing risks | 17.82% | 2.46 | 13.29 - 22.89 | 20 |
| Reached target by bar 35, losses censored | 50.98% | - | - | 20 |
| Survival at bar 35 | 7.07% | 1.65 | - | 20 |
| P(target) within 10, open position at age 10 | 18.18% | 3.88 | 11.32 - 26.34 | 107 |
| P(stop) within 10, open position at age 10 | 33.33% | 4.74 | 24.28 - 42.63 | 107 |
| Aging, age 0 | 6.28% | 1.62 | 3.60 - 9.98 | 243 |
| Aging, age 3 | 12.92% | 2.57 | 8.41 - 18.43 | 185 |
| Aging, age 7 | 18.10% | 3.57 | 11.72 - 25.59 | 132 |
| Aging, age 16 | 13.56% | 4.46 | 6.34 - 23.52 | 67 |
That settles two arguments and undermines a third. The naive 50.98% sits about thirteen standard errors above the correct estimate, so the competing-risks gap is not a sampling artefact. The interval at age 0 does not overlap the one at age 10, so conditioning survives the check. But age 16 spans 6.34 to 23.52, covering every figure from age 3 up, so the decay past the median is this sample's shape rather than an established one. The two live-position rows are a closer call: their intervals touch, though overlapping marginal intervals are not a test of a difference.
Edge Cases and Pitfalls
Watch the risk set, not the percentage. The bar-99 reading above is the whole warning. The panel prints the trade count behind every figure and reddens the row when it falls below InpMinAtRisk. A probability from four remaining trades is arithmetic, not evidence. The panel prints no interval by choice; when a figure is about to carry weight, take the standard error from the library.
What the model does not know. Every conditional figure divides by the survival after the current bar, so at age zero it describes a trade which has survived its opening bar. Size is invisible, a 0.01 lot trade and a 10 lot trade being one observation each. And two assumptions are never tested: that censoring is uninformative, which holds here because the cutoff is one fixed moment applied to every position alike, and that trades of the same age are comparable, which a hazard falling away after the median would also look like on a mixture of fast and slow populations.
The panel describes one open position. It reports the age of the first position it finds on this symbol carrying the selected magic: exact for the demonstration Expert, arbitrary for a program running several at once.
The demonstration is a demonstration. 243 trades over five years is enough to make the machinery work and the competing-risks gap unambiguous, but it is not a study of a strategy. The figures would move on a different symbol, period, or stop-to-target ratio.
A completed backtest contains almost no censoring. When a test finishes every trade has resolved, so the censored category holds at most the position left open at the end. A paused visual run is different: the cutoff is a real moment mid-history and the open position is censored exactly as it would be live, which is what Fig. 4 shows.
Pool strategies at your peril. The default magic filter pools every trade on the account into one curve, and if those trades come from strategies with different holding-time profiles the curve describes none of them.
The lookback window filters on entry time. InpLookbackDays selects trades by when they were opened, so a position running longer than the window disappears rather than appearing as censored. On a strategy that holds for weeks, set it generously or leave it at zero. This is the one place the sample goes selectively wrong rather than merely thin, since the trades most likely to fall outside it are the longest-lived.
A horizon that runs off the end of the curve reads as zero, not as unknown. Every lookup past the longest duration returns the curve's final value, so a conditional probability asked near that end has almost no incidence left to gain. That is the sample having nothing further to say, not the trade being unlikely to reach target. Keep InpHorizon well inside the reliable range.
Durations are in bars of the chart you attach to. The same history analysed on H1 and on H4 produces different numbers. That is intended, since the answer has to be usable against a bar counter on the chart, but a median of seven only means something once you know seven of what.
The bar count has a fallback that is not a bar count. When Bars() returns zero, on a symbol whose history is not built yet, SurvBarsBetween divides the interval by the period length instead, which charges the trade for weekends again. Let the history load before trusting a curve fitted the instant the panel is attached.
A flat close counts as a loss. The two terminal categories have to partition the outcomes, and a trade closing at break-even did not reach its target. Worth knowing on a strategy that frequently scratches positions.
Netting reversals are approximated. On a netting account, reversing a position produces a DEAL_ENTRY_INOUT deal that closes one exposure and opens the opposite under the same position id. The reader treats the last exit deal as the end of the trade, so such a position is timed from its original entry to its final exit rather than split in two. A position also takes its magic number from its first entry deal, so where two strategies add to the same netting exposure the whole position is filed under whichever traded first. On a hedging account every position has its own id.
Watch the cost on a large account. Every rebuild selects the whole deal history, rebuilds fire on every new bar, and each lookup that misses the index cache costs a linear scan. On a few hundred trades this is imperceptible; on tens of thousands of deals, raise the refresh gate or narrow the symbol filter first.
Missing early history is reported, not hidden. A closes predating history row means some closing deals had no matching opening deal, usually because the broker has trimmed the account's records, so the curves describe a more recent population than you asked for.
Conclusion
We started from a question a win rate cannot answer, and finished with a panel that answers it from your own trade history.
- Conditioning is the whole point. On the demonstration run a trade one bar old had 6.28% over the following ten bars and a ten-bar-old one had 18.18%. Dividing the forward incidence by the survival at the current bar turns a statement about the average trade into one about the trade in front of you.
- A loss is not censoring, and the bias only runs one way. Wins and losses are competing terminal events; only a position still open at the cutoff has left observation undecided. Treating stopped-out trades as censored hands them the futures of the survivors, so the naive estimate is never smaller than the correct one: at the last bar the risk set could support, 50.98% against a correct 17.82%.
- Every curve is unreliable in its tail. That is a separate failure from the bias, and the fix is a discipline rather than a formula: quote no figure without the risk set it came from, and stop reading where the risk set runs out. The library will also hand you a standard error, and on this run the interval at bar 16 covers half the aging block.
- Measure in bars, and treat open positions as data. A weekend is not exposure. Passing the current time as the cutoff makes live positions censored observations, which is the half of Kaplan-Meier a completed backtest can never exercise.
- The panel describes, it does not instruct. Probabilities estimated from your history are one thing; a rule that converts them into an exit is a forecast, and a much weaker one. These curves condition on age and nothing else, so the distance left to each level, the unrealised result and the state of the market are outside them by construction.
If you take one thing from this article, take the two adjacent lines in the sweep that differ by a single identifier, and remember which one people write by accident.
Getting the Source Code via MQL5 Algo Forge
All source files are attached to this article below, but the full repository is also available on MQL5 Algo Forge, the community's Git-based platform for sharing and collaborating on trading projects.
| File name | Description |
|---|---|
| MQL5\Include\Survival\SurvivalTypes.mqh | Shared vocabulary: the three-outcome enum, the observation structure, and the bar-counting duration measurement |
| MQL5\Include\Survival\SurvivalCore.mqh | CSurvival: Kaplan-Meier survival, Aalen-Johansen cumulative incidence, hazard, the naive comparison curve, risk sets, quantiles, conditional probabilities, and the Greenwood and Aalen standard errors behind them |
| MQL5\Include\Survival\TradeHistory.mqh | CTradeHistoryReader: joins deals into positions on POSITION_ID and censors them at a cutoff, so open positions become censored observations |
| MQL5\Indicators\Survival\SurvivalPanel.mq5 | The chart panel: sample composition, conditional probabilities for the open position, the aging profile, and the competing-risks gap |
| MQL5\Experts\Survival\SurvivalDemo.mq5 | Donchian breakout Expert Advisor that generates a trade history and embeds the panel as a resource |
Warning: All rights to these materials are reserved by MetaQuotes Ltd. Copying or reprinting of these materials in whole or in part is prohibited.
This article was written by a user of the site and reflects their personal views. MetaQuotes Ltd is not responsible for the accuracy of the information presented, nor for any consequences resulting from the use of the solutions, strategies or recommendations described.


