

Weibull Reliability Analysis for Strategy Lifespan: Estimating When an EA Is Likely to "Fail"
 122
 0

Contents
- Introduction
- Defining "failure" for a trading strategy
- The Weibull fit: CWeibullReliability in code
- Reading the shape parameter
- Wiring the governor into the EA
- The reliability indicator
- On comment formatting and why it matters here
- Testing notes and honest limitations
- What this does and doesn't prove
- Conclusion
Introduction
Most EAs die from something quieter than a blown stop loss. The parameter set that worked for eight months starts giving back a little more each week, the equity curve flattens, and by the time anyone notices the profit factor has been below 1 for a month. The question this article answers is a mechanical one: given the trades a strategy has already survived, what is the probability it survives the next N trades before its performance crosses a floor you define?
A note on scope before diving in: this is an implementation article and a single-instrument case study - it shows how to build a native Weibull reliability layer in MQL5 and what one real backtest produced. It is not a validation study proving the approach improves trading results; that distinction matters enough to flag upfront, and the "What this does and doesn't prove" section further down covers it in full.
That is exactly the question reliability engineering asks about hardware, the "how long until this part wears out" question, and the tool built for it is the Weibull distribution. We are not borrowing the name for flavor; we implement the actual maximum-likelihood estimator natively in MQL5, wrap it in a class, and hang a small governor off an ordinary EA that watches its own rolling performance and asks the fitted model for a survival probability before every new trade.
Three files come out of this: WeibullReliability_Core.mqh (the fitter and the reliability/hazard math), WeibullReliability_EA.mq5 (a plain EMA-cross system carrying the governor), and WeibullReliability_Ind.mq5 (a subwindow indicator that plots the live R(t) and h(t) curves). The code is the point of this article, so most sections below lead with a snippet and explain it inline rather than describing it first in prose and showing it after.
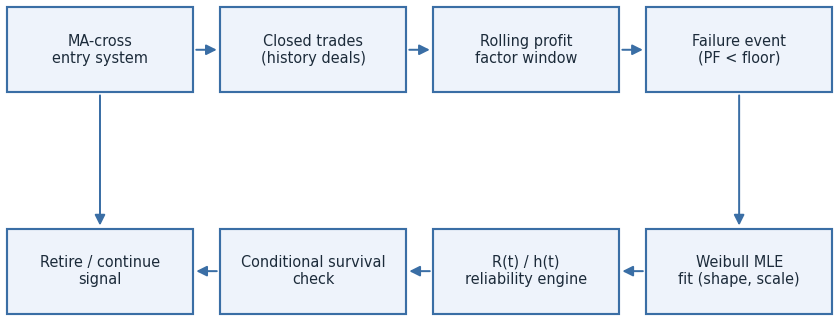
Fig. 1. Data flow through the reliability governor - entries feed closed trades into a rolling profit-factor window, a crossing of the floor logs a failure, and the fitted Weibull curve feeds a retire/continue decision back to the entry logic.
Defining "failure" for a trading strategy
A Weibull fit needs a population of lifetimes - numbers, one per completed unit, each saying how long that unit lasted before it failed. For a machine part that's hours of operation. For a strategy we chose trades survived before the rolling profit factor drops below a floor, because it is available directly from trade history and does not need equity-curve smoothing.
//--- Rolling profit factor over the last InpRollingWindow trades
double RollingProfitFactor()
  {
   int size = ArraySize(g_trade_profits);
   if(size<InpRollingWindow)
      return(-1.0);        // not enough trades yet to judge, caller must check for this

   double gross_profit=0.0,gross_loss=0.0;

   for(int i=size-InpRollingWindow;i<size;i++)
     {
      if(g_trade_profits[i]>=0.0)
         gross_profit += g_trade_profits[i];
      else
         gross_loss += -g_trade_profits[i];
     }

   if(gross_loss<=0.0)
      return(gross_profit>0.0 ? 99.0 : 1.0);   // no losses in the window, cap the ratio

   return(gross_profit/gross_loss);
  }
Every closed deal from history that matches this EA's magic number and symbol lands in g_trade_profits[], and RollingProfitFactor() reads only the last InpRollingWindow of them. When that ratio drops below InpFailureFloor, we've found a failure - the current run's age in trades gets logged as one lifetime observation, and the age counter resets to zero for the next run:
//--- Detect a "failure" event: rolling metric crosses below the floor
void CheckForFailureEvent()
  {
   double pf = RollingProfitFactor();

   if(pf<0.0)
      return;        // not enough history in the window yet

   if(pf<InpFailureFloor && g_trades_since_reset>0)
     {
      reliability.AddLifetime(g_trades_since_reset,pf);
      PrintFormat("Failure event logged -> lifetime=%d trades, rolling PF=%.2f",
                  g_trades_since_reset,pf);

      g_trades_since_reset = 0;
      g_failures_since_fit++;

      //--- clear the rolling window itself, not just the age counter -
      //--- otherwise the next single trade re-tests almost the same
      //--- 20-trade window and immediately re-triggers a false failure
      ArrayResize(g_trade_profits,0);

      if(g_failures_since_fit>=InpRefitEveryFail)
        {
         reliability.FitMLE(InpMinLifetimes);
         g_failures_since_fit = 0;
        }
     }
  }
That ArrayResize() line is not cosmetic - skipping it would silently break the estimator. Resetting only g_trades_since_reset after logging a failure, without also clearing the window, leaves the rolling profit-factor window untouched. Since that window reads the last 20 trades from the entire trade history, a single new trade barely moves it, so the very next trade would re-test almost the same losing window and re-trigger another "failure" one trade later. That pattern produces a Weibull fit dominated by degenerate lifetime=1 observations (shape well below 1, median life under 2 trades) that describes the reset logic, not the strategy. Clearing the window on every failure forces each new lifetime to accumulate a genuinely fresh 20-trade sample before it can fail again, which is what makes the fit in the next section coherent.
The Weibull fit: CWeibullReliability in code
The class carries three pieces of math: the score equation that the shape parameter must satisfy at the maximum-likelihood solution, a Newton-Raphson root-finder for it, and the closed-form scale that falls out once the shape is known.
//--- MLE score function for the shape parameter (root at MLE solution)
//--- g(beta) = [sum(t^b * ln t)/sum(t^b)] - 1/b - mean(ln t) = 0
double CWeibullReliability::ScoreFunction(const double beta,const double &t[],const int n)
  {
   double sum_tb=0.0,sum_tb_lnt=0.0,sum_lnt=0.0;

   for(int i=0;i<n;i++)
     {
      double lnt = MathLog(t[i]);
      double tb  = MathPow(t[i],beta);
      sum_tb     += tb;
      sum_tb_lnt += tb*lnt;
      sum_lnt    += lnt;
     }

   if(sum_tb<=0.0)
      return(0.0);

   return((sum_tb_lnt/sum_tb)-(1.0/beta)-(sum_lnt/n));
  }
We deliberately did not hand-derive the analytic second derivative for Newton-Raphson. A central-difference numeric derivative is four lines, easy to verify by eye, and just as stable for a one-dimensional root find:
//--- Numeric derivative of the score function (central difference)
//--- Used instead of the analytic Hessian for robustness and clarity
double CWeibullReliability::ScoreDerivative(const double beta,const double &t[],const int n)
  {
   double h = 0.001*beta+1.0e-6;
   double f_plus  = ScoreFunction(beta+h,t,n);
   double f_minus = ScoreFunction(beta-h,t,n);

   return((f_plus-f_minus)/(2.0*h));
  }
The fit itself iterates, clamps the step to a sane range so one bad iteration can't send beta to infinity, and only accepts the result once the step size has converged below tolerance:
double beta = 1.0;
bool   converged = false;

for(int iter=0;iter<max_iterations;iter++)
  {
   double g  = ScoreFunction(beta,t,m_count);
   double gp = ScoreDerivative(beta,t,m_count);

   if(MathAbs(gp)<1.0e-10)
      break;

   double step    = g/gp;
   double new_beta = beta-step;

   //--- clamp to a sane search range so a bad step cannot diverge
   if(new_beta<0.05)
      new_beta=0.05;
   if(new_beta>10.0)
      new_beta=10.0;

   if(MathAbs(new_beta-beta)<tolerance)
     {
      beta = new_beta;
      converged = true;
      break;
     }

   beta = new_beta;
  }
The step clamp above keeps a single bad iteration from sending beta to infinity.
Reading the shape parameter
Once FitMLE() converges, everything downstream is three formulas:
//--- Reliability function R(t) = P(lifetime > t)
double CWeibullReliability::Reliability(const double t) const
  {
   if(!m_fitted || t<0.0)
      return(1.0);

   return(MathExp(-MathPow(t/m_scale,m_shape)));
  }

//--- Instantaneous hazard rate h(t)
double CWeibullReliability::Hazard(const double t) const
  {
   if(!m_fitted || t<=0.0)
      return(0.0);

   return((m_shape/m_scale)*MathPow(t/m_scale,m_shape-1.0));
  }
The shape parameter, beta, tells you what kind of failure you're dealing with. Below 1, the hazard falls with age: the strategy fails early or not at all, "infant mortality," usually a parameter set that never fit the instrument to begin with. Near 1, failures are memoryless, a flat hazard, no real aging at all. Above 1, hazard rises with age, and that's genuine wear-out, the case this whole exercise is built for. Fig. 2 below isn't a hypothetical. It's the actual fit from a Strategy Tester run of the EMA-cross EA on XAUUSD M5 (MetaQuotes-Demo, real ticks, early 2023 to 2026.09, a little over three and a half years), which converged to shape=5.34, scale=23.36 trades.
Two things about that number matter. The fit uses only the 8 completed failures, not the long failure-free stretches in between, so it is a maximum likelihood estimate for completed failures rather than for the strategy's whole observed history. And it comes from a very small sample, so it is worth treating as exactly that (the "What this does and doesn't prove" section further down goes into why).
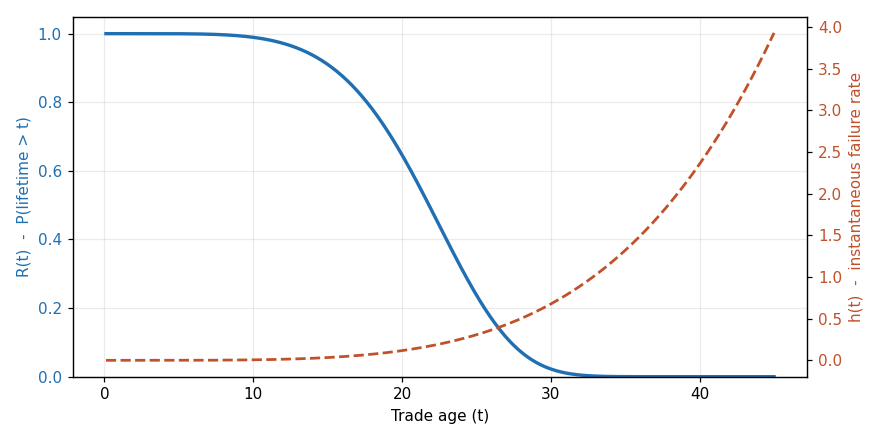
Fig. 2. Real reliability and hazard curves from an actual backtest fit (shape = 5.34, scale = 23.36 trades) - reliability holds near 1.0 out past trade 10, then collapses sharply right around the median life of ~22 trades, while hazard rises steeply in the same window.
Retirement decisions use conditional survival, not raw R(t), because a strategy already 40 trades old shouldn't be judged against the odds of surviving from zero:
//--- P(survive another 'horizon' trades | already survived 'age')
double CWeibullReliability::ConditionalSurvival(const double age,const double horizon) const
  {
   if(!m_fitted)
      return(1.0);

   double r_age = Reliability(age);
   if(r_age<=0.0)
      return(0.0);

   return(Reliability(age+horizon)/r_age);
  }
Wiring the governor into the EA
The EA itself is an ordinary EMA cross - the point of the article is the layer sitting on top of it, not the entry signal. Every new bar runs a short fixed sequence, each step a single function call so OnTick() reads like a table of contents for the whole system:
//--- Expert tick function
void OnTick()
  {
//--- only act once per new bar, this is a swing-style system
   if(!IsNewBar())
      return;

//--- pull any newly closed deals into the rolling trade-profit buffer
   UpdateClosedTradesBuffer();

//--- recompute the rolling metric and test it against the failure floor
   CheckForFailureEvent();

//--- ask the reliability engine whether the strategy should be retired
   UpdateRetirementState();

//--- re-arm the strategy once the cooldown has elapsed
   ApplyRetirementCooldown();

//--- publish live state for the companion indicator
   PublishGlobalVariables();

   if(g_retired)
      return;

   ManageOpenSignal();
  }
The position check that gates new entries is scoped to this EA's own magic number and symbol, not just "is anything open":
//--- True if this EA already has an open position on its own symbol
//--- Scoped to symbol + magic number so other EAs / manual trades on
//--- the same chart are never mistaken for this system's position
bool HasOwnOpenPosition()
  {
   int total = PositionsTotal();

   for(int i=0;i<total;i++)
     {
      ulong ticket = PositionGetTicket(i);
      if(ticket==0)
         continue;

      if(PositionGetString(POSITION_SYMBOL)!=_Symbol)
         continue;
      if(PositionGetInteger(POSITION_MAGIC)!=InpMagic)
         continue;

      return(true);
     }

   return(false);
  }
And the retirement check that converts a fitted curve into an action is nothing more than reading ConditionalSurvival() against a floor:
void UpdateRetirementState()
  {
   if(!reliability.IsFitted())
     {
      g_retired = false;
      return;
     }

   double survival = reliability.ConditionalSurvival(g_trades_since_reset,InpHorizonTrades);

   if(survival<InpSurvivalFloor)
     {
      if(!g_retired)
         PrintFormat("Retirement signal -> P(survive next %d trades | age %d) = %.1f%% (floor %.1f%%)",
                     InpHorizonTrades,g_trades_since_reset,survival*100.0,InpSurvivalFloor*100.0);
      g_retired = true;
     }
   else
      g_retired = false;
  }
A permanent retirement is too blunt for a backtest spanning years - one bad two-month stretch would end the run for good, leaving every subsequent year of the test producing zero data regardless of how the strategy actually performed. ApplyRetirementCooldown() gives it a way back in after sitting out for a fixed number of bars:
//--- Give a retired strategy a fresh attempt after sitting out for
//--- InpRetireCooldownBars bars, instead of stopping the run forever
void ApplyRetirementCooldown()
  {
   if(!g_retired)
     {
      g_bars_since_retired = 0;
      return;
     }

   g_bars_since_retired++;

   if(g_bars_since_retired>=InpRetireCooldownBars)
     {
      PrintFormat("Re-arming after %d cooldown bars -> giving the strategy a fresh attempt",
                  g_bars_since_retired);
      g_retired            = false;
      g_trades_since_reset = 0;
      g_bars_since_retired = 0;

      //--- clear the rolling window here too - re-arming with a stale
      //--- pre-retirement window reproduces the exact same false-failure
      //--- pattern a missing window reset produces
      ArrayResize(g_trade_profits,0);
     }
  }
Age counter and rolling window travel together everywhere else in this class, and a re-arm path is exactly the kind of second reset point that's easy to overlook while writing the code: skip it there, and the window and counter drift out of sync, producing a fit that describes the reset logic instead of the strategy.
The reliability indicator
The indicator has no access to the EA's internal CWeibullReliability instance, so the EA publishes shape, scale, current age and a fitted flag through global variables once per new bar, and the indicator reads them back:
//--- Publish live parameters for the reliability indicator to read
void PublishGlobalVariables()
  {
   GlobalVariableSet("WRA_Shape",reliability.Shape());
   GlobalVariableSet("WRA_Scale",reliability.Scale());
   GlobalVariableSet("WRA_Age",(double)g_trades_since_reset);
   GlobalVariableSet("WRA_Fitted",reliability.IsFitted() ? 1.0 : 0.0);
  }
On the indicator side, each bar back from the current one is treated as one trade-age unit less, a display simplification since bars and trades don't advance at the same rate:
//--- each bar back from the current one is treated as one unit less of trade-age;
//--- this is a display simplification (bars are not literally trades), and is
//--- called out explicitly in the article rather than presented as literal
for(int shift=0;shift<rates_total;shift++)
  {
   double age_at_shift = age-(double)shift;

   if(age_at_shift<0.0 || age_at_shift>InpMaxAgeShown)
     {
      BufferReliability[shift] = EMPTY_VALUE;
      BufferHazard[shift]      = EMPTY_VALUE;
      continue;
     }

   BufferReliability[shift] = ReliabilityAt(age_at_shift,shape,scale);
   BufferHazard[shift]      = HazardAt(age_at_shift,shape,scale);
  }
On comment formatting and why it matters here
One convention worth naming since the snippets above use it throughout: a block comment (//---, on its own line above the code it introduces) announces a phase of logic, while an inline comment (// at the end of a line) explains one specific value or edge case. The first-level block comment in any function sits flush to column zero regardless of the function's own indentation; nested ones line up with the brace depth of the code they describe.
Testing notes and honest limitations
Fig. 3 shows the actual 8 lifetimes this run produced, plotted against the fitted curve they came from - not a histogram, deliberately: binning 8 points into bars would visually imply more data than exists. The real values, straight from the exported CSV, were 20, 21, 20, 22, 20, 20, 31, and 20 trades. Seven of the eight cluster tightly at 20-22 trades, with one outlier at 31 - that tight cluster is exactly why the fitted shape came out so high (5.34) rather than a milder wear-out curve. That cluster also needs a cautious reading: with a 20-trade rolling window, a failure cannot register before 20 trades exist, so 20 is the smallest lifetime the detector can report. Five of the eight values sit exactly on that floor, and Weibull is a continuous model fed discrete counts full of ties, so part of the high shape is the detector's design rather than evidence of wear-out.
An offline bootstrap of the same 8 values (5,000 resamples, not part of the EA) shows how loose the numbers are. The 95% percentile interval for the scale is roughly 20.3 to 26.7 trades. For the shape it runs from about 4.8 to well above 40, and roughly a third of the resamples land beyond the EA's upper clamp of 10. Read the shape as "clearly above 1, otherwise unpinned".
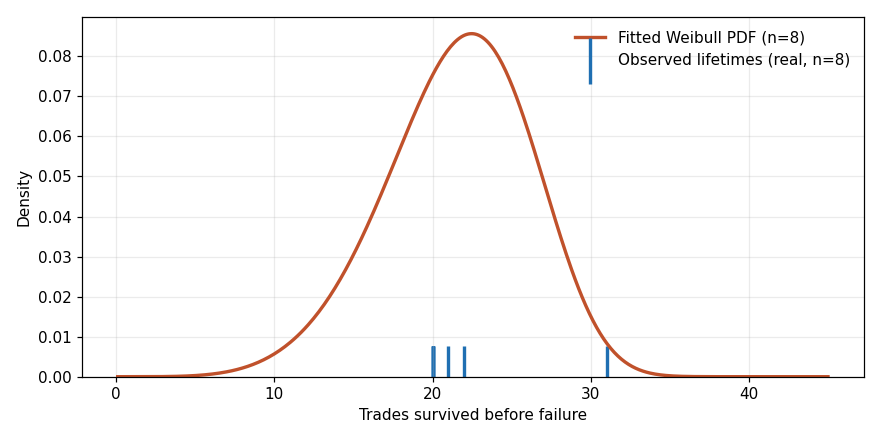
Fig. 3. The 8 real lifetimes from a 3.5-year XAUUSD M5 backtest (MetaQuotes-Demo, real ticks), marked as tick lines against the Weibull PDF fitted to that exact data - not a simulated or illustrative sample.
The full timeline matters more than the fitted numbers alone: those 8 failures were logged between January and March 2023, and then the strategy traded cleanly for the next three and a half years - the rolling profit factor never dropped below the floor again until a second retirement signal fired on 2026.08.31. The governor put it in cooldown, re-armed it on 2026.09.03, and the backtest simply ended three days later before a ninth failure (or a stretch of renewed success) had time to register. That's not a bug - it's the cooldown mechanism working as designed, on the edge of the available history. A longer test window past September 2026 would either confirm this second episode as another real wear-out cluster or show the strategy recovering again.
A few things worth keeping in mind before you run this on your own account. n=8 is exactly InpMinLifetimes, the minimum the code will even attempt a fit on, so it's not a robust sample, and three-plus clean years afterward don't add to that count; they just confirm the governor didn't fire false positives during that stretch. A shape of 5.34 from eight points is a striking, internally consistent signal, but it is a preliminary reading, not a validated one. Treat it as "this deserves a longer run to confirm," not as a settled number for this strategy on this instrument. The failure floor itself (rolling profit factor under 1.0 over a 20-trade window) is a design choice, not a law, so pick a floor that matches how much underperformance you're actually willing to tolerate before calling a run "failed".
One implementation detail: the rolling window has to be cleared both when a failure is logged and when the cooldown re-arms the strategy. Skipping either one lets a stale pre-reset window combine with a handful of fresh trades, producing degenerate single-digit lifetime readings that describe the reset logic rather than the strategy - worth checking in any implementation using the same pattern. And because a fresh Weibull fit needs multiple completed lifetimes, a strategy that has only failed once or twice will report IsFitted() == false and the governor will simply do nothing, by design, since a curve fit to one or two points is not a curve worth trusting.
What this does and doesn't prove
The numbers above deserve a clear-eyed look at what they actually establish, since a fit that converges cleanly can look more convincing than the underlying evidence supports.
The sample is thin, and the shape reading could be an artifact. Eight lifetimes is exactly the minimum the code will attempt a fit on. A shape of 5.34 from eight points is internally consistent with the data it came from, but "internally consistent" and "true property of this strategy on this instrument" are not the same claim. It could equally be a signature of that particular slice of 2023 gold price action, of the specific window/floor/reset choices below, or of the EMA-cross entry rule itself, rather than a general law about how this strategy ages. The accurate label for what Fig. 2 and Fig. 3 show is "the fit this data produced," not "the wear-out curve of this strategy."
"Failure" is a constructed event, not a physical one. A machine part failing is close to unambiguous. What this code calls a failure - rolling profit factor under 1.0 over the last 20 trades - is a threshold on a metric that is itself sensitive to window size, the floor value, and how the buffer gets reset. That sensitivity isn't theoretical: the fitted distribution changes shape entirely depending on whether a stale window carries over across a reset. In practice, the Weibull fit here models the time until an engineered metric crosses an engineered threshold, which is a narrower and more fragile claim than "time until the strategy stops working."
This may be solving a harder problem than it needed to. A rolling profit factor with a hard floor, wrapped in a Weibull fit, is one way to flag decay. Simpler alternatives - rolling expectancy, a drawdown-slope filter, CUSUM or Page-Hinkley change-point detection, a plain pause after N consecutive losers - address the same underlying question with far fewer moving parts and far less sensitivity to reset logic. This article doesn't show that the Weibull layer outperforms any of them. It shows that the layer can be built and that it runs. Those are different claims, and only the second one is demonstrated here.
Trade count is a weak stand-in for time. Twenty trades can close in two days of a volatile session or two months of a quiet one, and the market regime underneath can be completely different between those two cases. Reliability engineering usually has a real physical clock - operating hours, load cycles. This code doesn't; it counts closed trades. Bars, elapsed trading hours, or a volatility-normalized exposure measure would all be more defensible time axes than raw trade count, and none of them are what's implemented here.
Weibull assumes a shape the market has no obligation to follow. A single smooth hazard curve is a real modelling choice, not a neutral default. Strategies can also fail through regime switches, clustered losses, or a return to form after conditions change - failure structures a two-parameter Weibull was never built to describe. Nothing in this codebase tests whether Weibull is actually the right family for this data against, say, a log-normal or a piecewise hazard; it simply fits the one distribution it was built to fit.
There's no evidence the governor improves anything. This is the biggest gap, and it's a gap this article has, not a criticism of the idea in general. Showing that a curve can be fit and that a retire/continue signal can be computed from it is not the same as showing that a strategy running with the governor attached comes out ahead of the same strategy without it - on net profit, drawdown, recovery factor, or any other measure - across an out-of-sample period. That comparison was not run here. Until it is, "the governor works" means "the code executes correctly," not "the governor helps."
A noisy binary switch can hurt as much as help. As shipped, retirement is on/off: the strategy trades at full size or not at all. Meta-filters built this way have a well-known failure pattern of their own - they look clean in a backtest and then, live, switch a system off right before it recovers, because a temporary rough patch and genuine decay look identical from inside a 20-trade window. A softer response - scaling position size down in tiers as survival probability falls, rather than cutting to zero - would be less exposed to that failure mode, but that's a design change this code doesn't make.
Seven governor inputs are a second layer that can itself overfit.InpRollingWindow, InpFailureFloor, InpRefitEveryFail, InpMinLifetimes, InpHorizonTrades, InpSurvivalFloor, and InpRetireCooldownBars is a real amount of surface area sitting on top of the two-parameter entry system underneath it. Tuning those seven against the same history used to judge the result is exactly how a monitoring layer ends up more overfit than the strategy it's supposed to be monitoring. None of them were optimized for this article - they're the first sensible-looking defaults - but that's also exactly why the shape=5.34 result should be read as a demonstration, not a claim.
Profit factor over 20 trades is a noisy instrument. A couple of oversized winners or losers can swing it sharply on an instrument like XAUUSD, independent of anything resembling genuine strategy decay. Rolling expectancy, a hit-rate-and-payoff decomposition, or an ulcer-index-style drawdown measure would all be steadier inputs to a failure detector than raw profit factor, and swapping the metric is a smaller change than it might sound like, since RollingProfitFactor() is the only function that would need to change.
Only failures are counted; survival is thrown away. Every lifetime in this dataset ends in a logged failure. The three and a half clean years between the first cluster and the second retirement signal contain real information - the strategy was still alive that whole time - and none of it enters the fit. That's a censored-data problem in the reliability-engineering sense: a part still running when the study ends is data, not an absence of data. This code doesn't implement right-censoring, so the estimate describes completed failures only, and a version that did would very likely produce a different, probably less extreme, shape estimate.
One strategy, one symbol, one timeframe. Everything here is EMA 10/40 on XAUUSD M5. That's enough to demonstrate that the estimator, the governor wiring, and the indicator all work correctly end to end, which was the actual goal of this article. It's not enough to claim the approach generalizes to other strategies, instruments, or market conditions.
The lifetimes are not independent, and the detector is part of the result. Successive lifetimes come from one strategy in one stretch of one market, not from identical parts off a production line, so the independence a Weibull fit assumes is not established. The probabilities the code reports are also conditional on the chosen model and the chosen definition of failure; "survival probability" here means survival of a rolling profit factor above 1.0, not survival of the strategy as a business. There is no goodness-of-fit test and no comparison against other families or a nonparametric survival estimate.
Retirement changes the data it learns from. Once the governor switches the strategy off, the trades it would have taken are never observed, and later lifetimes depend on earlier governor decisions. Fitting and controlling on the same data stream without a separate out-of-sample period makes any apparent benefit circular. The physical-wear analogy is also only an analogy: markets have regimes, not worn bearings.
Implementation points worth checking in your own copy. The four global variable names (WRA_Shape, WRA_Scale, WRA_Age, WRA_Fitted) are fixed strings, so two instances on different symbols or magic numbers, or parallel tests in one terminal, overwrite each other; prefix them with symbol and magic before running more than one. After the rolling buffer is cleared, the history scan must only load deals newer than the last one already processed (the EA keeps a last-deal ticket for this), otherwise old trades come straight back. FitMLE() accepts convergence on step size alone and clamps the shape to [0.05, 10.0]; for this data the score function at the solution is about 1e-15 and the shape sits well inside the bounds, but a robust version should also check |g(beta)| and report when a bound was hit.
Finally, if(g_retired) return; skips ManageOpenSignal() entirely, so if you extend that function with trailing stops or other position management, split entry gating from position management, otherwise an open trade is left unmanaged during retirement. The indicator plots trade age against bar shift, which mixes two different axes and should be read as a rough visual cue only.
None of this means the underlying idea is worthless - a native, natively implemented Weibull fitter with correct reset semantics is a real, reusable piece of engineering, and framing it as a strategy-health monitor rather than an entry signal is a genuinely useful way to think about risk overlays. But the fair, direct answer to "does this help you make or keep more money" is: not demonstrated here. What's demonstrated is that the math is implemented correctly, that the reset logic clears the window correctly, and that a real backtest produced a real, if thin, result. Turning that into something a live account should rely on would need at minimum an out-of-sample comparison against a strategy running without the governor, a comparison against at least one simpler decay detector, right-censored lifetimes, and a risk-scaling response in place of the current binary switch.
Conclusion
The three files here separate cleanly. The math lives in WeibullReliability_Core.mqh and knows nothing about trading, the governor logic in the EA knows nothing about maximum likelihood, and the indicator only ever reads published numbers. That separation is what lets you lift the reliability engine out and drop it onto a completely different entry system: the failure definition, the floor, and the rolling window are the only parts tied to a specific strategy's behaviour, and all three are input parameters.
What this article set out to show, and does show: a correctly-implemented native Weibull MLE fitter, a governor wired to it with reset logic that clears the window on both failure and re-arm, and a real fit from a real backtest rather than a synthetic example. What it does not show, and the previous section spells out why: that attaching this governor to a strategy improves its live or out-of-sample results relative to running without it, or relative to a simpler decay detector. Read it as a working diagnostic framework worth extending and testing properly, not as a ready-made edge.
| File | Type | Description |
|---|---|---|
| WeibullReliability_Core.mqh | Include | CWeibullReliability: Newton-Raphson MLE fitter, reliability R(t), hazard h(t), conditional survival, median lifetime. |
| WeibullReliability_EA.mq5 | Expert Advisor | EMA-cross entries wrapped by the reliability governor: rolling PF tracking, failure logging, periodic re-fit, retirement signal, CSV export. |
| WeibullReliability_Ind.mq5 | Indicator | Subwindow plot of live R(t) and h(t) against current trade age, read from the EA's published global variables. |
Warning: All rights to these materials are reserved by MetaQuotes Ltd. Copying or reprinting of these materials in whole or in part is prohibited.
This article was written by a user of the site and reflects their personal views. MetaQuotes Ltd is not responsible for the accuracy of the information presented, nor for any consequences resulting from the use of the solutions, strategies or recommendations described.

 Building a Two-Pole Momentum Oscillator in MQL5
 Building a FIFO-Compliant Position Management Layer for NFA-Regulated MQL5 Accounts
 Features of Experts Advisors
 Uncertainty as a Model (Part 6): Multiple Regression and Diagnostics

- Free trading apps
- Over 8,000 signals for copying
- Economic news for exploring financial markets
You agree to website policy and terms of use