Building a High-Volume Pivot Indicator in MQL5
 127
 0

Introduction
Traditional pivot indicators focus on price structure but do not always distinguish ordinary pivot points from those formed during unusually high trading activity. This can make it difficult to identify pivot areas that may attract greater market attention. To address this limitation, we will build a high-volume pivot indicator. It combines pivot detection with rolling volume analysis and percentile-based normalization. It also uses ATR to scale concentric rings around detected pivots. The resulting indicator can be used to visualize high-volume pivot areas, observe potential reaction levels, and analyze how significant volume interacts with price structure. We will implement the indicator in MQL5. It calculates rolling volume sums, normalizes volume using a percentile reference, detects pivot highs and lows, and uses ATR-based scaling to create the visual elements on the chart.
Project Overview and Implementation Plan
Before implementing the indicator in MQL5, it is important to understand its structure and development process. In this section, we will outline the steps for calculating rolling volume sums, normalizing volume using a percentile reference, detecting high-volume pivot highs and lows, scaling concentric rings using ATR, and displaying the resulting reaction levels and volume labels.
What We Are Building
In this project, we will build a High-Volume Pivot Indicator for MetaTrader 5 that identifies confirmed pivot highs and lows and highlights those that meet a selected volume-strength threshold. The indicator will use configurable left and right bar lengths to determine whether a bar forms a confirmed pivot point. A pivot point will not be identified immediately when an extreme is formed. For example, with 15 left bars and 15 right bars, a bar becomes a potential pivot high if its high exceeds the highs of all surrounding bars in that range. The indicator then checks the required number of bars on both sides before confirming the pivot high. The same process applies to pivot lows, where the low must be lower than the surrounding lows.
After confirming a pivot, the indicator evaluates the rolling volume at the confirmation bar. It first calculates a rolling volume sum over a configurable window based on the selected left-bar length. These volume sums are then compared with a 95th-percentile reference calculated from the recent volume history. The resulting ratio is normalized to produce a volume-strength value, which is used to determine whether the corresponding confirmed pivot passes the volume filter.
For each pivot that passes the volume filter, the indicator draws concentric rings around the pivot price. The number and size of these rings are determined by the normalized volume, subject to the configured step value and maximum ring levels, while ATR(500) from the pivot bar is used to scale their vertical size according to market volatility. The indicator also draws a horizontal reaction level from each detected pivot until the closing price crosses that level and displays the volume value from the confirmation bar at the pivot location. Because the pivot is confirmed only after the required right-side bars have formed, these visual elements are drawn retrospectively at the original pivot location. This allows high-volume pivot areas and their subsequent price reactions to be visualized on the chart.
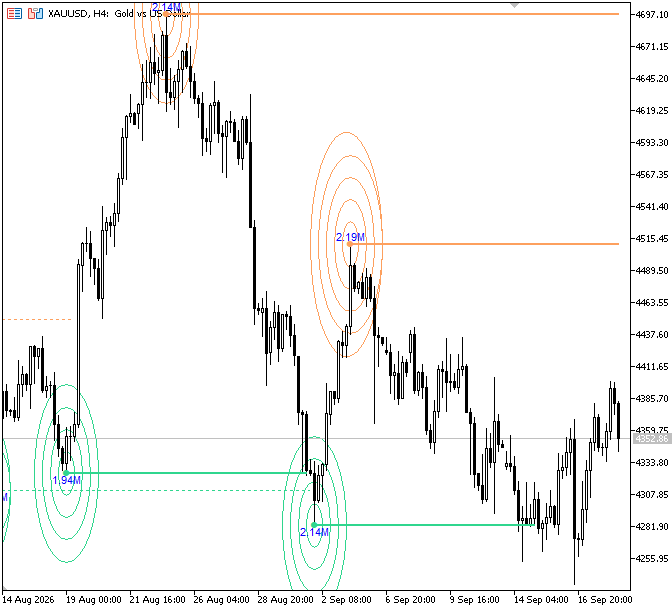
Figure 1. High-Volume Pivots
Implementation Plan
In this section, we will outline the development plan that will be followed in MQL5 before moving into the actual implementation.
1. Configuring the Indicator Structure and Input Parameters
Before calculating volume and detecting pivot points, we first define the basic structure of the indicator and the input parameters that control its behavior.
During this step, we will:
- configure the indicator to operate directly on the main price chart without using indicator buffers or plots;
- define the object prefix used to identify the graphical objects created by the indicator;
- create inputs for the left and right bars used to confirm pivot points;
- add settings for volume type, display range, volume filtering, colors, reaction levels, and ring size;
- define the ATR period and create an ATR handle using iATR();
- release the ATR handle when the indicator is removed.
Note: When real volume is selected, the indicator depends on the symbol providing usable real-volume data. If real volume is unavailable or zero, the calculated normalized volume may also be zero, causing the volume filter to reject the corresponding pivot candidates. The rolling volume window is also defined independently of InpRightBars and is always twice the value of InpLeftBars. Therefore, when the left and right pivot settings are different, the volume window does not necessarily match the full pivot confirmation structure.
This establishes the basic indicator structure and prepares the parameters required for the volume, pivot, and visual calculations.
2. Calculating Volume Sums across the Historical Data
Before calculating the volume associated with a pivot point, we first need to understand how the indicator determines when a high or low becomes a confirmed pivot. A pivot high is confirmed when a bar’s high is higher than the highs of the specified bars on both sides. For example, with 15 left and 15 right bars, the bar must have a higher high than all 30 surrounding bars. A pivot low follows the same process, but its low must be lower than the surrounding bars.
Once the pivot structure is understood, we can calculate the rolling volume used during the confirmation process. The indicator uses twice the number of left bars to determine the size of its rolling volume window. With 15 left bars, this gives us a 30-bar window. For example, suppose Bar 100 is a potential pivot high and 15 right bars are required for confirmation. The pivot is confirmed at Bar 115 after the required right-side bars have formed. At Bar 115, the 30-bar volume window covers Bar 86 through Bar 115. The volume of all 30 bars is added together:Volume Sum = Volume[86] + Volume[87] + ... + Volume[115]
If the total volume across these 30 bars is 50,000 contracts, then the volume sum at the confirmation bar, Bar 115, is 50,000. This value is later used to determine whether the pivot at Bar 100 passes the volume filter.
The calculation then moves to the next bar. At Bar 116, the window shifts forward by one bar and covers Bar 87 through Bar 116:
Volume Sum = Volume[87] + Volume[88] + ... + Volume[116]
This process continues across the historical data, producing a rolling series of volume sums. Each calculated value is stored in an array so that the indicator can keep the volume history available for the calculations performed in later stages.
For example, the array will contain values such as:
VolSum[115] = 50,000
VolSum[116] = 51,500
VolSum[117] = 48,200
3. Calculating the Volume Percentile and Normalizing Volume Strength
After calculating and storing the rolling volume sums, the next step is to determine how strong the current volume is compared with the recent volume-sum values. Instead of using a fixed volume value as the threshold, the indicator uses a percentile-based reference. This allows the volume filter to adapt to the volume characteristics of the market.
The indicator uses the 95th percentile of the rolling volume-sum values as its reference. The percentile is calculated using the nearest-rank method, where the available volume-sum values are sorted from the smallest to the largest, and the value at the rank corresponding to 95% of the selected observations is used as the reference. The rolling window includes the current volume-sum value when it is available, and fewer than 1,000 observations may be used at the beginning of the available history.
For example, continuing from the previous step, suppose the volume sum calculated at Bar 115 is 50,000. The indicator considers up to the most recent 1,000 stored volume-sum values, including the value at Bar 115, and sorts them from the smallest to the largest. Suppose that after sorting these values, the 95th-percentile value is 45,000. This becomes the reference volume for Bar 115.
The indicator then compares the current volume sum with this reference:
Normalized Volume = (Current Volume Sum ÷ 95th Percentile) × 5
Using our example:
Normalized Volume = (50,000 ÷ 45,000) × 5
Normalized Volume = 5.56
The result of 5.56 means that the volume sum at Bar 115 has a normalized strength of 5.56 relative to the 95th-percentile reference. The multiplication by 5.0 scales the ratio to produce the normalized value used by the indicator; it does not impose an upper limit on that value. The indicator later compares this result with successive ring thresholds to determine how many ring levels qualify for drawing. For example, a normalized value of 5.56 exceeds the thresholds from 1 through 5, allowing five ring levels to qualify when InpStep is set to 1.0.
This normalized value is then stored for the corresponding bar. The process is repeated for the other historical bars, allowing each volume sum to receive its own normalized strength value. The indicator uses this value in the next stage to determine whether a pivot point passes the volume filter and qualifies for display.
4. Detecting High-Volume Pivot Highs and Lows
After calculating the normalized volume values, the next step is to identify which price points are confirmed pivot highs or pivot lows. The indicator creates separate functions for these checks so that the pivot detection process can be performed consistently across the historical data. A pivot high is confirmed when the high of the candidate bar is strictly higher than the highs of all the specified bars surrounding it. Similarly, a pivot low is confirmed when its low is strictly lower than the lows of all the surrounding bars. The indicator must also wait for the required right-side bars to form before a pivot can be confirmed. For example, with 15 left bars and 15 right bars, Bar 100 can only be confirmed after the next 15 bars, from Bar 101 to Bar 115, have formed and been checked against the candidate pivot.
Continuing from our previous example, suppose Bar 100 forms a potential high and is confirmed as a pivot high when Bar 115 is reached. At Bar 115, the indicator checks Bar 100 against its surrounding bars. If Bar 100 has the highest high within that 31-bar range, it passes the pivot-high test. The indicator then checks the normalized volume associated with the current calculation. From the previous step, suppose the normalized volume at Bar 115 is 5.56, while the volume filter is set to 3.0. The volume filter determines the minimum normalized volume required for a pivot to be displayed. The normalized volume must be greater than the volume filter for the pivot to pass. For example, if the volume filter is set to 3.0, a normalized volume of 4.0 will pass the filter, while a normalized volume of 3.0 will not.
The indicator compares the two values:5.56 > 3.0
Because the normalized volume is greater than the selected filter, the point passes the volume requirement. The indicator can then proceed to display the confirmed pivot. Once a pivot passes both the price-structure check and the volume filter, it becomes a high-volume pivot point that can be used for the visual elements of the indicator. The next stage will focus on creating those visual elements around the detected pivot.
5. Drawing Pivot Rings, Reaction Levels, and Volume Labels
After a pivot passes both the pivot detection and volume filter, the indicator draws several visual elements around the pivot. These include concentric rings, a horizontal reaction level, a pivot marker, and a volume label. The first visual element is the set of concentric rings drawn around the pivot price. The normalized volume determines the ring levels to be displayed, subject to the configured step value and maximum ring levels. The normalized volume itself is not capped, but the indicator displays ring levels only up to its implemented maximum. Therefore, normalized values above the maximum ring level may produce the same number of visible rings.
With the default step value of 1.0, a normalized volume of 5.6 results in 5 visible rings, while a normalized volume of 4.2 results in 4 visible rings. Therefore, higher normalized volume generally allows more ring levels to qualify until the maximum ring level is reached, although the configured step value can cause some ring levels to have the same size multiplier. For example, continuing from the previous step, suppose the normalized volume at Bar 115 is 5.6 and the volume filter is set to 3.0. Since 5.6 is greater than 3.0, the pivot passes the volume filter and can be displayed. The normalized volume of 5.6 then results in 5 visible rings around the pivot. The input step value controls the spacing between the rings. With a step value of 1.0, the rings increase in size progressively, making each successive ring larger than the previous one. If the step value were changed, the distance between the rings would also change.
The vertical size of each ring is scaled using ATR(500). This allows the rings to adapt to the current volatility of the market. A higher ATR produces taller rings, while a lower ATR produces shorter rings. The indicator then draws a horizontal reaction level from the pivot price. For a pivot high, the level is drawn at the high of the pivot bar. For a pivot low, it is drawn at the low of the pivot bar. The level extends forward until the indicator detects a crossing between consecutive closing prices. Once a crossing occurs, the level stops at that point and changes to a dotted style. A small marker is also placed directly at the pivot position to make the detected pivot easy to identify.
The indicator also displays the volume value from the confirmation bar at the corresponding pivot location. For example, a volume sum of 50,000 is shown as 50.00K on the chart. Volume labels are placed above pivot highs and below pivot lows. Using our complete example, if Bar 100 is confirmed as a pivot high at Bar 115, the volume sum at the confirmation bar is 50,000, its normalized volume is 5.6, and the volume filter is 3.0, the pivot passes the filter, and the indicator will draw 5 visible concentric rings around the pivot. The rings will be scaled using ATR(500), the horizontal reaction level will extend from the pivot until a crossing between consecutive closing prices is detected, and the volume label will display 50.00K.
Implementation in MQL5
With the design and implementation strategy defined, we can proceed to building the indicator. Each stage will be implemented in MQL5, with the purpose and logic of the code explained throughout the process.
Configuring the Indicator Structure and Input Parameters
This step defines the indicator structure and the input parameters for pivot detection, volume filtering, display settings, and ATR-based calculations.
Example:
#property indicator_chart_window
#property indicator_buffers 0
#property indicator_plots   0

//--- object naming
#define OBJ_PREFIX "HVP_"

//--- INPUTS
input int    InpLeftBars      = 15;                  // Left Bars
input int    InpRightBars     = 15;                  // Right Bars
input bool   InpUseRealVolume = false;               // Use Real Volume (instead of Tick Volume)
input int    InpDisplayBars   = 300;                 // Bars To Display Objects On (most recent)
input double InpFilterVol     = 2.0;                 // Minimum Normalized Value
input color  InpUpperColor    = C'253,160,94';       // High Pivot Color
input color  InpLowerColor    = C'47,214,142';       // Low Pivot Color
input bool   InpShowLevels    = true;                // Show Levels
input double InpStep          = 1.0;                 // Diameter Of Circles
input color  InpLabelColor    = clrBlue;             // Volume Label Color

//--- GLOBALS
int      g_atrHandle = INVALID_HANDLE;

//--- fixed constants
#define ATR_PERIOD   500

//+------------------------------------------------------------------+
//| Custom indicator initialization function                         |
//+------------------------------------------------------------------+
int OnInit()
  {
//--- validate input parameters
   if(InpLeftBars < 1 ||
      InpRightBars < 1 ||
      InpDisplayBars < 1 ||
      InpStep <= 0.0)
     {
      Print("HighVolumePoints: invalid input parameters. Bar counts must be positive and InpStep must be greater than zero.");
      return(INIT_PARAMETERS_INCORRECT);
     }

   g_atrHandle = iATR(_Symbol, _Period, ATR_PERIOD);
   if(g_atrHandle == INVALID_HANDLE)
     {
      Print("HighVolumePoints: failed to create ATR handle");
      return(INIT_FAILED);
     }

   IndicatorSetString(INDICATOR_SHORTNAME, "High-Volume Points");

//---
   return(INIT_SUCCEEDED);
  }

//+------------------------------------------------------------------+
//| Custom indicator Deinitialization function                       |
//+------------------------------------------------------------------+
void OnDeinit(const int reason)
  {
   if(g_atrHandle != INVALID_HANDLE)
      IndicatorRelease(g_atrHandle);
   ObjectsDeleteAll(0, OBJ_PREFIX);
  }

//+------------------------------------------------------------------+
//| Custom indicator iteration function                              |
//+------------------------------------------------------------------+
int OnCalculate(const int rates_total,
                const int prev_calculated,
                const datetime &time[],
                const double &open[],
                const double &high[],
                const double &low[],
                const double &close[],
                const long &tick_volume[],
                const long &volume[],
                const int &spread[])
  {
//---

//--- return value of prev_calculated for next call
   return(rates_total);
  }
//+------------------------------------------------------------------+
Explanation:
The first part defines the indicator structure. #property indicator_chart_window places the indicator on the main price chart, while #property indicator_buffers 0 and #property indicator_plots 0 specify that the indicator does not use buffers or standard plots. The OBJ_PREFIX definition creates the "HVP_" prefix used to identify the chart objects created by the indicator.
The input parameters control the indicator's behavior. InpLeftBars and InpRightBars define the bars used to confirm pivot points, while InpUseRealVolume selects between real and tick volume. InpDisplayBars controls the range of recent confirmation bars processed for rendering objects, while InpFilterVol sets the minimum normalized volume, and the color inputs control the appearance of high pivots, low pivots, and volume labels. InpShowLevels enables or disables reaction levels, while InpStep controls the spacing between the concentric rings.
When InpStep is set below 1.0, different ring levels can produce the same rounded size multiplier, so an increase in normalized volume does not always result in an additional visually distinct ring. To prevent invalid configurations, InpLeftBars, InpRightBars, and InpDisplayBars must be greater than zero, while InpStep must also be greater than zero.
The global g_atrHandle stores the ATR indicator handle, while ATR_PERIOD sets the ATR period to 500. In OnInit(), iATR() creates the ATR handle, and the indicator is given the short name "High-Volume Points." If the ATR handle cannot be created, initialization fails. When the indicator is removed, OnDeinit() releases the ATR handle and deletes the chart objects created with the "HVP_" prefix.
Calculating Volume Sums across the Historical Data
Next, calculate rolling volume sums across the historical bars for later volume normalization and pivot filtering.
Note: We will highlight the specific code sections related to each implementation stage as we progress, ensuring each part is clearly understood on its own without mixing it with previously explained sections.
Example:
//--- GLOBALS
int      g_atrHandle = INVALID_HANDLE;
double   VolSum[];     // rolling volume sum, full history, ascending (index 0 = oldest)
double   ATR500[];     // ATR(500) values, full history, ascending
//+------------------------------------------------------------------+
//| Custom indicator iteration function                              |
//+------------------------------------------------------------------+
int OnCalculate(const int rates_total,
                const int prev_calculated,
                const datetime &time[],
                const double &open[],
                const double &high[],
                const double &low[],
                const double &close[],
                const long &tick_volume[],
                const long &volume[],
                const int &spread[])
  {
//--- ensure enough bars are available for pivot and ATR calculations
   int minBars = MathMax(InpLeftBars + InpRightBars + 2, ATR_PERIOD);
   if(rates_total < minBars)
      return 0;

   ArraySetAsSeries(time, false);
   ArraySetAsSeries(open, false);
   ArraySetAsSeries(high, false);
   ArraySetAsSeries(low, false);
   ArraySetAsSeries(close, false);
   ArraySetAsSeries(tick_volume, false);
   ArraySetAsSeries(volume, false);

//--- keep the running calculation buffers sized to the whole series
   ArrayResize(VolSum,  rates_total);
   ArrayResize(ATR500,  rates_total);

//--- refresh ATR(500) for the whole series
   ArraySetAsSeries(ATR500, false);
   if(CopyBuffer(g_atrHandle, 0, 0, rates_total, ATR500) <= 0)
      return prev_calculated;

//--- CALCULATION -- always runs across full history (not display-limited)
   int start = (prev_calculated > 1) ? prev_calculated - 1 : 0;

   for(int i = start; i < rates_total; i++)
     {
      //--- define the rolling volume window
      int windowLen = InpLeftBars * 2;
      int wStart    = MathMax(0, i - windowLen + 1);

      //--- calculate the total volume within the window
      double volAcc = 0.0;
      for(int k = wStart; k <= i; k++)
         volAcc += (double)(InpUseRealVolume ? volume[k] : tick_volume[k]);

      //--- store the calculated volume sum
      VolSum[i] = volAcc;
     }

//--- return value of prev_calculated for next call
   return(rates_total);
  }
Explanation:
First, the code checks whether enough historical bars are available for the pivot and ATR calculations. It ensures that the available history is sufficient for both the selected pivot settings and the 500-period ATR before continuing. It also explicitly sets the price, time, and volume arrays to use normal indexing, so index 0 represents the oldest bar and rates_total - 1 represents the latest bar. Likewise, it then resizes the VolSum and ATR500 arrays to match the available bars, allowing the indicator to store the required values across the full historical data.
The second block refreshes the ATR values for the entire available history. ArraySetAsSeries() ensures the ATR500 array uses the same indexing direction as the calculation, while CopyBuffer() retrieves the ATR(500) values from the ATR indicator handle. If the ATR values cannot be copied successfully, the function returns the previous calculation state instead of continuing with incomplete data.
The final block determines where the historical calculation should begin. On the first calculation, it starts from the beginning of the available data, while subsequent calculations restart from the previous bar to update the latest values. For each bar, the code creates a rolling volume window using twice the number of left bars, adds either real volume or tick volume within that window, and stores the resulting total in VolSum[i].
Calculating the Volume Percentile and Normalizing Volume Strength
Next, calculate the 95th-percentile volume reference and normalize each volume sum against it.
Example:
//--- GLOBALS
int      g_atrHandle = INVALID_HANDLE;
double   VolSum[];     // rolling volume sum, full history, ascending (index 0 = oldest)
double   ATR500[];     // ATR(500) values, full history, ascending
double   NormVol[];    // normalized volume, full history, ascending

//--- fixed constants
#define ATR_PERIOD   500
#define PCT_WINDOW   1000
#define PCT_RANK     95.0

//+------------------------------------------------------------------+
//| Nearest-rank percentile of VolSum over the trailing window ending|
//| at index endIdx                                                  |
//+------------------------------------------------------------------+
double PercentileNearestRank(const double &data[], const int endIdx, const int window, const double pct)
  {
   int n = MathMin(window, endIdx + 1);
   if(n <= 0)
      return 0.0;

   double tmp[];
   ArrayResize(tmp, n);
   for(int k = 0; k < n; k++)
      tmp[k] = data[endIdx - n + 1 + k];

   ArraySort(tmp); // ascending
   int rank = (int)MathCeil(pct / 100.0 * n);
   if(rank < 1)
      rank = 1;
   if(rank > n)
      rank = n;

   return tmp[rank - 1];
  }
for(int i = start; i < rates_total; i++)
  {
//--- define the rolling volume window
   int windowLen = InpLeftBars * 2;
   int wStart    = MathMax(0, i - windowLen + 1);

//--- calculate the total volume within the window
   double volAcc = 0.0;
   for(int k = wStart; k <= i; k++)
      volAcc += (double)(InpUseRealVolume ? volume[k] : tick_volume[k]);

//--- store the calculated volume sum
   VolSum[i] = volAcc;
//--- calculate the volume reference and normalize the current volume
   double refVol = PercentileNearestRank(VolSum, i, PCT_WINDOW, PCT_RANK);
   NormVol[i] = (refVol > 0.0) ? (VolSum[i] / refVol * 5.0) : 0.0;
  }
Explanation:
A 95th-percentile reference is calculated from the most recent 1,000 volume-sum values, including the current volume-sum value when it is available. If fewer than 1,000 values are available, the percentile is calculated using the available observations. This provides a volume reference against which the current volume can be compared. The percentile calculation first determines how many values are available in the selected rolling window. It then sorts those values from smallest to largest and identifies the position corresponding to the selected percentile.
The value at that position becomes the percentile reference. In simple terms, for the 95th percentile, the indicator selects the value at the nearest-rank position corresponding to 95% of the selected observations. Because the number of observations can be smaller at the beginning of the available history, early percentile and normalized-volume values may be less stable than values calculated after the full 1,000-value window has been established.
The final two lines use the percentile reference to normalize the current volume. The current volume sum is divided by the 95th-percentile value and multiplied by 5. For example, if the current volume sum is 50,000 and the percentile reference is 45,000, the normalized volume is approximately 5.56. If the reference value is zero, the normalized volume is set to zero to prevent division by zero.
Note: The rolling volume calculation uses a sum rather than an average, so changing InpLeftBars changes the size and raw scale of the volume window. Percentile-based normalization reduces this scale difference within each configuration, but NormVol and the volume filter should still be interpreted relative to the selected volume-window setting. The percentile calculation also sorts the available volume-sum values for each bar, which can increase computational cost when processing large amounts of historical data.
Detecting High-Volume Pivot Highs and Lows
Next, identify confirmed pivot highs and lows that meet the required to be normalized volume threshold.Example:
//--- GLOBALS
int      g_atrHandle = INVALID_HANDLE;
double   VolSum[];     // rolling volume sum, full history, ascending (index 0 = oldest)
double   ATR500[];     // ATR(500) values, full history, ascending
double   NormVol[];    // normalized volume, full history, ascending
datetime g_lastBarTime = 0;
//+------------------------------------------------------------------+
//| Strict local-maximum pivot high                                  |
//+------------------------------------------------------------------+
bool IsPivotHigh(const double &high[], const int idx, const int left, const int right, const int ratesTotal)
  {
   if(idx - left < 0 || idx + right >= ratesTotal)
      return false;
   double val = high[idx];
   for(int k = idx - left; k <= idx + right; k++)
     {
      if(k == idx)
         continue;
      if(high[k] >= val)
         return false;
     }
   return true;
  }

//+------------------------------------------------------------------+
//| Strict local-minimum pivot low                                   |
//+------------------------------------------------------------------+
bool IsPivotLow(const double &low[], const int idx, const int left, const int right, const int ratesTotal)
  {
   if(idx - left < 0 || idx + right >= ratesTotal)
      return false;
   double val = low[idx];
   for(int k = idx - left; k <= idx + right; k++)
     {
      if(k == idx)
         continue;
      if(low[k] <= val)
         return false;
     }
   return true;
  }
//--- CALCULATION -- always runs across full history (not display-limited)
int start = (prev_calculated > 1) ? prev_calculated - 1 : 0;

for(int i = start; i < rates_total; i++)
  {
//--- define the rolling volume window
   int windowLen = InpLeftBars * 2;
   int wStart    = MathMax(0, i - windowLen + 1);

//--- calculate the total volume within the window
   double volAcc = 0.0;
   for(int k = wStart; k <= i; k++)
      volAcc += (double)(InpUseRealVolume ? volume[k] : tick_volume[k]);

//--- store the calculated volume sum
   VolSum[i] = volAcc;

//--- calculate the volume reference and normalize the current volume
   double refVol = PercentileNearestRank(VolSum, i, PCT_WINDOW, PCT_RANK);
   NormVol[i] = (refVol > 0.0) ? (VolSum[i] / refVol * 5.0) : 0.0;
  }

//--- RENDER -- only the most recent InpDisplayBars, only on a new closed bar
bool newBar = (time[rates_total-1] != g_lastBarTime);
if(newBar || prev_calculated == 0)
  {
   int winStart = MathMax(InpLeftBars + InpRightBars, rates_total - InpDisplayBars);
   int winEnd   = rates_total - 2; // exclude the still-forming bar

   for(int i = winStart; i <= winEnd; i++)
     {
      int pivotIdx = i - InpRightBars;
      if(pivotIdx < InpLeftBars)
         continue;

      double normVol = NormVol[i];
      if(normVol <= InpFilterVol)
         continue;

      if(IsPivotHigh(high, pivotIdx, InpLeftBars, InpRightBars, rates_total))
        {
         //--- DRAW PIVOT
        }

      if(IsPivotLow(low, pivotIdx, InpLeftBars, InpRightBars, rates_total))
        {
         //--- DRAW PIVOT
        }
     }

   g_lastBarTime = time[rates_total-1];
  }
Explanation:
The IsPivotHigh() function checks whether a selected bar is a confirmed pivot high. It first makes sure there are enough bars available on both sides of the candidate bar. The candidate's high is then compared with the highs of all surrounding bars defined by the left and right settings. If any surrounding bar has a high greater than or equal to the candidate's high, the function returns false. Otherwise, the bar is confirmed as a pivot high. IsPivotLow() performs the opposite check by confirming that the candidate's low is strictly lower than the lows of all surrounding bars.
This section manages the timing of the indicator's chart updates. It checks the latest bar time against the previously recorded time to determine whether a new bar has appeared. The rendering process runs either when a new bar is detected or during the first calculation. The code then defines the range of historical bars to process. InpDisplayBars limits the rendering to the most recent confirmation bars, while the starting position also ensures that enough left and right bars are available for pivot confirmation. The ending position excludes the currently forming bar, so the indicator processes completed bars when displaying confirmed pivots.
For each bar in this range, the code calculates the actual pivot position by subtracting InpRightBars from the current index. For example, with 15 right bars, if the current index is 115, the candidate pivot is at bar 100. This means the indicator waits until the 15 bars after bar 100 have formed before confirming whether bar 100 is a pivot. It then checks that the candidate also has enough bars on its left and retrieves the normalized volume at the confirmation bar to qualify the candidate pivot.
The normalized volume is compared with the selected volume filter. If it does not exceed the filter, the point is ignored. If it passes, the indicator checks whether the candidate is a pivot high or pivot low using the previously defined functions. When either condition is satisfied, the corresponding drawing process is performed to display the pivot and its visual elements. Finally, the latest bar time is stored so the indicator can detect the next new bar and repeat the rendering process.
Drawing Pivot Rings, Reaction Levels, and Volume Labels
Finally, draw the pivot rings, reaction levels, markers, and volume labels for each qualifying pivot.
Example:
//--- fixed constants
#define ATR_PERIOD   500
#define PCT_WINDOW   1000
#define PCT_RANK     95.0
#define X_SCALE      2.0
//+------------------------------------------------------------------+
//| Draws one concentric "ring" as an ellipse.                       |
//+------------------------------------------------------------------+
void DrawRing(const datetime pivotTime, const double pivotPrice, const int mult, const double atrVal,
              const color clr, const bool isHigh, const int ringIdx)
  {
   if(mult <= 0)
      return;

   double a    = MathRound(X_SCALE * mult);       // horizontal semi-axis, in bars
   double b    = 0.5 * atrVal * mult;             // vertical semi-axis, in price
   long   secs = (long)a * (long)PeriodSeconds();

   datetime tLeft  = (datetime)(pivotTime - secs);
   datetime tRight = (datetime)(pivotTime + secs);

   string name = OBJ_PREFIX + "RING_" + (isHigh ? "H" : "L") + "_" + IntegerToString((long)pivotTime) + "_" + IntegerToString(ringIdx);

   if(ObjectFind(0, name) < 0)
      ObjectCreate(0, name, OBJ_ELLIPSE, 0, tLeft, pivotPrice, tRight, pivotPrice, pivotTime, pivotPrice + b);
   else
     {
      ObjectMove(0, name, 0, tLeft,     pivotPrice);
      ObjectMove(0, name, 1, tRight,    pivotPrice);
      ObjectMove(0, name, 2, pivotTime, pivotPrice + b);
     }

   ObjectSetInteger(0, name, OBJPROP_COLOR,      clr);
   ObjectSetInteger(0, name, OBJPROP_WIDTH,      1);
   ObjectSetInteger(0, name, OBJPROP_FILL,       false);
   ObjectSetInteger(0, name, OBJPROP_BACK,       true);
   ObjectSetInteger(0, name, OBJPROP_SELECTABLE, false);
   ObjectSetInteger(0, name, OBJPROP_HIDDEN,     true);
  }

//+------------------------------------------------------------------+
//| format.volume equivalent (12345 -> "12.35K")                     |
//+------------------------------------------------------------------+
string FormatVolume(const double v)
  {
   if(MathAbs(v) >= 1000000.0)
      return DoubleToString(v/1000000.0, 2) + "M";
   if(MathAbs(v) >= 1000.0)
      return DoubleToString(v/1000.0, 2) + "K";
   return DoubleToString(v, 0);
  }

//+------------------------------------------------------------------+
//| Draws the horizontal reaction level (stateless crossing scan),   |
//| the circle marker, and the volume label for one pivot            |
//+------------------------------------------------------------------+
void DrawLevelAndLabels(const bool isHigh, const int pivotIdx, const double price, const double volValue,
                        const int ringCount, const datetime &time[], const double &close[], const int ratesTotal)
  {
   color  clr = isHigh ? InpUpperColor : InpLowerColor;
   string tag = (isHigh ? "H_" : "L_") + IntegerToString((long)time[pivotIdx]);

//--- Level line: extend until price crosses it, then freeze + dot it (mirrors check_cross)
   if(InpShowLevels)
     {
      datetime endTime = time[ratesTotal - 1];
      ENUM_LINE_STYLE style = STYLE_SOLID;

      for(int k = pivotIdx + 1; k < ratesTotal; k++)
        {
         if((close[k-1] < price && close[k] > price) ||
            (close[k-1] > price && close[k] < price))
           {
            endTime = time[k-1];
            style   = STYLE_DOT;
            break;
           }
        }

      string lname = OBJ_PREFIX + "LVL_" + tag;
      if(ObjectFind(0, lname) < 0)
         ObjectCreate(0, lname, OBJ_TREND, 0, time[pivotIdx], price, endTime, price);
      else
        {
         ObjectMove(0, lname, 0, time[pivotIdx], price);
         ObjectMove(0, lname, 1, endTime, price);
        }
      ObjectSetInteger(0, lname, OBJPROP_COLOR,      clr);
      ObjectSetInteger(0, lname, OBJPROP_STYLE,      style);
      ObjectSetInteger(0, lname, OBJPROP_WIDTH,      MathMax(1, (int)MathRound(ringCount / 3.0)));
      ObjectSetInteger(0, lname, OBJPROP_RAY_RIGHT,  false);
      ObjectSetInteger(0, lname, OBJPROP_SELECTABLE, false);
      ObjectSetInteger(0, lname, OBJPROP_HIDDEN,     true);
     }

//--- Circle marker at the pivot
   string cname = OBJ_PREFIX + "MARK_" + tag;
   if(ObjectFind(0, cname) < 0)
      ObjectCreate(0, cname, OBJ_TEXT, 0, time[pivotIdx], price);
   else
      ObjectMove(0, cname, 0, time[pivotIdx], price);
   ObjectSetString(0, cname, OBJPROP_TEXT, CharToString((uchar)108));
   ObjectSetString(0, cname, OBJPROP_FONT, "Wingdings");
   ObjectSetInteger(0, cname, OBJPROP_FONTSIZE,   8);
   ObjectSetInteger(0, cname, OBJPROP_COLOR,      clr);
   ObjectSetInteger(0, cname, OBJPROP_ANCHOR,     ANCHOR_CENTER);
   ObjectSetInteger(0, cname, OBJPROP_SELECTABLE, false);
   ObjectSetInteger(0, cname, OBJPROP_HIDDEN,     true);

//--- Volume label (above for highs, below for lows)
   string vname = OBJ_PREFIX + "VOL_" + tag;
   if(ObjectFind(0, vname) < 0)
      ObjectCreate(0, vname, OBJ_TEXT, 0, time[pivotIdx], price);
   else
      ObjectMove(0, vname, 0, time[pivotIdx], price);
   ObjectSetString(0, vname, OBJPROP_TEXT, FormatVolume(volValue));
   ObjectSetString(0, vname, OBJPROP_FONT, "Arial");
   ObjectSetInteger(0, vname, OBJPROP_FONTSIZE,   8);
   ObjectSetInteger(0, vname, OBJPROP_COLOR,      InpLabelColor);
   ObjectSetInteger(0, vname, OBJPROP_ANCHOR,     isHigh ? ANCHOR_LOWER : ANCHOR_UPPER);
   ObjectSetInteger(0, vname, OBJPROP_SELECTABLE, false);
   ObjectSetInteger(0, vname, OBJPROP_HIDDEN,     true);
  }

//+------------------------------------------------------------------+
//| Draws every ring + level + labels for one confirmed pivot bar    |
//+------------------------------------------------------------------+
void DrawPivot(const bool isHigh, const int pivotIdx, const double source, const double normVol,
               const double atrVal, const double volValue, const datetime &time[], const double &close[], const int ratesTotal)
  {
   int ringCount = 0;
   for(int r = 1 ; r <= 10; r++)
     {
      if(normVol > (double)r)
        {
         int mult = (int)MathRound(r * InpStep);
         DrawRing(time[pivotIdx], source, mult, atrVal, isHigh ? InpUpperColor : InpLowerColor, isHigh, r);
         ringCount++;
        }
     }
   DrawLevelAndLabels(isHigh, pivotIdx, source, volValue, ringCount, time, close, ratesTotal);
  }
//+------------------------------------------------------------------+
Explanation:
DrawRing() creates one concentric ring around a confirmed pivot. It first checks that the multiplier exceeds zero, then calculates the horizontal size of the ellipse using X_SCALE, the multiplier, and the chart's bar duration obtained through PeriodSeconds(). Because this horizontal size is time-based rather than a fixed bar count, trading gaps, weekends, and session breaks can cause the visual width of a ring to differ from the number of visible bars it spans. Its vertical size is based on ATR(500), allowing the ring to expand or contract according to market volatility. The function then creates or updates the ellipse on the chart and applies its color, width, and display properties.
FormatVolume() converts volume values into a shorter format that is easier to read on the chart. Values of 1,000 or more are displayed using K, while values of 1,000,000 or more use M. For example, 12,345 is displayed as 12.35K, while 2,500,000 becomes 2.50M.
DrawLevelAndLabels() draws the reaction level, pivot marker, and volume label for a confirmed pivot. If reaction levels are enabled, it extends the line forward and checks whether the closing price moves from one side of the pivot reaction level to the other between two consecutive bars. When such a crossing is detected, the line endpoint is set to the time of the earlier bar, and the line is switched to a dotted style. A marker is also placed at the pivot, while the formatted volume is displayed above a pivot high or below a pivot low.
DrawPivot() brings the drawing components together for each confirmed pivot. It checks the normalized volume against successive levels to determine the ring levels to be displayed, calculates the size multiplier using InpStep, and calls DrawRing() for each qualifying ring. Finally, it calls DrawLevelAndLabels() to add the reaction level, marker, and volume label.
Once a qualifying pivot is identified, the next step is to call the drawing functions and create all required chart objects.
Example:
bool need_redraw = false; // tracks whether any new object was drawn this pass

//--- RENDER -- only the most recent InpDisplayBars, only on a new closed bar
bool newBar = (time[rates_total-1] != g_lastBarTime);
if(newBar || prev_calculated == 0)
  {
   int winStart = MathMax(InpLeftBars + InpRightBars, rates_total - InpDisplayBars);
   int winEnd   = rates_total - 2; // exclude the still-forming bar

   for(int i = winStart; i <= winEnd; i++)
     {
      int pivotIdx = i - InpRightBars;
      if(pivotIdx < InpLeftBars)
         continue;

      double normVol = NormVol[i];
      if(normVol <= InpFilterVol)
         continue;

      if(IsPivotHigh(high, pivotIdx, InpLeftBars, InpRightBars, rates_total))
        {
         DrawPivot(true,  pivotIdx, high[pivotIdx], normVol, ATR500[pivotIdx], VolSum[i], time, close, rates_total);
         need_redraw = true;
        }

      if(IsPivotLow(low, pivotIdx, InpLeftBars, InpRightBars, rates_total))
        {
         DrawPivot(false, pivotIdx, low[pivotIdx],  normVol, ATR500[pivotIdx], VolSum[i], time, close, rates_total);
         need_redraw = true;
        }
     }

   g_lastBarTime = time[rates_total-1];
  }

//--- Redraw the chart only if at least one new object was created
if(need_redraw)
   ChartRedraw(0);
Explanation:
Once a candidate passes the volume filter, the indicator checks whether it is a confirmed pivot high or pivot low. If IsPivotHigh() returns true, DrawPivot() is called with true to indicate a high pivot. It passes the pivot position, pivot price, normalized volume, ATR value from the pivot bar, and volume sum from the confirmation bar so the function can draw all the required objects. The same process is used for a pivot low, but false is passed to DrawPivot(), and the pivot low price is used instead. In either case, need_redraw is set to true to indicate that a qualifying pivot has been processed for drawing.
After the rendering loop finishes, ChartRedraw(0) is called only when need_redraw is true. This tells MetaTrader 5 to refresh the current chart to display any objects that were created or updated. If no qualifying pivot was processed for drawing, the chart is not unnecessarily redrawn.
Conclusion
By completing this article, we have developed a High-Volume Pivot Indicator in MQL5 that combines pivot structure, volume analysis, and market volatility to identify and visualize significant pivot areas. The focus was on understanding how confirmed pivot highs and lows can be filtered using normalized volume and represented using volatility-adjusted chart objects. Throughout this implementation, we have learned how to:
- detect and confirm pivot highs and pivot lows using surrounding bars;
- calculate rolling volume sums across historical data;
- calculate a 95th-percentile volume reference using nearest-rank methodology;
- normalize volume strength relative to the percentile reference;
- filter pivot points using normalized volume;
- use ATR(500) to scale concentric pivot rings;
- draw reaction levels that stop when the closing price crosses the pivot level;
- display pivot markers and formatted volume labels; and
- manage and redraw chart objects in MQL5.
This project combines price structure, volume strength, and volatility into a single chart-based visualization. The resulting tool can help traders study high-volume pivot areas, observe potential reaction levels, and understand how significant volume interacts with price structure.
Warning: All rights to these materials are reserved by MetaQuotes Ltd. Copying or reprinting of these materials in whole or in part is prohibited.
This article was written by a user of the site and reflects their personal views. MetaQuotes Ltd is not responsible for the accuracy of the information presented, nor for any consequences resulting from the use of the solutions, strategies or recommendations described.