

Working with ONNX Models in MQL5 (Part 2): Drawing the Model Graph on an Interactive Chart Panel
 131
131
 0
0

Introduction
We built a reader that opens an ONNX file and tells us what is inside it. It works, and the report is accurate, but it arrives as a wall of text in the Experts tab. Thirteen layers scroll past with their input and output names. To understand the connections, we must trace those names by eye, line by line, while keeping the graph's structure in mind. A model with two parallel branches reads exactly like a model with one long chain, because a list has no way to show that two layers run side by side. The thing we most want to know about a network, its shape, is the one thing a list cannot give us. This article is for MetaQuotes Language 5 (MQL5) developers and algorithmic traders who want to see the model they are running rather than read about it.
In our previous article (Part 1), we wrote a Protocol Buffers reader and a parser on top of it, and printed the nodes, weights, and exposed shapes to the log. In this article, we draw them. We extend the parser to carry the information a picture needs. Then we build a drawing surface on the chart, arrange the layers into a graph, and connect mouse input so we can pan, zoom, and inspect layers. We will cover the following topics:
- Understanding Graph Layout and Canvas Rendering
- Extending the Parser for Shapes and Attributes
- Building the Drawing Canvas
- Arranging Nodes into a Graph Layout
- Handling Zoom, Pan, and Node Selection
- Visualization
- Conclusion
By the end of this article, you will be able to:
- Read tensor shapes and node attributes from an ONNX file, so every connection can be labeled and every layer described.
- Draw anti-aliased lines, discs, and rounded panels on a chart bitmap, clipped to their own region.
- Arrange a set of nodes into ranks and route the connections between them, including graphs that branch and rejoin.
- Zoom, pan, and click a layer to inspect its operator, its attributes, and the tensors it reads.
Understanding Graph Layout and Canvas Rendering
A list of layers has an order, and that is all it has. To draw the same layers as a graph, we need something a list never carries: position. Every node has to sit somewhere, and where it sits has to mean something, or the picture is decoration. The rule we use is depth: a node's row is one step past the deepest node feeding it. Whatever the graph takes in starts at depth zero; anything reading it sits at depth one, and so on down. When two layers both read the same value, neither is deeper than the other, so both land on the same row and are drawn side by side. That is not a choice we make for appearance. It falls out of the rule, and it is correct, because two layers reading the same value genuinely do run at the same stage. A chain becomes a column, a branch becomes two columns, and the shape of the picture ends up being the shape of the network. See the illustration below.
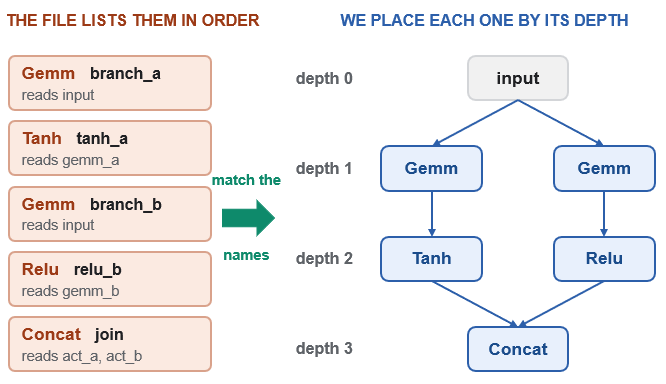
Determining how layers connect is the other half, and the file does not tell us directly. No layer names its neighbors. It records the names of the values a node reads and writes. We recover connections by matching outputs to inputs. A layer that writes a value and a layer that reads that same value are joined, and that shared name is the only evidence we get. It also means one value can feed several layers at once, and several values can arrive at a single layer, without either case needing to be handled specially. A branch and a rejoin fall out of the same matching rule.
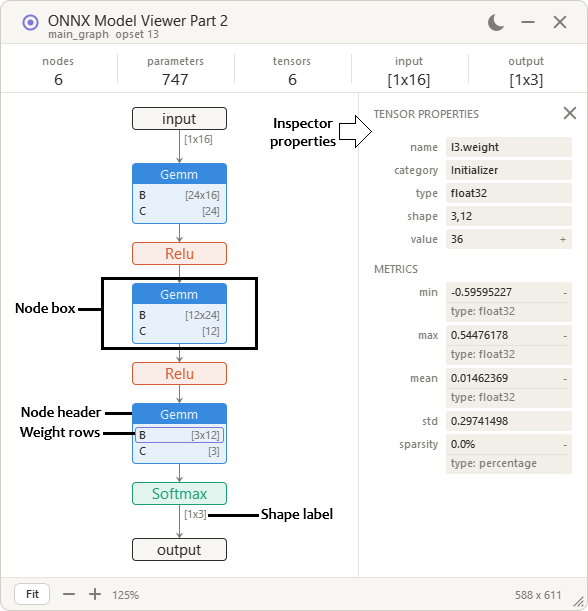
For the drawing itself, we lean on ground we have already covered. In the MQL5 Trading Tools series, we built rounded rectangles, triangles, and speech bubbles on the canvas, working through supersampling and anti-aliased edges in detail, so we will not repeat that here. This panel adds a clip rectangle. A graph that pans freely would otherwise paint over the header above it, and a long property value would run past the panel edge, so every pixel we write is tested against the region it belongs to before it lands. In a nutshell, here is an illustration of what we intend to achieve.
Extending the Parser for Shapes and Attributes
We cannot draw anything from what we currently read. A connection needs the shape of what travels along it; a layer needs the settings it was given, and we kept neither in the previous part. So we widen what the parser carries, then teach it to fill the new room.
//+------------------------------------------------------------------+
//| Capacity limits                                                  |
//+------------------------------------------------------------------+
#define OMV_MAX_NODES   4096  // Layers the graph may hold
#define OMV_MAX_TENSORS 4096  // Weight tensors the graph may hold
#define OMV_MAX_PORTS     64  // Names one node may carry per side
#define OMV_MAX_ATTRS     32  // Attributes one node may carry
#define OMV_MAX_META      32  // Key and value pairs the file may attach
#define OMV_MAX_FUNCS     64  // Operators the file may define for itself
#define OMV_MAX_DIMS      16  // Axes one tensor may have
#define OMV_MAX_VALUES  4096  // Weights one tensor keeps for display
First, we raise the node and tensor ceilings to four thousand, because a trained network passes five hundred without trying. We then lift the names one layer may read from eight to sixty-four, since an operator that joins several values reads all of them at once, and we double the axis count for tensors carrying more than four dimensions. Three of these we add outright: with "OMV_MAX_ATTRS" we bound the settings we keep per layer, with "OMV_MAX_VALUES" we cap how many weights we hold back for display, and with the last two we bound whatever the file attaches to itself. Next, we will define logic for layers to define themselves.
Giving a layer something to say about itself
We want a click on a layer to tell us how it was configured, so we extend the structure to hold that.
//+------------------------------------------------------------------+
//| Graph layer                                                      |
//+------------------------------------------------------------------+
struct OmvNode
  {
   // Name the operator this layer applies
   string            op;
   // Name this layer was given
   string            name;
   // Name the operator set this layer's operator comes from
   string            domain;
   // Name each attribute the operator was given
   string            attrName[OMV_MAX_ATTRS];
   // Print the value each attribute holds
   string            attrValue[OMV_MAX_ATTRS];
   // Record which kind each attribute declared itself to be
   int               attrKind[OMV_MAX_ATTRS];
   // Count the attributes present
   int               attrCount;
   // Carry whatever the file says about this layer
   string            docString;
   // Name the overload the operator was resolved to
   string            overload;
   // List the names feeding this layer
   string            feeds[OMV_MAX_PORTS];
   // Count the names present
   int               feedCount;
   // List the names this layer produces
   string            emits[OMV_MAX_PORTS];
   // Count the names present
   int               emitCount;
  };
We keep everything the "OmvNode" structure already had and add seven fields to it. Three of them we run in parallel to hold the attributes, storing each name, its printed value, and the kind the file declared it to be. That is how we come to report a layer as applying an axis of one, rather than only saying it is a softmax. With the remaining fields, we record the operator set the layer belongs to, the overload it resolved to, and whatever the file chose to say about it.
Keeping the weights instead of throwing them away
Previously, we measured a tensor and let its numbers go. We cannot afford that now, because a panel showing a tensor has to show what is in it.
//+------------------------------------------------------------------+
//| Weight tensor                                                    |
//+------------------------------------------------------------------+
struct OmvTensor
  {
   // Name the nodes refer to it by
   string            name;
   // Measure each axis
   int               dim[OMV_MAX_DIMS];
   // Count the axes present
   int               dims;
   // Record the ONNX type code
   int               dataType;
   // Multiply every axis to size the block
   int               values;
   // Track the smallest weight held
   double            minValue;
   // Track the largest weight held
   double            maxValue;
   // Track the average weight
   double            meanValue;
   // Track how far the weights spread from their average
   double            stdValue;
   // Track what share of the weights are zero
   double            sparsity;
   // Keep the weights themselves so the inspector can show them
   double            val[];
   // Count the weights kept, which stops at the display limit
   int               kept;
   // Report where the file keeps this tensor's values
   string            location;
   // Name the category the file gives this tensor
   string            category;
   // Keep the strings when the tensor holds text rather than numbers
   string            text[];
   // Count the strings kept
   int               texts;
   // Report whether the file stored this tensor in a segment
   bool              segmented;
  };
Here, we add nine fields, and with "val" we change what we do rather than what we know, since we now hold the weights themselves and count in "kept" how many we took before the display limit stopped us. Next to them, we track the spread and the share of values that are exactly zero, which together tell us at a glance whether a layer was trained or left alone. In the rest, we record the category and location the file gives a tensor, keep a place for its contents when it holds text, and note whether the file split it into segments.
Measuring once, however the numbers arrived
A tensor can store its values in several different ways, and we need identical measurements from each of them. Writing that arithmetic once per storage form would guarantee that the copies drift apart, so we lift it out into two routines and let every reader share them.
//+------------------------------------------------------------------+
//| Walk raw weight bytes for their range and average                |
//+------------------------------------------------------------------+
void COmvModel::Accumulate(const double v, OmvTensor &tensor, int &seen, int &zeros,
                           double &total, double &squares, double &lowest, double &highest)
  {
//--- Seed the range from the first value that arrives
   if(seen == 0)
     {
      lowest = v;
      highest = v;
     }
//--- Lower the floor when this value is smaller
   if(v < lowest)
      lowest = v;
//--- Raise the ceiling when this value is larger
   if(v > highest)
      highest = v;
//--- Add the value to the running totals
   total += v;
   squares += v * v;
//--- Count a value that is exactly zero
   if(v == 0.0)
      zeros++;
//--- Keep the value itself while room remains
   if(tensor.kept < OMV_MAX_VALUES)
     {
      ArrayResize(tensor.val, tensor.kept + 1);
      tensor.val[tensor.kept++] = v;
     }
   seen++;
  }

//+------------------------------------------------------------------+
//| Publish what the accumulated values measured                     |
//+------------------------------------------------------------------+
void COmvModel::Publish(OmvTensor &tensor, const int seen, const int zeros,
                        const double total, const double squares,
                        const double lowest, const double highest)
  {
//--- Abort when the read stopped before any value arrived
   if(seen <= 0)
      return;
//--- Publish the range and the average
   tensor.minValue = lowest;
   tensor.maxValue = highest;
   tensor.meanValue = total / seen;
//--- Take the spread as the root of the mean squared deviation
   const double variance = squares / seen - tensor.meanValue * tensor.meanValue;
   tensor.stdValue = (variance > 0.0) ? MathSqrt(variance) : 0.0;
//--- Take the share of the values that are exactly zero
   tensor.sparsity = (double)zeros / seen;
  }
We define "Accumulate" to process one value at a time: it updates the range, adds to the running totals, counts zeros, and stores values until the display limit is reached. When the walk ends, we call "Publish" to turn those totals into the fields the inspector reads, taking the spread as the square root of the mean squared deviation with the MathSqrt function. By splitting it this way, we guarantee that a tensor stored as raw bytes and one stored as a list of floats give us identical measurements, since we push both through the same two routines.
Pulling values out of a byte block
With the measuring settled, we only have to teach each storage form how to extract one value.
//+------------------------------------------------------------------+
//| Walk a raw byte payload at the width its type implies            |
//+------------------------------------------------------------------+
void COmvModel::RawStats(const uchar &raw[], const int from, const int to, OmvTensor &tensor)
  {
//--- Take the width one value occupies for this element type
   int width = 4;
   if(tensor.dataType == 11 || tensor.dataType == 7 || tensor.dataType == 13)
      width = 8;
   else
      if(tensor.dataType == 2 || tensor.dataType == 3 || tensor.dataType == 9)
         width = 1;
      else
         if(tensor.dataType == 4 || tensor.dataType == 5 || tensor.dataType == 10)
            width = 2;
//--- Count the whole values the payload holds
   const int count = (to - from) / width;
   if(count <= 0)
      return;
//--- Point a cursor at the payload
   CPbReader bytes;
   if(!bytes.Attach(raw, from, to))
      return;
//--- Start the running measures
   double lowest = 0.0, highest = 0.0, total = 0.0, squares = 0.0;
   int zeros = 0, seen = 0;
//--- Visit every stored value
   for(int i = 0; i < count; i++)
     {
      //--- Read the value the way its type is written
      double v = 0.0;
      if(tensor.dataType == 1)
         v = (double)bytes.ReadFloat();
      else
         if(tensor.dataType == 11)
            v = bytes.ReadDouble();
         else
            if(width == 8)
               v = (double)(long)bytes.ReadFixed64();
            else
               if(width == 4)
                  v = (double)(int)bytes.ReadFixed32();
               else
                  if(width == 2)
                     v = (double)(int)(bytes.ReadVarint() & 0xFFFF);
                  else
                     v = (double)bytes.ReadVarint();
      //--- Stop on a broken read
      if(bytes.Failed())
         break;
      //--- Fold the value into the running measures
      Accumulate(v, tensor, seen, zeros, total, squares, lowest, highest);
     }
//--- Publish what the walk measured
   Publish(tensor, seen, zeros, total, squares, lowest, highest);
  }
Most files provide a tensor as a single block of bytes, and we unpack it with "RawStats". First we settle how wide one value is, since the element type alone decides that; then we count the whole values the block holds and read them one at a time, handing each to the routines above. We take eight bytes for doubles and long integers, one for single bytes, two for half precision, and four for everything else. For a tensor stored through a typed list instead, we write a matching routine that differs only in how it reads each value, and we finish it with the same two calls.
Finding the shapes hidden between the layers
One thing still stands between us and a labelled connection. Graph inputs and outputs announce their shapes, but the values passing between layers only do so when the file bothered to record them in a list we never opened. We reach it from inside the routine that walks the graph.
//+------------------------------------------------------------------+
//| Read the graph into nodes, weights and ports                     |
//+------------------------------------------------------------------+
bool COmvModel::ParseGraph(const uchar &raw[], const int from, const int to)
  {
//--- Existing logic
      //--- Read a node
      if(field == 1)
         ParseNode(inner, f2, t2);
      //--- Read an initializer
      else
         if(field == 5)
            ParseTensor(inner, f2, t2);
            //--- Read what the file says about a value passing between layers
            else
               if(field == 13)
                 {
                  OmvPort port;
                  if(ParsePort(inner, f2, t2, port))
                    {
                     ArrayResize(m_inner, m_inners + 1);
                     m_inner[m_inners++] = port;
                    }
                 }
//--- Existing logic
  }
In the "ParseGraph" function, we walk the graph field by field, and here we add a branch for field thirteen, which holds the shape of every value that is neither an input nor an output. We hand each one to "ParsePort", the same routine we already use for the exposed ports, and keep what comes back in a list of its own. Skip this, and we could label only the first and last arrows in the picture, with everything between them blank. With that done, we can move on to building the canvas where we display the parsed information. We handle this in the next section.
Building the Drawing Canvas
We now have everything the picture needs, and nowhere to put it. MetaTrader gives us a bitmap object and a buffer of pixels behind it, so we build a class that owns that buffer and knows how to write into it without producing staircases. We extend the terminal's own canvas rather than replacing it, keeping its buffer and adding what we are missing.
//+------------------------------------------------------------------+
//| Drawing surface with blended primitives and cached metrics       |
//+------------------------------------------------------------------+
class COmvCanvas : public CCanvas
  {
private:
   // Remember the font size last applied
   int               m_fontSize;
   // Remember whether the font last applied was bold
   bool              m_fontBold;
   // Store the strings already measured
   string            m_key[OC_CACHE];
   // Store the width measured for each string
   int               m_wide[OC_CACHE];
   // Store the height measured for each string
   int               m_high[OC_CACHE];
   // Count the entries in use
   int               m_cached;
   // Bound the left edge drawing may reach
   int               m_clipL;
   // Bound the top edge drawing may reach
   int               m_clipT;
   // Bound the right edge drawing may reach
   int               m_clipR;
   // Bound the bottom edge drawing may reach
   int               m_clipB;

public:
                     COmvCanvas(void);
   void              SetClip(const int x1, const int y1, const int x2, const int y2);
   void              NoClip(void);
   bool              InClip(const int x1, const int y1, const int x2, const int y2) const;
   void              FillRect(int x1, int y1, int x2, int y2, const uint clr);
   void              Blend(const int x, const int y, const uint src);
   void              BlendCov(const int x, const int y, const uint rgb, const double srcAlpha);
   void              DiscAA(const int cx, const int cy, const int radius, const uint argb);
   void              StrokeAA(const double x0, const double y0, const double x1, const double y1,
                              const int thick, const uint argb);
   void              RoundFill(int x, int y, int w, int h, int r, const uint argb);
   void              RoundStroke(int x, int y, int w, int h, int r, const int t, const uint argb);
   //--- Existing logic
   void              Font(const int size, const bool bold = false);
   int               TextWide(const string text);
   int               TextHigh(const string text);
   void              TxtL(const int x, const int y, const string text, const uint clr);
   void              TxtC(const int x, const int y, const string text, const uint clr);
   //--- Existing logic
  };
By deriving "COmvCanvas" from the standard CCanvas class, we inherit the pixel buffer and the object handling, then add the four clip bounds and a small measurement cache as members. The public side splits into two families. First come the drawing calls, which write pixels, and all end up passing through the same blend. Then come the text calls, which measure and place strings. Everything the panel draws goes through one of these two, and neither knows the first thing about ONNX. With the surface declared, we can define the rule that keeps drawing where it belongs.
Fencing off where drawing may happen
Our panel holds a graph that pans, a header that must not be painted over, and an inspector alongside both. We settle that with a rectangle that every pixel is tested against.
//+------------------------------------------------------------------+
//| Restrict drawing to a rectangle                                  |
//+------------------------------------------------------------------+
void COmvCanvas::SetClip(const int x1, const int y1, const int x2, const int y2)
  {
//--- Store the bounds every later call is held inside
   m_clipL = x1;
   m_clipT = y1;
   m_clipR = x2;
   m_clipB = y2;
  }
We define the "SetClip" function to simply record four numbers, and that is the whole mechanism. Whichever routine draws next, however far its shape reaches, nothing lands outside those bounds. This is what lets us pan the graph freely inside its own region without a single stroke escaping into the header above it, and it costs us one comparison per pixel. Next, we make that comparison in the routine every drawing call eventually reaches.
Blending one pixel at a time
Every stroke, disc and rounded corner we draw ends here, so this is where both the clip and the smoothing are decided.
//+------------------------------------------------------------------+
//| Blend one source pixel over what the buffer already holds        |
//+------------------------------------------------------------------+
void COmvCanvas::Blend(const int x, const int y, const uint src)
  {
//--- Drop anything outside the buffer or outside the clip
   if(x < 0 || x >= m_width || y < 0 || y >= m_height)
      return;
   if(x < m_clipL || x > m_clipR || y < m_clipT || y > m_clipB)
      return;
//--- Locate the pixel in the flat buffer
   const int idx = y * m_width + x;
//--- Read the source alpha
   const uint sa8 = (src >> 24) & 0xFF;
//--- Leave the buffer untouched for a fully clear source
   if(sa8 == 0)
      return;
//--- Overwrite outright for a fully opaque source
   if(sa8 == 255)
     {
      m_pixels[idx] = src;
      return;
     }
//--- Read what the buffer holds underneath
   const uint dst = m_pixels[idx];
   //--- Existing logic
//--- Split both colors into normalized channels
   const double sA = ((src >> 24) & 0xFF) / 255.0, sR = ((src >> 16) & 0xFF) / 255.0;
   const double sG = ((src >> 8) & 0xFF) / 255.0,  sB = (src & 0xFF) / 255.0;
   const double dA = ((dst >> 24) & 0xFF) / 255.0, dR = ((dst >> 16) & 0xFF) / 255.0;
   const double dG = ((dst >> 8) & 0xFF) / 255.0,  dB = (dst & 0xFF) / 255.0;
//--- Combine the two alphas
   const double oA = sA + dA * (1.0 - sA);
   //--- Existing logic
//--- Write the composited result back as one packed value
   m_pixels[idx] = ((uint)(uchar)(oA * 255 + 0.5) << 24) |
                   ((uint)(uchar)((sR * sA + dR * dA * (1.0 - sA)) / oA * 255 + 0.5) << 16) |
                   ((uint)(uchar)((sG * sA + dG * dA * (1.0 - sA)) / oA * 255 + 0.5) << 8) |
                   (uint)(uchar)((sB * sA + dB * dA * (1.0 - sA)) / oA * 255 + 0.5);
  }
Inside "Blend", we test the clip first, then take two shortcuts before doing any arithmetic, since a fully clear pixel changes nothing and a fully opaque one simply replaces what is there. Only a partly transparent pixel reaches the mixing, where we split both colors into their channels, combine the two alphas, and pack the result back into one value. That partial case is exactly what smoothing produces, because a shape covering half a pixel arrives here at half alpha. Having settled how a single pixel is written, we can draw a line out of them.
Drawing a line without steps
A line rounded to whole pixels turns every diagonal into a staircase, so instead of asking which pixels the line lands on, we ask how much of each pixel it covers.
//+------------------------------------------------------------------+
//| Draw a smoothed line of a given thickness                        |
//+------------------------------------------------------------------+
void COmvCanvas::StrokeAA(const double x0, const double y0, const double x1, const double y1,
                          const int thick, const uint argb)
  {
//--- Snap an odd width onto pixel centers, but only for an axis aligned run
   const bool level = (MathAbs(y1 - y0) < 0.001);
   const bool plumb = (MathAbs(x1 - x0) < 0.001);
   const bool snap = (((thick < 1) ? 1 : thick) % 2 == 1) && (level || plumb);
//--- Leave a sloped or curved run on its true coordinates
   const double ax = snap ? MathFloor(x0) + 0.5 : x0;
   const double ay = snap ? MathFloor(y0) + 0.5 : y0;
   const double bx = snap ? MathFloor(x1) + 0.5 : x1;
   const double by = snap ? MathFloor(y1) + 0.5 : y1;
//--- Measure the line so its perpendicular distance can be tested
   const double dx = bx - ax, dy = by - ay;
   const double len = MathSqrt(dx * dx + dy * dy);
   //--- Existing logic
//--- Take the unit direction along the line
   const double ux = dx / len, uy = dy / len;
//--- Take half the thickness as the distance the line reaches
   const double half = ((thick < 1) ? 1 : thick) * 0.5;
//--- Split the color so coverage can drive the alpha
   const uchar bA = (uchar)((argb >> 24) & 0xFF);
   const uint rgb = argb & 0x00FFFFFF;
//--- Bound the pixels the line can possibly touch
   const int minX = (int)MathFloor(MathMin(ax, bx) - half - 1.0);
   const int maxX = (int)MathCeil(MathMax(ax, bx) + half + 1.0);
   const int minY = (int)MathFloor(MathMin(ay, by) - half - 1.0);
   const int maxY = (int)MathCeil(MathMax(ay, by) + half + 1.0);
//--- Visit every pixel inside those bounds
   for(int py = minY; py <= maxY; py++)
      for(int px = minX; px <= maxX; px++)
        {
         //--- Project this pixel onto the line
         const double rx = px + 0.5 - ax, ry = py + 0.5 - ay;
         double along = rx * ux + ry * uy;
         //--- Clamp the projection to the segment ends
         if(along < 0.0)
            along = 0.0;
         if(along > len)
            along = len;
         //--- Measure how far the pixel sits from the segment
         const double ox = rx - ux * along, oy = ry - uy * along;
         const double dist = MathSqrt(ox * ox + oy * oy);
         //--- Take the coverage the distance implies
         const double cov = OmvCoverage(dist - half);
         //--- Skip a pixel the line never touches
         if(cov <= 0.0)
            continue;
         //--- Blend the pixel at that coverage
         BlendCov(px, py, rgb, (double)bA / 255.0 * cov);
        }
  }
We define the "StrokeAA" function to bound the pixels the line could possibly reach. For each pixel, we project its center onto the line segment, clamp the projection to the segment ends (to keep square caps), and measure the perpendicular distance. The "OmvCoverage" function turns that distance into a coverage between nothing and one, which we hand to the blend as an alpha. There is one deliberate exception at the top: a level or plumb line of odd thickness we nudge onto pixel centres, because a horizontal rule that straddles two rows reads as a blurred smear rather than a crisp line. Sloped runs we leave on their true coordinates, where the smoothing is what we want. Now that shapes are covered, only text remains.
Measuring strings once
Every label we place needs its width before we can position it, and asking the terminal each time is the slowest thing the panel does.
//+------------------------------------------------------------------+
//| Measure a string width through the cache                         |
//+------------------------------------------------------------------+
int COmvCanvas::TextWide(const string text)
  {
//--- Return a width already measured under this font
   for(int i = 0; i < m_cached; i++)
      if(m_key[i] == text)
         return m_wide[i];
//--- Measure the string
   int w = 0, h = 0;
   TextSize(text, w, h);
//--- Remember the result while room remains
   if(m_cached < OC_CACHE)
     {
      m_key[m_cached] = text;
      m_wide[m_cached] = w;
      m_high[m_cached] = h;
      m_cached++;
     }
//--- Report the measured width
   return w;
  }
With the "TextWide" function, we look through the strings we have already measured before calling "TextSize" at all, and keep whatever we do measure until the cache fills. The saving matters because our panel redraws the same operator names and shape labels on every frame, so the same handful of strings is measured once and then read back. We clear the cache whenever the font changes, since a width recorded under one size means nothing under another. With a surface that draws, clips, and measures, we can now arrange the graph onto it, which is what we do next.
Arranging Nodes into a Graph Layout
The parser gives us layers, and the canvas gives us pixels, but nothing yet says where a layer goes. So we build an arrangement: a set of boxes with positions, and a set of connections joining them. Before we can place anything, we need somewhere to record what a placed thing looks like.
//+------------------------------------------------------------------+
//| Placed graph node                                                |
//+------------------------------------------------------------------+
struct OmvBox
  {
   // Index the node this box was placed for, or a negative for a port
   int               node;
   // Name a port box, empty on a layer box
   string            portName;
   // Place the left edge in graph space
   int               x;
   // Place the top edge in graph space
   int               y;
   // Measure the box width
   int               w;
   // Measure the box height
   int               h;
   // Depth this box sits at
   int               rank;
   // Role that decides the box coloring
   int               role;
   // Letter the operator calls each listed input
   string            rowLabel[OL_MAX_ROWS];
   // Shape text drawn beside each listed input
   string            rowText[OL_MAX_ROWS];
   // Index the tensor each listed input names
   int               rowTensor[OL_MAX_ROWS];
   // Name the value each listed input reads
   string            rowName[OL_MAX_ROWS];
   // Count the rows this box lists
   int               rowCount;
  };
First, we define the "OmvBox" structure to hold a position, a size, and the depth the box sits at, alongside the index of the node it was placed for. The four parallel row arrays are what let a box list the weights its operator reads, keeping the letter the operator calls each one, the shape text we draw beside it, the tensor it names, and the value name itself. Note that we store these positions in graph space rather than screen space, which matters because panning and zooming then become a single offset applied at drawing time rather than a rearrangement. Next, we describe what joins two of these together.
Describing a connection
A connection carries more than two endpoints, since we want it labelled.
//+------------------------------------------------------------------+
//| Drawn connection between two boxes                               |
//+------------------------------------------------------------------+
struct OmvEdge
  {
   // Index the box the edge leaves
   int               from;
   // Index the box the edge enters
   int               to;
   // Name the value the connection carries
   string            label;
   // Shape text drawn beside the connection
   string            shape;
  };
Then, we define the "OmvEdge" structure to keep the two box indices and the two pieces of text we draw beside the line, one being the value name and the other the shape we went to the trouble of parsing earlier. Keeping the shape here rather than looking it up while drawing means we resolve it once at build time, and every later frame simply reads it. With both structures in place, we can start finding out which boxes connect.
Finding which layer produced a value
Since no layer names its neighbours, we recover every connection by asking who wrote the value a layer reads.
//+------------------------------------------------------------------+
//| Find the node that emits a given name                            |
//+------------------------------------------------------------------+
int COmvLayout::ProducerOf(COmvModel &model, const string name) const
  {
//--- Scan every node for one that emits this name
   for(int i = 0; i < model.Nodes(); i++)
     {
      //--- Fetch this node
      OmvNode node;
      model.NodeAt(i, node);
      //--- Compare every name it produces
      for(int j = 0; j < node.emitCount; j++)
         if(node.emits[j] == name)
            return i;
     }
//--- Report that no node produces it
   return -1;
  }
We define the "ProducerOf" method, walk every node, and compare every name it writes against the one we are looking for, returning the first match. A negative return is meaningful rather than a failure, because it tells us the value came from somewhere other than a layer, either from the graph input or from a stored weight. That distinction is what stops us from drawing a connection back to a tensor that has no box. Armed with this, we can work out how deep each layer sits.
Settling every depth
Here is the rule the whole picture rests on, and we cannot apply it in one pass, because a layer's depth depends on layers we may not have settled yet.
//+------------------------------------------------------------------+
//| Arrange every node into ranks and connect them                   |
//+------------------------------------------------------------------+
bool COmvLayout::Build(COmvModel &model)
  {
//--- Drop any arrangement held from a previous model
   Clear();
//--- Abort when the model holds no nodes
   const int total = model.Nodes();
   if(total <= 0)
      return false;
//--- Start every node at an unknown depth
   int rank[];
   ArrayResize(rank, total);
   ArrayInitialize(rank, -1);
//--- Settle depths by repeated passes so parents always come first
   for(int pass = 0; pass < total; pass++)
     {
      //--- Track whether this pass moved anything
      bool moved = false;
      //--- Visit every node
      for(int i = 0; i < total; i++)
        {
         //--- Fetch this node
         OmvNode node;
         model.NodeAt(i, node);
         //--- Take the deepest producer feeding it
         int deepest = -1;
         for(int j = 0; j < node.feedCount; j++)
           {
            //--- Skip names that are weights rather than node outputs
            if(IsWeight(model, node.feeds[j]))
               continue;
            //--- Find the node emitting this name
            const int producer = ProducerOf(model, node.feeds[j]);
            //--- Track the deepest one settled so far
            if(producer >= 0 && rank[producer] > deepest)
               deepest = rank[producer];
           }
         //--- Sit one level below the deepest producer
         const int want = deepest + 1;
         //--- Existing logic
        }
      //--- Stop as soon as a whole pass changes nothing
      if(!moved)
         break;
     }
   //--- Existing logic
  }
Inside "Build", we start every layer at an unknown depth, then sweep the whole set repeatedly, pushing each layer to sit one level below the deepest thing feeding it. We stop as soon as a complete pass moves nothing, which is how we know the depths have settled without needing to sort the graph first. The call to "IsWeight" earns its place here, because a stored weight is not a layer and must not push anything deeper, or every operator reading a weight would drift down a row it has not earned. Once the depths are known, the boxes and connections follow.
Recording a connection
With every box placed, joining two of them is a matter of noting the pair and what travels between them.
//+------------------------------------------------------------------+
//| Record one connection between two placed boxes                   |
//+------------------------------------------------------------------+
void COmvLayout::AddEdge(const int from, const int to, const string label, const string shape)
  {
//--- Refuse a connection between boxes that were never placed
   if(from < 0 || to < 0 || from >= m_boxes || to >= m_boxes)
      return;
//--- Describe the connection and the value it carries
   OmvEdge edge;
   edge.from = from;
   edge.to = to;
   edge.label = label;
   edge.shape = shape;
//--- Append it to the arrangement
   ArrayResize(m_edge, m_edges + 1);
   m_edge[m_edges++] = edge;
  }
Here, we route every connection through "AddEdge" rather than appending them at each of the several places that create one, and the reason is the guard at the top. A connection to a box that was never placed would leave us drawing a line to an index that does not exist, and having one entry point means that check is written once and cannot be forgotten. The same discipline applies to the port boxes, which we place through a matching routine so the graph inputs and outputs are recorded exactly the way layers are. With every box positioned and every connection recorded, the arrangement is complete, and all that remains is to let the mouse move around it.
Handling Zoom, Pan, and Node Selection
We have an arrangement and a surface, and the panel still cannot be touched. So we name every target the pointer can land on, work out which one it is over, and let the graph move underneath it.
//+------------------------------------------------------------------+
//| Hit targets                                                      |
//+------------------------------------------------------------------+
enum OMV_HIT
  {
   OH_NONE = 0,    // Pointer is over nothing clickable
   OH_HEADER,      // Header band, starts a move
   OH_THEME,       // Light and dark toggle
   OH_MIN,         // Collapse to the header band
   OH_RESTORE,     // Expand back to the full panel
   OH_CLOSE,       // Remove the panel
   OH_FIT,         // Scale the graph to the canvas
   OH_ZOOM_OUT,    // Step the zoom down
   OH_ZOOM_IN,     // Step the zoom up
   OH_INSPECT_X,   // Close the inspector column
   OH_GRIP,        // Bottom right grip, starts a resize
   OH_BAR_V,       // Vertical scrollbar thumb
   OH_BAR_H,       // Horizontal scrollbar thumb
   OH_CANVAS,      // Graph area, starts a pan
   OH_NODE,        // A drawn node box
   OH_ROW,         // A tensor row inside a node box
   OH_LINK,        // A drawn connection
   OH_INFO,        // An expandable row of the inspector
   OH_INFO_BAR     // The inspector scrollbar thumb
  };
First, we define the "OMV_HIT" enumeration to name every place the pointer can be. Naming them rather than passing rectangles around means the rest of the panel asks one question and switches on one answer, whether the pointer is over a close button or a tensor row buried inside a node. Note the last five, which are not chrome at all but parts of the drawn graph, and those are the ones that make the picture something we can interrogate rather than only look at. Next, we work out which of them the pointer is actually over.
Deciding what the pointer is over
Since several targets overlap, the order we test them in is the whole of the logic.
//+------------------------------------------------------------------+
//| Identify the control under a panel point                         |
//+------------------------------------------------------------------+
int COmvPanel::HitTest(const int mx, const int my)
  {
//--- Test the header icons before the band behind them
   if(InRect(m_rTheme, mx, my))
      return OH_THEME;
   if(InRect(m_rMin, mx, my))
      return (m_mode == OM_MIN) ? OH_RESTORE : OH_MIN;
   if(InRect(m_rClose, mx, my))
      return OH_CLOSE;
//--- Report the header band itself
   if(my < OP_HEADER_H)
      return OH_HEADER;
//--- Report nothing else while collapsed
   if(m_mode == OM_MIN)
      return OH_NONE;
//--- Test the grip before the footer behind it
   if(InRect(m_rGrip, mx, my))
      return OH_GRIP;
//--- Test the footer controls
   if(InRect(m_rFit, mx, my))
      return OH_FIT;
   if(InRect(m_rZoomOut, mx, my))
      return OH_ZOOM_OUT;
   if(InRect(m_rZoomIn, mx, my))
      return OH_ZOOM_IN;
   //--- Existing logic
  }
Then, we define the "HitTest" method to walk the targets from the smallest to the largest, returning the first one that contains the point. The order carries real weight: we test the three header icons before the header band itself, because the band spans the whole width and would otherwise swallow every click on them, and we test the resize grip before the footer sitting behind it. The early return when the panel is collapsed is what stops a hidden control from answering for a region that is no longer on screen. Having settled the chrome, we can ask the same question of the graph.
Finding a node under the pointer
Our boxes were placed in graph space, and the pointer arrives in panel space, so we convert the pointer coordinates into graph space before testing anything.
//+------------------------------------------------------------------+
//| Find the node box under a panel point                            |
//+------------------------------------------------------------------+
int COmvPanel::NodeAtPoint(const int mx, const int my)
  {
//--- Convert the point out of canvas space into graph space
   const double gx = (mx - CanvasLeft() - m_panX) / m_zoom;
   const double gy = (my - CanvasTop() - m_panY) / m_zoom;
//--- Test every placed box
   for(int i = 0; i < m_layout.Boxes(); i++)
     {
      //--- Fetch this box
      OmvBox box;
      m_layout.BoxAt(i, box);
      //--- Report the box that contains the point
      if(gx >= box.x && gx < box.x + box.w && gy >= box.y && gy < box.y + box.h)
         return i;
     }
//--- Report that no box holds the point
   return -1;
  }
Here, we define "NodeAtPoint" to undo the pan and the zoom at the pointer position rather than applying them to every box, which is the payoff for having stored positions in graph space earlier. Two lines of arithmetic convert one point, whereas the alternative would be transforming several hundred boxes on every mouse move. The same conversion serves the routines that find a tensor row or a connection, so all three ask their question in the space the arrangement was built in. Now that we can identify what is under the pointer, we can let the view move.
Zooming around the middle of the view
Zooming toward a corner throws whatever we were reading off the screen, so we hold the centre still.
//+------------------------------------------------------------------+
//| Apply a zoom level within the allowed range                      |
//+------------------------------------------------------------------+
void COmvPanel::SetZoom(const double zoom)
  {
//--- Remember where the view center sits in graph space
   const double cx = (ViewW() * 0.5 - m_panX) / m_zoom;
   const double cy = (ViewH() * 0.5 - m_panY) / m_zoom;
//--- Clamp the request to the readable range
   double next = zoom;
   if(next < OP_ZOOM_MIN)
      next = OP_ZOOM_MIN;
   if(next > OP_ZOOM_MAX)
      next = OP_ZOOM_MAX;
   m_zoom = next;
//--- Put the same graph point back under the view center
   m_panX = (int)(ViewW() * 0.5 - cx * m_zoom);
   m_panY = (int)(ViewH() * 0.5 - cy * m_zoom);
   ClampPan();
  }
Here, we define "SetZoom" to note which point of the graph currently sits under the middle of the view, change the scale, then move the pan so that the same point returns to the middle. Without those two extra lines, the graph appears to slide away as it grows, and a reader who zoomed in on a layer would lose it. We clamp the request between "OP_ZOOM_MIN" and "OP_ZOOM_MAX" so nothing shrinks below readable or swells past useful, and we finish by calling "ClampPan", which is what keeps the result inside its bounds.
Keeping the graph inside its area
Panning without limits lets the graph be dragged out of sight entirely, so we settle what is allowed after every move.
//+------------------------------------------------------------------+
//| Hold the pan offsets inside what the graph allows                |
//+------------------------------------------------------------------+
void COmvPanel::ClampPan(void)
  {
//--- Settle which bars are showing before the view is measured
   SizeBars();
//--- Measure the view and the scaled graph
   const int viewW = ViewW(), viewH = ViewH();
   const int fullW = ScaledW(), fullH = ScaledH();
//--- Center the graph when it fits, otherwise hold it against its margin
   if(fullW <= viewW - OP_PAD * 2)
      m_panX = (viewW - fullW) / 2;
   else
     {
      //--- Never pull the graph past the margin on either side
      if(m_panX > OP_PAD)
         m_panX = OP_PAD;
      if(m_panX < viewW - fullW - OP_PAD)
         m_panX = viewW - fullW - OP_PAD;
     }
   //--- Existing logic
  }
Here, we define "ClampPan" to handle the two cases separately. A graph smaller than the view we centre outright, since dragging something that already fits achieves nothing, and a larger one we hold against its margins so an edge can reach the boundary but never pass it. The call to "SizeBars" comes first deliberately, because whether a scrollbar is showing changes how much room the view has, and measuring before settling that would clamp against the wrong width. With the pointer identified and the view constrained, the panel answers the mouse, and we can see what it does with a real model. We will now wire this to the chart using the following code.
//+------------------------------------------------------------------+
//|                                     ONNX Model Viewer Part 2.mq5 |
//|                           Copyright 2026, Allan Munene Mutiiria. |
//|                                   https://t.me/Forex_Algo_Trader |
//+------------------------------------------------------------------+
#property copyright "Copyright 2026, Allan Munene Mutiiria."
#property link      "https://t.me/Forex_Algo_Trader"
#property version   "1.00"
#property strict
#property description "Draw an ONNX model graph on the chart"

#include "OMV Panel.mqh"

//+------------------------------------------------------------------+
//| Inputs                                                           |
//+------------------------------------------------------------------+
input group "Model"
input string ModelFile = "ONNX Model Viewer\\model.onnx"; // Model File Path Inside MQL5 Files

//+------------------------------------------------------------------+
//| Global Variables                                                 |
//+------------------------------------------------------------------+
COmvPanel panel; // Owns the canvas, the parsed model and the event routing

//+------------------------------------------------------------------+
//| Expert initialization function                                   |
//+------------------------------------------------------------------+
int OnInit()
  {
//--- Build the panel and read the model into it
   if(!panel.Init(ChartID(), ModelFile))
      return(INIT_FAILED);
   return(INIT_SUCCEEDED);
  }

//+------------------------------------------------------------------+
//| Expert deinitialization function                                 |
//+------------------------------------------------------------------+
void OnDeinit(const int reason)
  {
//--- Release the canvas and restore the chart
   panel.Destroy();
   ChartRedraw();
  }

//+------------------------------------------------------------------+
//| ChartEvent function                                              |
//+------------------------------------------------------------------+
void OnChartEvent(const int id, const long &lparam, const double &dparam, const string &sparam)
  {
//--- Route hover, drag and click into the panel
   panel.OnEvent(id, lparam, dparam, sparam);
  }
//+------------------------------------------------------------------+
Finally, we declare one "COmvPanel" instance and give it the three event handlers. In OnInit we hand it the chart and the model path, and a failure there returns "INIT_FAILED", so a missing file stops us cleanly rather than leaving an empty panel on the chart. In "OnDeinit" we release the canvas and redraw, since a bitmap left behind would outlive the program that made it. The whole of the interaction arrives through OnChartEvent, which is the handler that separates this from the previous part, where we printed once and stopped. Everything the mouse does now reaches the panel through that single line, and we can attach it to a chart and see what it draws. We do this in the next section.
Visualization
We compile the program, load it onto a chart with the model sitting in the terminal's Files folder, and work through the panel to confirm the graph reads correctly. The result is shown in the video below.
During testing, the panel drew the chain from input to output, placed each layer beneath its producer, and labeled every connection with the tensor shape. Each dense layer listed the weights it reads as rows, so we could see the shape of a weight matrix and its bias without opening anything. Clicking a row filled the inspector with that tensor, naming it and reporting its category, type and shape alongside its minimum, maximum, mean, spread and sparsity, which is what tells us at a glance whether a layer was trained or left untouched. Zoom and pan kept the graph within its area. The view centered the graph when it fit and clamped it to the margins otherwise. The stats strip remained fixed while the graph scrolled beneath it.
Conclusion
We have taken the model out of the log and put it on the chart. The parser now carries the shapes of values passing between layers and the settings each operator was given, so a connection can be labeled and a layer can describe itself. On top of it sits a canvas that blends every pixel by how much of it a shape covers, and holds all of that inside a clip rectangle so a graph can scroll beneath a header without touching it. The arrangement places each layer one depth below whatever feeds it, which is what makes a branch draw as two columns rather than a chain, and the connections are recovered by matching the names layers read against the names they write. Where we once traced a list of names by eye to work out the shape of a network, we now see it, move around it, and click a layer to read what it holds. In the next part, we will go inside the layers themselves and draw the neurons, coloring every connection by the weight it carries. Stay tuned.
Attachments
| S/N | Name | Type | Description |
|---|---|---|---|
| 1 | make_model.py | Python script | Builds the sample classification network and saves it as model.onnx under MQL5\Files\ONNX Model Viewer Part 2\ |
| 2 | OMV Protobuf.mqh | Include file | Defines the wire type constants and the byte cursor that decodes variable-length integers, tags, text, nested blocks and fixed-width values |
| 3 | OMV Model.mqh | Include file | Defines the node, tensor and port structures, and implements the parser that now also reads node attributes, the shapes of values passing between layers, and the weights themselves |
| 4 | OMV Canvas.mqh | Include file | Provides the drawing surface, holding the clip rectangle, the pixel blend, the smoothed lines, discs and rounded panels, and the cached text measurements |
| 5 | OMV Panel.mqh | Include file | Arranges the nodes into ranks, routes the connections between them, draws the chrome and the inspector, and answers the mouse for hover, drag, zoom and selection |
| 6 | ONNX Model Viewer Part 2.mq5 | Expert Advisor | The main program entry point that declares the model path, includes the four module headers, builds the panel on initialization, and forwards every chart event to it |
| 7 | MQL5.zip | Archive | A ready-to-extract archive with the MQL5 folder as its root. Unzip it into your MetaTrader 5 terminal data folder; every file is placed in its correct location — the code under MQL5\Experts\ONNX Model Viewer Part 2\ and the Python script under MQL5\Files\ONNX Model Viewer Part 2\ — ready to compile. |
Warning: All rights to these materials are reserved by MetaQuotes Ltd. Copying or reprinting of these materials in whole or in part is prohibited.
This article was written by a user of the site and reflects their personal views. MetaQuotes Ltd is not responsible for the accuracy of the information presented, nor for any consequences resulting from the use of the solutions, strategies or recommendations described.

 Competitive Swarm Optimizer (CSO)
 Wasserstein Distance for Live Feature-Drift Detection in MQL5: Monitoring ONNX Model Inputs with Optimal Transport
 Neural Networks in Trading: A Unified View of Space and Time (Global-Local Attention)
 Position Management: Deriving a Self-Calibrating Exit Ladder From Historical MFE in MQL5

- Free trading apps
- Over 8,000 signals for copying
- Economic news for exploring financial markets
You agree to website policy and terms of use