Creating Custom Indicators in MQL5 (Part 13): An Accelerating Trend Stop Confirmed by VWAP
 121
 0

Contents
- Introduction
- Understanding Accelerating Stops and VWAP Confirmation
- Building the Trend Stop Engine
- Rendering the Stop Line, Cloud, and Flip Levels
- Visualization
- Conclusion
Introduction
A trailing stop that moves at a fixed distance treats every market the same. When price drifts sideways, the stop is too far away and gives back much of the move before it signals the trend is over. When price runs, the stop is too close and gets clipped by noise. We also flip on every close through the line without confirmation, treating reversals and single overextended candles the same. This article is for MetaQuotes Language 5 (MQL5) developers and traders who want a stop that adjusts its own urgency and tells us which of its flips deserve attention.
In our previous article (Part 12), we mapped traded volume with a volume profile heatmap. In this article, we build a trend stop that reseeds a fixed number of slow Average True Range (ATR) multiples away on every flip, then accelerates toward price bar by bar, gaining speed faster the further the market has run from its Volume Weighted Average Price (VWAP). Every flip is then graded against the session, weekly, and monthly VWAP, and the chart keeps the level and the arrow it left behind. By the end of this article, we will be able to:
- Drive a trailing stop from an acceleration model, reseeding on each flip and scaling every step by volatility so the settings are expressed in the same units on any symbol and timeframe.
- Boost that acceleration by distance from the VWAP, closing the gap faster when price is stretched and easing off when it is trading near fair value.
- Grade each flip by VWAP agreement, mark it with a confirmed or filtered arrow, and keep the flip level on the chart until price closes through it.
- Draw the stop line, its cloud, and candles shaded by distance from the stop, publish the stop, the trend, and the flip grade to buffers, and send optional alerts on flips and level breaks.
Understanding Accelerating Stops and VWAP Confirmation
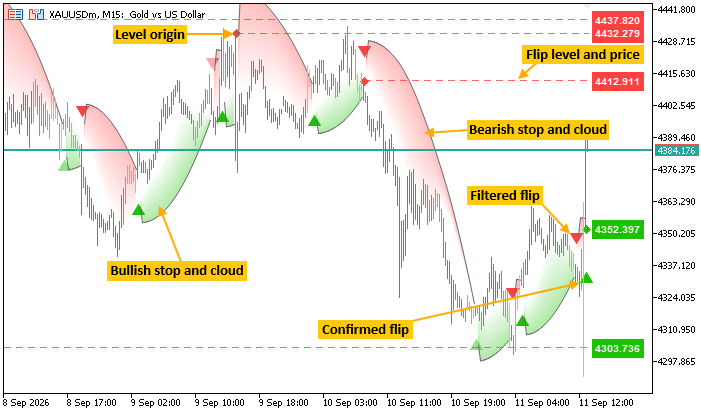
A stop that trails at a fixed distance cannot be optimal in both slow and fast markets, so instead we let the distance close on its own. On a flip, we reseed the stop a set number of slow ATR multiples beyond the bar that caused it, set the speed to zero, and from the next bar on, the speed grows while each step moves the stop by the slow range times the step size times that speed. Early bars barely move it, giving the new trend room to breathe, and later bars close the gap quickly, so a trend that stalls meets the stop sooner than it would under a fixed trail.
VWAP decides which flips matter. Price far from its volume-weighted average is stretched, so we raise the acceleration as that distance grows and the stop hurries in; price near VWAP is trading at fair value, so it eases off. The same reference also grades the flip. It marks the flip as confirmed when VWAP is on the side of the new trend and as filtered when it is not. The flip level remains on the chart until a close breaks it. In brief, the following diagram shows what we intend to build.
Building the Trend Stop Engine
We start with the declarations that define the indicator and the settings that drive its behavior. The code blocks follow the order of the explanation rather than the order of the file, and some small helpers, such as "TrueRangeOf", "ReferenceVwap", "UpdateVwapAgreement", and "ResetIndicatorState", are not shown. We compile from the attached file, where every helper and the "CTrendCanvas" class are defined before they are used.
Properties, Enumerations, Inputs, and Structures
We register the indicator to draw on the price chart with eight buffers behind two plots, expose the settings that govern the acceleration, the VWAP filter, the levels, and the display, and define the records that hold a flip level and a flip marker.
//+------------------------------------------------------------------+
//|                                     VWAP Adaptive Trend Stop.mq5 |
//|                           Copyright 2026, Allan Munene Mutiiria. |
//|                                   https://t.me/Forex_Algo_Trader |
//+------------------------------------------------------------------+
#property copyright "Copyright 2026, Allan Munene Mutiiria."
#property link      "https://t.me/Forex_Algo_Trader"
#property version   "1.00"
#property indicator_chart_window
#property indicator_buffers 8
#property indicator_plots   2
#include <Canvas/Canvas.mqh>
//+------------------------------------------------------------------+
//| VWAP reference enumeration                                       |
//+------------------------------------------------------------------+
enum ENUM_VWAP_REFERENCE
  {
   VWAP_SESSION, // Session VWAP
   VWAP_WEEK,    // Weekly VWAP
   VWAP_MONTH,   // Monthly VWAP
   VWAP_ANY,     // Any One Agrees
   VWAP_ALL      // All Must Agree
  };
//+------------------------------------------------------------------+
//| Inputs                                                           |
//+------------------------------------------------------------------+
input group "TREND STOP"
input double InpAccelerationRate = 0.12;   // Acceleration Per Bar
input double InpMaxSpeed = 3.0;            // Maximum Speed (0 = uncapped)
input double InpStartDistanceAtr = 2.0;    // Start Distance From Price (slow ATR multiples)
input double InpStepSizeAtr = 0.15;        // Step Size Per Speed Unit (slow ATR multiples)
input int InpSmoothingBars = 3;            // Smoothing Bars
input int InpFastAtrPeriod = 14;           // Fast ATR Period
input int InpSlowAtrPeriod = 100;          // Slow ATR Period
input int InpMaxHistoryBars = 3000;        // Max History Bars To Scan (0 = all)

input group "VWAP"
input ENUM_VWAP_REFERENCE InpVwapReference = VWAP_SESSION;     // VWAP That Must Agree With A Flip
input ENUM_VOLUME_SOURCE InpVolumeSource = VOLUME_SOURCE_TICK; // Volume Source
input double InpVwapSpeedBoost = 1.5;                          // Speed Boost When Extended From VWAP
input double InpVwapBoostRangeAtr = 4.0;                       // Distance For Full Boost (fast ATR multiples)

input group "FLIP LEVELS"
input bool InpShowFlipLevels = true;                  // Show Flip Levels
input ENUM_LINE_STYLE InpFlipLevelStyle = STYLE_DASH; // Flip Level Style
input int InpFlipLevelWidth = 1;                      // Flip Level Width
input int InpFlipLevelOpacity = 80;                   // Flip Level Opacity Percent
input bool InpShowFlipLevelPrice = true;              // Show Price Label On Flip Levels
input int InpLabelFontSize = 12;                      // Price Label Font Size (pixels)
input int InpMaxFlipLevels = 10;                      // Max Flip Levels Kept (broken ones leave at once)

input group "DISPLAY"
input bool InpShowStopLine = true;      // Show The Stop Line
input int InpStopLineWidth = 1;         // Stop Line Width (pixels, measured across the line)
input bool InpShowCloud = true;         // Show The Cloud
input int InpCloudOpacity = 35;         // Cloud Opacity At The Stop Line (percent, fades to zero at price)
input bool InpColorCandles = true;      // Color Candles By Distance From The Stop
input bool InpShowFlipMarkers = true;   // Show Flip Arrows
input double InpArrowOffsetAtr = 1.2;   // Arrow Offset From The Stop (fast ATR multiples)
input int InpArrowSize = 10;            // Arrow Size (pixels from tip to base)
input int InpMaxFlipMarkersKept = 100;  // Flip Markers Kept On Chart

input group "COLORS"
input color InpBullishColor = C'26,194,0';   // Bullish Color
input color InpBearishColor = C'255,64,64';  // Bearish Color
input color InpStopLineColor = clrDimGray;   // Stop Line Color

input group "ALERTS"
input bool InpAlertConfirmedFlip = true; // Alert On A VWAP Confirmed Flip
input bool InpAlertFilteredFlip = false; // Alert On A Flip The VWAP Disagrees With
input bool InpAlertLevelBreak = false;   // Alert When A Flip Level Breaks
input bool InpAlertPopup = true;         // Popup Alert
input bool InpAlertJournal = true;       // Print To Journal
//+------------------------------------------------------------------+
//| Flip level structure                                             |
//+------------------------------------------------------------------+
struct FlipLevel
  {
   int               bar;       // Bar the flip happened on
   double            price;     // Level price
   bool              isBullish; // Born on a bullish flip
  };
//+------------------------------------------------------------------+
//| Flip marker structure                                            |
//+------------------------------------------------------------------+
struct FlipMarker
  {
   int               bar;         // Bar the flip happened on
   double            price;       // Anchor price for the arrow
   bool              isBullish;   // Direction of the new trend
   bool              isConfirmed; // The reference VWAP agreed
  };
Four settings in the first group carry the entire engine. We place the stop after a flip with "InpStartDistanceAtr", set how quickly it gains speed with "InpAccelerationRate", turn that speed into a price move with "InpStepSizeAtr", and keep it from running away with "InpMaxSpeed". The engine distances are given in slow ATR multiples, so one set of numbers is expressed in the same units on gold as on a currency pair, although we have not tested how well one setting carries across instruments. The "ENUM_VWAP_REFERENCE" enumeration gives us five ways to judge a flip, from a single period to demanding all three agree. Two structures earn their place because a flip leaves behind more than a direction: a price level that stands until a close breaks it, and an arrow recording whether volume agreed. With the settings fixed, we need somewhere to keep what the indicator learns.
The defaults are starting points rather than tuned values. At the base rate of 0.12, spread over the three smoothing bars, the speed gains 0.04 units per bar, and each unit moves the stop 0.15 slow ATR, so with price held flat the stop closes its starting gap of two slow ATR in 26 bars. At the full boost of 1.5, that drops to 21 bars. The maximum speed of 3.0 is reached only after 50 to 75 bars of one trend, so it limits long runs rather than fresh ones. Raising the acceleration rate or the step size makes the stop faster and more sensitive, lowering them makes it slower and smoother, and a boost of 1.0 switches the VWAP influence off.
The alerts group covers three events: a flip the reference VWAP confirms, which is on by default, and a flip it disagrees with and a close that breaks a flip level, which are both off. Each alert goes to a popup, the journal, or both. Only the newest closed bar can raise one during live updates, so a full recalculation of history never replays old alerts.
Declaring the Canvas, Buffers, and Engine State
The canvas, the eight buffers behind the two plots, the working arrays for the ranges and averages, and the live engine variables all get declared here.
//+------------------------------------------------------------------+
//| Global Variables                                                 |
//+------------------------------------------------------------------+
#define OBJECT_PREFIX g_objectPrefix          // Prefix for the canvas object, unique per instance
#define CANDLE_SHADES 8                       // Gradient steps per direction for the candle plot
#define EDGE_MARGIN 64                        // Pixels beyond the canvas that still count as near
string g_objectPrefix = "VATS_";              // Instance prefix, finalized in OnInit
CTrendCanvas g_canvas;                        // The single full chart canvas
string g_canvasName = "";                     // Name of the bitmap label carrying the canvas
double g_candleOpen[];                        // Colored candle plot: open
double g_candleHigh[];                        // Colored candle plot: high
double g_candleLow[];                         // Colored candle plot: low
double g_candleClose[];                       // Colored candle plot: close
double g_candleColorIndex[];                  // Colored candle plot: palette index
double g_stopBuffer[];                        // Data: raw trailing stop on the bar, no holes
double g_trendBuffer[];                       // Data: 1 bullish, -1 bearish, 0 not started
double g_flipBuffer[];                        // Data: 2 confirmed up, 1 filtered up, -2 confirmed down, -1 filtered down
double g_stopValues[];                        // Raw stop per bar
double g_smoothedStop[];                      // Stop after smoothing, the drawn stop line
double g_midPrices[];                         // Bar midpoints
double g_priceReference[];                    // Smoothed midpoint the cloud fades toward
double g_trueRange[];                         // True range per bar
double g_fastAtr[];                           // Wilder fast ATR per bar
double g_slowAtr[];                           // Simple average true range per bar
double g_sessionVwap[];                       // Session VWAP per bar
double g_weeklyVwap[];                        // Weekly VWAP per bar
double g_monthlyVwap[];                       // Monthly VWAP per bar
double g_fastSeedSum = 0.0;                   // Running true range sum for the fast ATR seed
double g_slowSum = 0.0;                       // Rolling sum of true range over the slow window
int g_slowSumBar = -1;                        // Bar the rolling sum currently covers
double g_sessionPriceVolume = 0.0;            // Session cumulative price times volume
double g_sessionVolume = 0.0;                 // Session cumulative volume
double g_weeklyPriceVolume = 0.0;             // Week cumulative price times volume
double g_weeklyVolume = 0.0;                  // Week cumulative volume
double g_monthlyPriceVolume = 0.0;            // Month cumulative price times volume
double g_monthlyVolume = 0.0;                 // Month cumulative volume
bool g_engineStarted = false;                 // The stop has been seeded
bool g_isBullish = true;                      // Current trend direction
double g_stopPrice = 0.0;                     // Live raw stop
double g_speed = 0.0;                         // Live speed in step units
int g_firstDrawBar = 0;                       // First bar carrying a stop
FlipLevel g_flipLevels[];                     // Flip levels, newest last
FlipMarker g_flipMarkers[];                   // Ring of flip markers
int g_flipMarkerSlot = 0;                     // Next marker ring slot
bool g_sessionAgrees = false;                 // Session VWAP agrees with the trend
bool g_weeklyAgrees = false;                  // Weekly VWAP agrees with the trend
bool g_monthlyAgrees = false;                 // Monthly VWAP agrees with the trend
datetime g_lastProcessedBarTime = 0;          // Time of the last closed bar processed
int g_ratesTotal = 0;                         // Bars on the chart at the last calculation
int g_chartWidth = 0;                         // Viewport key: chart width in pixels
int g_chartHeight = 0;                        // Viewport key: chart height in pixels
int g_chartScale = -1;                        // Viewport key: chart scale
int g_firstVisibleBar = -1;                   // Viewport key: series index of the first visible bar
int g_visibleBars = -1;                       // Viewport key: number of visible bars
double g_priceMin = 0.0;                      // Viewport key: lowest visible price
double g_priceMax = 0.0;                      // Viewport key: highest visible price
int g_barPixels = 1;                          // Pixel width of one bar at the current scale
bool g_canvasReady = false;                   // Canvas created and sized
color g_chartBackgroundColor = clrWhite;      // Cached chart background for the candle palette
Four variables run the whole engine: the direction, the raw stop price, the current speed, and whether it has been seeded. Everything else we derive per bar. We keep two stop arrays on purpose. "g_stopValues" stores the raw stop without gaps for programmatic use. "g_smoothedStop" stores the averaged series for drawing; we blank it on a flip bar so the line breaks instead of jumping across the reseed. All three VWAP series sit in parallel rather than only the reference one, since we may grade a flip against any combination of them. Before placing a stop anywhere, we need the volatility it is measured in.
Computing the Fast and Slow Average True Ranges
True range gets measured once per bar and feeds two averages, a Wilder-smoothed fast range for our distance work and a plain rolling average for the slow range every step is scaled by.
//+------------------------------------------------------------------+
//| Update both average true ranges for one bar                      |
//+------------------------------------------------------------------+
void UpdateRanges(const int bar, const double &high[], const double &low[], const double &close[])
  {
//--- The first bar has no previous close
   if(bar < 1)
     {
      //--- Leave both empty
      g_fastAtr[bar] = EMPTY_VALUE;
      g_slowAtr[bar] = EMPTY_VALUE;
      return;
     }
//--- Store the true range once
   double trueRange = TrueRangeOf(bar, high, low, close);
   g_trueRange[bar] = trueRange;
//--- Fast ATR: simple average seed, then Wilder smoothing
   if(bar < InpFastAtrPeriod)
     {
      //--- Still seeding
      g_fastSeedSum += trueRange;
      g_fastAtr[bar] = EMPTY_VALUE;
     }
   else
      if(bar == InpFastAtrPeriod)
        {
         //--- Close the seed window
         g_fastSeedSum += trueRange;
         g_fastAtr[bar] = g_fastSeedSum / InpFastAtrPeriod;
        }
      else
         if(g_fastAtr[bar - 1] != EMPTY_VALUE)
           {
            //--- Recursive from here on
            g_fastAtr[bar] = (g_fastAtr[bar - 1] * (InpFastAtrPeriod - 1) + trueRange) / InpFastAtrPeriod;
           }
         else
           {
            //--- A gap in the recursion reseeds from the plain range
            g_fastAtr[bar] = trueRange;
           }
//--- Slow range: rolling simple average of true range
   if(bar < InpSlowAtrPeriod)
     {
      //--- Not enough bars yet
      g_slowAtr[bar] = EMPTY_VALUE;
      return;
     }
   if(g_slowSumBar == bar - 1)
     {
      //--- One value in, one value out
      g_slowSum += trueRange - g_trueRange[bar - InpSlowAtrPeriod];
     }
   else
     {
      //--- Seed the whole window, computing any range not yet stored
      g_slowSum = 0.0;
      for(int i = bar - InpSlowAtrPeriod + 1; i <= bar; i++)
        {
         //--- Fill gaps as they are met
         if(g_trueRange[i] == EMPTY_VALUE)
            g_trueRange[i] = TrueRangeOf(i, high, low, close);
         g_slowSum += g_trueRange[i];
        }
     }
   g_slowSumBar = bar;
   g_slowAtr[bar] = g_slowSum / InpSlowAtrPeriod;
  }
Two ranges answer two different questions. The fast one has to react, since we measure distance from VWAP in its multiples and want that reading to reflect conditions right now, while we keep the slow one deliberately sluggish so our reseed distance and step size do not lurch when a single violent bar shows up. Maintaining the slow average as a rolling sum, adding the arriving range and dropping the departing one, turns a hundred-bar average into two operations per bar, and we fall back to the full seeding loop only when that sum has lost continuity. Volatility gives us the scale; VWAP gives us the judgment.
Accumulating the VWAPs and Grading a Flip
Running price-volume and volume totals carry the session, week, and month averages, and we record which of the three sit on the side of the current trend before reading those flags according to the reference setting.
//+------------------------------------------------------------------+
//| Update the three volume weighted averages for one bar            |
//+------------------------------------------------------------------+
void UpdateVwaps(const int bar, const datetime &time[], const double &high[], const double &low[],
                 const long &tick_volume[], const long &volume[])
  {
//--- Reset each accumulator when its period turns over
   datetime previous = (bar > 0) ? time[bar - 1] : 0;
   if(IsNewPeriod(previous, time[bar], 0))
     {
      //--- New session
      g_sessionPriceVolume = 0.0;
      g_sessionVolume = 0.0;
     }
   if(IsNewPeriod(previous, time[bar], 1))
     {
      //--- New week
      g_weeklyPriceVolume = 0.0;
      g_weeklyVolume = 0.0;
     }
   if(IsNewPeriod(previous, time[bar], 2))
     {
      //--- New month
      g_monthlyPriceVolume = 0.0;
      g_monthlyVolume = 0.0;
     }
//--- Accumulate the midpoint against volume
   double midpoint = (high[bar] + low[bar]) / 2.0;
   double barVolume = ReadBarVolume(tick_volume, volume, bar);
   g_sessionPriceVolume += midpoint * barVolume;
   g_sessionVolume += barVolume;
//--- The longer periods take the same contribution
   g_weeklyPriceVolume += midpoint * barVolume;
   g_weeklyVolume += barVolume;
   g_monthlyPriceVolume += midpoint * barVolume;
   g_monthlyVolume += barVolume;
//--- Publish, falling back to the midpoint on a volumeless bar
   g_sessionVwap[bar] = g_sessionVolume > 0.0 ? g_sessionPriceVolume / g_sessionVolume : midpoint;
   g_weeklyVwap[bar] = g_weeklyVolume > 0.0 ? g_weeklyPriceVolume / g_weeklyVolume : midpoint;
   g_monthlyVwap[bar] = g_monthlyVolume > 0.0 ? g_monthlyPriceVolume / g_monthlyVolume : midpoint;
  }
//+------------------------------------------------------------------+
//| Whether the reference setting counts the VWAPs as agreeing       |
//+------------------------------------------------------------------+
bool VwapAgrees()
  {
//--- Each setting reads the three flags differently
   switch(InpVwapReference)
     {
      case VWAP_SESSION:
         return(g_sessionAgrees);
      //--- Single timeframe settings read one flag
      case VWAP_WEEK:
         return(g_weeklyAgrees);
      case VWAP_MONTH:
         return(g_monthlyAgrees);
      //--- Combined settings read all three
      case VWAP_ANY:
         return(g_sessionAgrees || g_weeklyAgrees || g_monthlyAgrees);
      default:
         return(g_sessionAgrees && g_weeklyAgrees && g_monthlyAgrees);
     }
  }
All three accumulators take the same contribution on every bar and differ only in when we clear them, so a single pass maintains the lot, each reset coming from a boundary test that compares the calendar parts of the previous and current bar times. Agreement itself is one comparison, since a bullish trend wants price at or above an average and a bearish one wants it at or below. Splitting the recording from the reading is what makes all five settings free to us: the flags stay current, and only the combination rule changes. Demanding all three agree leaves us fewer, stricter flips, while any one agreeing leaves us many, and that is our main dial on how selective the indicator becomes. The same distance that grades a flip also decides how urgently we close the stop in.
Scaling the Acceleration by Distance from the VWAP
The speed gained on a bar rises as price stretches away from the reference average, and we hold it flat once the stretch is extreme.
//+------------------------------------------------------------------+
//| Speed gained on one bar, scaled by distance from the VWAP        |
//+------------------------------------------------------------------+
double AccelerationAt(const int bar, const double &close[])
  {
//--- Without a fast range there is no distance to measure
   double fastRange = g_fastAtr[bar];
   if(fastRange == EMPTY_VALUE || fastRange <= 0.0)
      return(InpAccelerationRate);
//--- Distance from the reference VWAP as a share of the full boost range
   double distance = MathAbs(close[bar] - ReferenceVwap(bar));
   double share = MathMin(distance / (fastRange * InpVwapBoostRangeAtr), 1.0);
//--- Scale between the base rate and the boosted rate
   return(InpAccelerationRate * (1.0 + (InpVwapSpeedBoost - 1.0) * share));
  }
Distance goes in fast ATR multiples rather than points, so one boost setting means the same stretch relative to recent volatility wherever we apply it. Saturating the share at one matters just as much: past the full boost range the acceleration stops climbing, so an extreme move cannot keep raising the rate. It does not keep the stop itself from crossing price. Nothing limits the step against the current bar, so a fast stop can move past price, and the next close then flips the trend. Below is what these settings do to the stop over the bars following a flip, with price held flat so only the engine is moving.
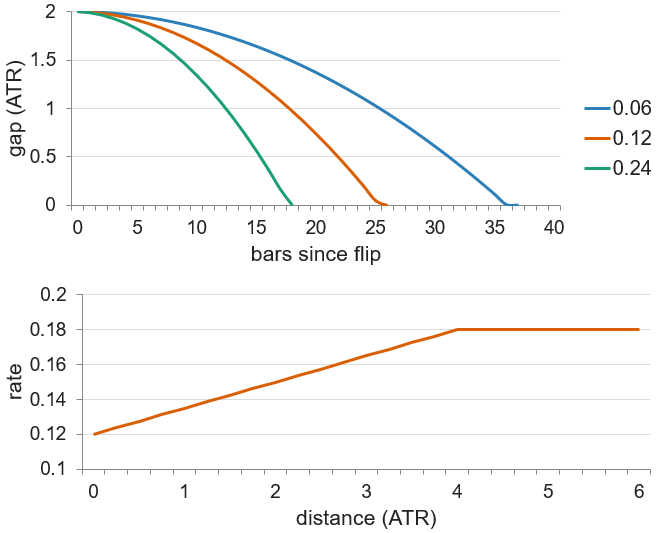
The curve is the point. Over the first few bars we barely move the gap, giving a new trend room to establish itself, then it closes faster and faster as speed accumulates, so we abandon a trend that stops making progress rather than waiting it out at a fixed distance. Tripling the acceleration cuts the bars to contact by about forty percent, since the gap closed grows with the square of the bar count. On the right, the boost rides on top of that, lifting the rate from its base figure to the boosted one as price stretches, then holding flat once the full range is passed. What a flip leaves behind, we keep.
Keeping the Flip Levels
Any level a later close has broken leaves the registry, and we compact the survivors in a single pass.
//+------------------------------------------------------------------+
//| Mark flip levels that this bar closed through                    |
//+------------------------------------------------------------------+
void UpdateFlipLevels(const int bar, const double barClose, const bool alertable)
  {
//--- A bullish level breaks on a close below it and the reverse, broken levels leave the registry
   int kept = 0;
   for(int i = 0; i < ArraySize(g_flipLevels); i++)
     {
      //--- Levels born on this bar cannot break yet
      bool broken = g_flipLevels[i].bar < bar
                    && (g_flipLevels[i].isBullish ? (barClose < g_flipLevels[i].price) : (barClose > g_flipLevels[i].price));
      if(broken)
        {
         //--- Announce and drop
         if(InpAlertLevelBreak && alertable)
            SendTrendAlert("Flip level " + DoubleToString(g_flipLevels[i].price, _Digits) + " broken");
         continue;
        }
      //--- Compact the survivors
      if(kept != i)
         g_flipLevels[kept] = g_flipLevels[i];
      kept++;
     }
   ArrayResize(g_flipLevels, kept);
  }
A level stands until a close goes through it in the direction that invalidates it, below for a bullish level and above for a bearish one, so what we leave on the chart is only what the market still respects. We exclude levels born on the current bar, because the close that caused the flip already sits on the wrong side of the low or high we took the level from. New levels and arrows go in the same way, appending the level and dropping the oldest past the cap, with arrows written into a fixed ring since we never examine one again. Everything is now in place for a bar to run the engine.
Running a Bar Through the Engine
We seed or flip the trend, reseed the stop and record the level and arrow when it turns, otherwise accelerate toward price, and publish the stop, the trend, and the flip grade.
//+------------------------------------------------------------------+
//| Process one bar: trend, stop, levels, buffers                    |
//+------------------------------------------------------------------+
void ProcessBar(const int bar, const bool alertable, const datetime &time[], const double &open[], const double &high[],
                const double &low[], const double &close[], const long &tick_volume[], const long &volume[])
  {
//--- Midpoint for the price reference
   g_midPrices[bar] = (high[bar] + low[bar]) / 2.0;
//--- Blank this bar's signal slot
   g_flipBuffer[bar] = 0.0;
//--- Wait for the slow range
   double slowRange = g_slowAtr[bar];
   if(slowRange == EMPTY_VALUE || slowRange <= 0.0)
     {
      //--- Nothing to publish yet
      g_stopValues[bar] = EMPTY_VALUE;
      g_smoothedStop[bar] = EMPTY_VALUE;
      g_priceReference[bar] = EMPTY_VALUE;
      //--- Buffers stay empty too
      g_stopBuffer[bar] = EMPTY_VALUE;
      g_trendBuffer[bar] = 0.0;
      PublishCandle(bar, open, high, low, close, EMPTY_VALUE, true);
      return;
     }
//--- Seed on the first usable bar
   bool flipped = false;
   if(!g_engineStarted)
     {
      //--- Start bullish under the bar
      g_isBullish = true;
      g_stopPrice = low[bar] - slowRange * InpStartDistanceAtr;
      g_speed = 0.0;
      //--- From here the engine runs and the first trend begins
      g_engineStarted = true;
      g_firstDrawBar = bar;
     }
   else
     {
      //--- A close through the stop flips the trend
      bool nowBullish = g_isBullish;
      if(close[bar] < g_stopPrice)
         nowBullish = false;
      if(close[bar] > g_stopPrice)
         nowBullish = true;
      flipped = (nowBullish != g_isBullish);
      g_isBullish = nowBullish;
     }
//--- Which VWAPs sit with the trend
   UpdateVwapAgreement(bar, g_isBullish, close);
//--- A flip reseeds the stop and records the level and the marker
   if(flipped)
     {
      //--- Reseed away from the bar that caused the flip
      g_stopPrice = g_isBullish ? low[bar] - slowRange * InpStartDistanceAtr : high[bar] + slowRange * InpStartDistanceAtr;
      g_speed = 0.0;
      //--- Grade the flip against the reference VWAP
      bool confirmed = VwapAgrees();
      g_flipBuffer[bar] = (g_isBullish ? 1.0 : -1.0) * (confirmed ? 2.0 : 1.0);
      AddFlipLevel(bar, g_isBullish ? low[bar] : high[bar], g_isBullish);
      //--- Arrow sits just beyond the flip candle, under a bullish flip and over a bearish one
      double fastRange = g_fastAtr[bar];
      double offset = (fastRange == EMPTY_VALUE ? slowRange : fastRange) * InpArrowOffsetAtr;
      AddFlipMarker(bar, g_isBullish ? low[bar] - offset : high[bar] + offset, g_isBullish, confirmed);
      //--- Announce
      string direction = g_isBullish ? "Bullish" : "Bearish";
      if(confirmed && InpAlertConfirmedFlip && alertable)
         SendTrendAlert(direction + " flip confirmed by VWAP at " + DoubleToString(close[bar], _Digits));
      if(!confirmed && InpAlertFilteredFlip && alertable)
         SendTrendAlert(direction + " flip, VWAP disagrees, at " + DoubleToString(close[bar], _Digits));
     }
   else
      if(bar > g_firstDrawBar)
        {
         //--- Accelerate, capped, then close the gap toward price
         g_speed += AccelerationAt(bar, close) / InpSmoothingBars;
         if(InpMaxSpeed > 0.0 && g_speed > InpMaxSpeed)
            g_speed = InpMaxSpeed;
         double step = slowRange * InpStepSizeAtr * g_speed;
         g_stopPrice += g_isBullish ? step : -step;
        }
//--- Publish the raw stop of this bar
   g_stopValues[bar] = g_stopPrice;
//--- Levels this bar closed through
   UpdateFlipLevels(bar, close[bar], alertable);
//--- Smoothed series the stop line and the cloud are drawn from, empty on the flip bar so the run breaks there
   g_smoothedStop[bar] = flipped ? EMPTY_VALUE : AverageOver(g_stopValues, bar, InpSmoothingBars);
   g_priceReference[bar] = AverageOver(g_midPrices, bar, InpSmoothingBars * 5);
//--- Publish the trend context
   g_stopBuffer[bar] = g_stopValues[bar];
   g_trendBuffer[bar] = g_isBullish ? 1.0 : -1.0;
//--- The flip bar shades from the raw stop
   PublishCandle(bar, open, high, low, close, flipped ? g_stopValues[bar] : g_smoothedStop[bar], g_isBullish);
  }
Two separate comparisons decide the flip rather than one, so a close landing exactly on the stop leaves our trend untouched instead of forcing an arbitrary direction. We reseed from the low or high of the candle that caused the flip, not its close, which puts the new stop beyond the full extent of the move rather than beyond one price inside it. Dividing the acceleration by the smoothing bars keeps our drawn line and the raw stop in step. The grade goes out as a signed value with a magnitude of two for a confirmed flip and one for a filtered one, so a program reads direction and conviction off a single buffer. The engine now produces everything we need to draw, which is what we will do in the next section.
Rendering the Stop Line, Cloud, and Flip Levels
Everything the engine produced now has to reach the screen, and that starts with the surface we paint on.
Extending the Canvas with Pixel Blending
The standard canvas overwrites what it touches, so we extend it with source-over blending and text that composites by its own glyph coverage.
//+------------------------------------------------------------------+
//| Canvas with a clean text compositor                              |
//+------------------------------------------------------------------+
class CTrendCanvas : public CCanvas
  {
public:
   void              BlendPixel(const int x, const int y, const uint argb);                                   // Source over blend of one pixel
   void              DrawTextClean(const int x, const int y, const string text, const uint argb, const uint alignment); // Text composited by glyph coverage
  };
//+------------------------------------------------------------------+
//| Source over blend of one pixel straight into the pixel buffer    |
//+------------------------------------------------------------------+
void CTrendCanvas::BlendPixel(const int x, const int y, const uint argb)
  {
//--- Clip to the canvas and skip transparent paint
   if(x < 0 || y < 0 || x >= m_width || y >= m_height)
      return;
   int sourceAlpha = (int)(argb >> 24);
   if(sourceAlpha <= 0)
      return;
//--- Destination and source channels
   int index = y * m_width + x;
   uint dest = m_pixels[index];
   int destAlpha = (int)(dest >> 24);
//--- Split both colors into channels
   int sourceRed = (int)((argb >> 16) & 0xFF);
   int sourceGreen = (int)((argb >> 8) & 0xFF);
   int sourceBlue = (int)(argb & 0xFF);
   int destRed = (int)((dest >> 16) & 0xFF);
   int destGreen = (int)((dest >> 8) & 0xFF);
   int destBlue = (int)(dest & 0xFF);
//--- Source over compositing in 8 bit fixed point
   int outAlpha = sourceAlpha + destAlpha * (255 - sourceAlpha) / 255;
   if(outAlpha <= 0)
     {
      //--- Both transparent
      m_pixels[index] = 0;
      return;
     }
   int outRed = (sourceRed * sourceAlpha + destRed * destAlpha * (255 - sourceAlpha) / 255) / outAlpha;
   int outGreen = (sourceGreen * sourceAlpha + destGreen * destAlpha * (255 - sourceAlpha) / 255) / outAlpha;
   int outBlue = (sourceBlue * sourceAlpha + destBlue * destAlpha * (255 - sourceAlpha) / 255) / outAlpha;
   m_pixels[index] = ((uint)outAlpha << 24) | ((uint)outRed << 16) | ((uint)outGreen << 8) | (uint)outBlue;
  }
Every soft edge in this indicator comes out of that one routine. Rather than replacing a pixel, we weight the incoming color and the one already there by their alphas, which is what lets the cloud tint a candle instead of hiding it and what gives our stop line smooth edges. The whole calculation stays in eight-bit integers, so a fade across thousands of pixels costs us no floating-point work. "DrawTextClean" solves the same problem for our price labels, rendering each string twice and taking the difference to recover the coverage the terminal never hands us directly. With blending in place, we need to know where on the screen each price belongs.
Mapping Prices to Pixels and Painting a Soft Span
Prices convert to fractional pixel rows, and a horizontal run gets painted with partial coverage at both ends so nothing lands on a hard edge.
//+------------------------------------------------------------------+
//| Exact pixel y of a price, never clamped to the visible range     |
//+------------------------------------------------------------------+
double PriceToY(const double price)
  {
//--- Guard a collapsed range
   double span = g_priceMax - g_priceMin;
   if(span <= 0.0)
      return(0.0);
//--- The true position, bounded only against arithmetic that could overflow later
   double y = (g_priceMax - price) / span * g_chartHeight;
   if(y < -1.0e6)
      return(-1.0e6);
   if(y > 1.0e6)
      return(1.0e6);
   return(y);
  }
//+------------------------------------------------------------------+
//| Paint a horizontal span in one row, soft at both ends            |
//+------------------------------------------------------------------+
void PaintHorizontalSpan(const int y, const double left, const double right, const uint argb)
  {
//--- Nothing to do outside the canvas or with an inverted span
   if(y < 0 || y >= g_chartHeight || right < left)
      return;
   if(right < 0.0 || left > g_chartWidth - 1)
      return;
//--- Whole columns are solid, the two boundary columns take partial coverage
   int firstFull = (int)MathCeil(left);
   int lastFull = (int)MathFloor(right);
//--- Color split once
   int alpha = (int)(argb >> 24);
   uint rgb = argb & 0x00FFFFFF;
   for(int x = MathMax(firstFull, 0); x <= MathMin(lastFull, g_chartWidth - 1); x++)
      g_canvas.BlendPixel(x, y, argb);
//--- Coverage of the column the span starts inside
   double leftCoverage = firstFull - left;
   if(leftCoverage > 0.001)
      g_canvas.BlendPixel(firstFull - 1, y, ((uint)(int)(alpha * leftCoverage) << 24) | rgb);
//--- Coverage of the column it ends inside
   double rightCoverage = right - lastFull;
   if(rightCoverage > 0.001)
      g_canvas.BlendPixel(lastFull + 1, y, ((uint)(int)(alpha * rightCoverage) << 24) | rgb);
  }
Returning a fractional row rather than a rounded one matters more than it looks. A stop that creeps toward price by a fraction of a pixel per bar would step visibly if we rounded here, so we keep the true position and let the drawing routines decide how to spread it. We also refuse to clamp a price to the visible range, because clamping would drag an off-screen stop line onto the top or bottom edge and invent a level that is not there. The span painter carries that precision sideways, filling whole columns solid and giving each boundary column only the share of alpha it actually covers. Those two together give us everything except a sloped line.
Drawing the Anti-Aliased Stop Segments
A sloped line gets stepped along its longer axis, and at each step the exact position is split between the two pixels it straddles.
//+------------------------------------------------------------------+
//| Antialiased one pixel line stepping along its longer axis        |
//+------------------------------------------------------------------+
void DrawLineWu(double x0, double y0, double x1, double y1, const uint argb)
  {
//--- Work in coordinates where the line runs along x, swapping axes for steep lines
   bool steep = MathAbs(y1 - y0) > MathAbs(x1 - x0);
   if(steep)
     {
      //--- Swap x and y on both ends
      double swapStart = x0;
      x0 = y0;
      y0 = swapStart;
      //--- Far end
      double swapEnd = x1;
      x1 = y1;
      y1 = swapEnd;
     }
   if(x0 > x1)
     {
      //--- Always draw left to right along the major axis
      double swapMajor = x0;
      x0 = x1;
      x1 = swapMajor;
      //--- Minor axis follows
      double swapMinor = y0;
      y0 = y1;
      y1 = swapMinor;
     }
//--- Rise per step along the major axis
   double gradient = (x1 - x0) != 0.0 ? (y1 - y0) / (x1 - x0) : 0.0;
//--- Step range clipped to the canvas along the major axis
   int majorLimit = steep ? g_chartHeight : g_chartWidth;
   int stepFrom = MathMax((int)MathCeil(x0), 0);
   int stepTo = MathMin((int)MathFloor(x1), majorLimit - 1);
   int alpha = (int)(argb >> 24);
   uint rgb = argb & 0x00FFFFFF;
   for(int step = stepFrom; step <= stepTo; step++)
     {
      //--- Exact position across the minor axis, split between the two pixels it straddles
      double minor = y0 + gradient * (step - x0);
      int lower = (int)MathFloor(minor);
      double upperShare = minor - lower;
      int alphaLower = (int)(alpha * (1.0 - upperShare));
      int alphaUpper = (int)(alpha * upperShare);
      if(steep)
        {
         //--- Steep: step is the row, minor is the column
         g_canvas.BlendPixel(lower, step, ((uint)alphaLower << 24) | rgb);
         g_canvas.BlendPixel(lower + 1, step, ((uint)alphaUpper << 24) | rgb);
        }
      else
        {
         //--- Shallow: step is the column, minor is the row
         g_canvas.BlendPixel(step, lower, ((uint)alphaLower << 24) | rgb);
         g_canvas.BlendPixel(step, lower + 1, ((uint)alphaUpper << 24) | rgb);
        }
     }
  }
Swapping the axes for a steep line is the trick that keeps this short. By always stepping along whichever axis the line travels furthest, we guarantee one pixel pair per step with no gaps, and the same loop serves a nearly flat stop line and a near-vertical one right after a flip. The two alphas at each step always sum to the full stroke, so the line keeps a constant weight regardless of its angle. Between the stop line and price is the space we fill next.
Painting the Cloud
Each column between the stop line and the smoothed price gets filled with a fade, full strength at the stop and nothing at price.
//+------------------------------------------------------------------+
//| Paint one cloud column, fading from the stop line to price       |
//+------------------------------------------------------------------+
void PaintCloudColumn(const int x, const double arcY, const double priceY, const color sideColor)
  {
//--- Only columns on the canvas
   if(x < 0 || x >= g_chartWidth)
      return;
//--- The fade is measured across the true distance even when the stop line is off screen
   double span = MathAbs(priceY - arcY);
   if(span < 1.0)
      return;
//--- Only the rows that exist are painted, the fade still comes from the true span
   int rowFrom = MathMax(0, (int)MathCeil(MathMin(arcY, priceY)));
   int rowTo = MathMin(g_chartHeight - 1, (int)MathFloor(MathMax(arcY, priceY)));
   uint rgb = ColorToARGB(sideColor, 255) & 0x00FFFFFF;
   for(int y = rowFrom; y <= rowTo; y++)
     {
      //--- Full opacity on the stop line, none at the price
      double fade = 1.0 - MathAbs((double)y - arcY) / span;
      if(fade <= 0.0)
         continue;
      int alpha = (int)MathRound(255.0 * InpCloudOpacity / 100.0 * fade);
      if(alpha <= 0)
         continue;
      g_canvas.BlendPixel(x, y, ((uint)alpha << 24) | rgb);
     }
  }
//+------------------------------------------------------------------+
//| Paint the cloud between the stop line and the smoothed price     |
//+------------------------------------------------------------------+
void DrawCloud()
  {
//--- Skip when hidden
   if(!InpShowCloud)
      return;
//--- Every pair of neighboring visible bars that share a trend
   int firstBar = 0;
   int lastBar = 0;
   VisibleBarRange(firstBar, lastBar);
   for(int bar = MathMax(firstBar, g_firstDrawBar + 1); bar <= lastBar; bar++)
     {
      //--- Both bars must be filled and on the same side, the flip bar is empty and breaks the run
      if(g_smoothedStop[bar] == EMPTY_VALUE || g_smoothedStop[bar - 1] == EMPTY_VALUE)
         continue;
      if(g_priceReference[bar] == EMPTY_VALUE || g_priceReference[bar - 1] == EMPTY_VALUE)
         continue;
      if(g_trendBuffer[bar] != g_trendBuffer[bar - 1])
         continue;
      //--- Interpolate both edges across the bar so the boundary is a curve, not steps
      color sideColor = g_trendBuffer[bar] > 0.0 ? InpBullishColor : InpBearishColor;
      int xFrom = BarToX(bar - 1);
      int xTo = BarToX(bar);
      //--- Both edges at each end of the bar, at their true positions
      double arcFrom = PriceToY(g_smoothedStop[bar - 1]);
      double arcTo = PriceToY(g_smoothedStop[bar]);
      double priceFrom = PriceToY(g_priceReference[bar - 1]);
      double priceTo = PriceToY(g_priceReference[bar]);
      for(int x = xFrom; x < xTo; x++)
        {
         //--- Position across the bar
         double share = (double)(x - xFrom) / MathMax(xTo - xFrom, 1);
         PaintCloudColumn(x, arcFrom + (arcTo - arcFrom) * share, priceFrom + (priceTo - priceFrom) * share, sideColor);
        }
     }
  }
Anchoring the fade at the stop line rather than spreading it evenly is what makes the cloud readable. Opacity is highest where the stop sits and falls to nothing at price, so the eye is pulled to the boundary that actually matters and the candles stay clear. Measuring the fade across the true span even when the stop line is off screen keeps a partly visible cloud correctly shaded instead of washing it out. We also interpolate both edges across every column of a bar rather than drawing one rectangle per bar, which is what turns the boundary into the smooth arc rather than a staircase, and we break the run wherever a flip left an empty slot, so no cloud ever bridges two opposing trends. The line that bounds that cloud goes on next.
Stroking the Stop Line
One anti-aliased segment gets drawn per neighboring pair of bars, repeated across the requested stroke width.
//+------------------------------------------------------------------+
//| Paint the stop line, one antialiased segment per bar pair        |
//+------------------------------------------------------------------+
void DrawStopLine()
  {
//--- Skip when hidden
   if(!InpShowStopLine)
      return;
//--- Every neighboring pair of visible bars that share a trend
   int firstBar = 0;
   int lastBar = 0;
   VisibleBarRange(firstBar, lastBar);
   uint lineArgb = ArgbFromOpacity(InpStopLineColor, 100);
   for(int bar = MathMax(firstBar, g_firstDrawBar + 1); bar <= lastBar; bar++)
     {
      //--- Both bars must be filled and on the same side, the flip bar is empty and breaks the run
      if(g_smoothedStop[bar] == EMPTY_VALUE || g_smoothedStop[bar - 1] == EMPTY_VALUE)
         continue;
      if(g_trendBuffer[bar] != g_trendBuffer[bar - 1])
         continue;
      //--- Segment between the two bar centers
      double xFrom = BarToX(bar - 1);
      double xTo = BarToX(bar);
      double yFrom = PriceToY(g_smoothedStop[bar - 1]);
      double yTo = PriceToY(g_smoothedStop[bar]);
      //--- Skip segments with no part on the canvas
      if(xTo < 0 || xFrom > g_chartWidth)
         continue;
      if(MathMax(yFrom, yTo) < 0 || MathMin(yFrom, yTo) > g_chartHeight)
         continue;
      //--- One antialiased line per pixel of width, offset across the axis the line does not run along
      bool steep = MathAbs(yTo - yFrom) > MathAbs(xTo - xFrom);
      for(int pass = 0; pass < InpStopLineWidth; pass++)
        {
         //--- Alternate the side so the stroke stays centered
         double offset = (pass + 1) / 2 * ((pass % 2) == 0 ? 1.0 : -1.0);
         if(steep)
            DrawLineWu(xFrom + offset, yFrom, xTo + offset, yTo, lineArgb);
         else
            DrawLineWu(xFrom, yFrom + offset, xTo, yTo + offset, lineArgb);
        }
     }
  }
Thickness comes from repeated passes rather than a wider primitive, and the offsets alternate either side of the centre so a three-pixel stroke sits balanced on the true position instead of drifting off it. Which axis takes that offset depends on the slope, since nudging a steep segment vertically would lengthen it rather than widen it. Segments entirely off the canvas are skipped before any pixel work happens, so scrolling far from the current trend costs us nothing. What the flips left behind is drawn beneath all of this.
Drawing the Flip Levels
A level is a horizontal run in its own style, marked at its birth bar and tagged with its price at the live end.
//+------------------------------------------------------------------+
//| Paint a dashed or dotted horizontal line inside the canvas       |
//+------------------------------------------------------------------+
void DrawHorizontalRun(const int x1, const int x2, const double y, const uint argb, const int width, const ENUM_LINE_STYLE style)
  {
//--- Clip the run to the canvas
   int left = MathMax(0, MathMin(x1, x2));
   int right = MathMin(g_chartWidth - 1, MathMax(x1, x2));
   if(left > right)
      return;
//--- Exactly as many rows as the requested width, centered on the level
   int rowFrom = (int)MathRound(y - width / 2.0);
   int rowTo = rowFrom + width - 1;
//--- A solid style is one run per row
   if(style == STYLE_SOLID)
     {
      //--- Straight through
      for(int row = rowFrom; row <= rowTo; row++)
         PaintHorizontalSpan(row, left, right, argb);
      return;
     }
//--- Dots are short, dashes are long
   int on = (style == STYLE_DOT) ? 2 : 7;
   int off = (style == STYLE_DOT) ? 4 : 5;
   for(int x = left; x <= right; x += on + off)
     {
      //--- One dash across every row of the stroke
      for(int row = rowFrom; row <= rowTo; row++)
         PaintHorizontalSpan(row, x, MathMin(x + on - 1, right), argb);
     }
  }
//+------------------------------------------------------------------+
//| Paint the unbroken flip levels with diamonds and price labels    |
//+------------------------------------------------------------------+
void DrawFlipLevels()
  {
//--- Skip when hidden
   if(!InpShowFlipLevels)
      return;
//--- Each level runs from its own bar to the current bar
   int xLive = BarToX(g_ratesTotal - 1);
   for(int i = 0; i < ArraySize(g_flipLevels); i++)
     {
      //--- Color by the side it was born on
      color levelColor = g_flipLevels[i].isBullish ? InpBullishColor : InpBearishColor;
      double y = PriceToY(g_flipLevels[i].price);
      if(!NearCanvas(0, y))
         continue;
      int xStart = BarToX(g_flipLevels[i].bar);
      DrawHorizontalRun(xStart, xLive, y, ArgbFromOpacity(levelColor, InpFlipLevelOpacity), InpFlipLevelWidth, InpFlipLevelStyle);
      //--- Diamond at the birth bar and the price at the right end
      DrawDiamond(xStart, y, 4, ArgbFromOpacity(levelColor, 100));
      if(InpShowFlipLevelPrice)
         DrawPriceLabel(xLive, y, DoubleToString(g_flipLevels[i].price, _Digits), levelColor);
     }
  }
A level starts at the bar that created it rather than running the full width, so we can see at a glance how long it has survived. Color comes from the side it was born on, which means a green line above price is a bullish flip that price has since climbed past, and that reads as a level already tested. The diamond and the arrows are built the same way, stacking rows of the span painter whose half-width changes with distance from the centre, so a symmetric shape falls out of the loop without any polygon work. Below all of this sit the candles themselves.
Shading the Candles and Publishing a Frame
Each bar is copied into the candle plot with a palette index set by its distance from the stop, and the four layers are painted back to front in one pass.
//+------------------------------------------------------------------+
//| Fill the colored candle plot for one bar                         |
//+------------------------------------------------------------------+
void PublishCandle(const int bar, const double &open[], const double &high[], const double &low[], const double &close[],
                   const double stopForShade, const bool bullish)
  {
//--- Without coloring or a stop the plot stays empty and the chart shows its own candle
   if(!InpColorCandles || stopForShade == EMPTY_VALUE)
     {
      //--- Nothing drawn on this bar
      g_candleOpen[bar] = EMPTY_VALUE;
      g_candleHigh[bar] = EMPTY_VALUE;
      g_candleLow[bar] = EMPTY_VALUE;
      g_candleClose[bar] = EMPTY_VALUE;
      g_candleColorIndex[bar] = 0.0;
      return;
     }
//--- Copy the bar into the plot
   g_candleOpen[bar] = open[bar];
   g_candleHigh[bar] = high[bar];
   g_candleLow[bar] = low[bar];
   g_candleClose[bar] = close[bar];
//--- Shade by distance from the stop, brighter further away
   double fastRange = g_fastAtr[MathMin(bar, g_ratesTotal - 2)];
   double share = 0.5;
   if(fastRange != EMPTY_VALUE && fastRange > 0.0)
      share = MathMin(MathAbs(close[bar] - stopForShade) / (fastRange * 3.0), 1.0);
   int shade = (int)MathRound(share * (CANDLE_SHADES - 1));
//--- Bullish shades come first in the palette
   g_candleColorIndex[bar] = (double)((bullish ? 0 : CANDLE_SHADES) + shade);
  }
//+------------------------------------------------------------------+
//| Repaint everything from scratch                                  |
//+------------------------------------------------------------------+
void FullRedraw()
  {
//--- Need a live canvas, a usable viewport, and data
   if(!g_canvasReady || g_chartWidth <= 0 || g_chartHeight <= 0 || g_ratesTotal < 2)
      return;
   if(!EnsureCanvasSize())
      return;
//--- Clear, then paint back to front
   g_canvas.Erase(0);
   DrawCloud();
   DrawFlipLevels();
   DrawFlipMarkers();
//--- The stop line goes on last so nothing paints over it
   DrawStopLine();
//--- Publish
   g_canvas.Update();
  }
Candle colouring runs through the plot rather than the canvas, because the terminal already knows how to draw a candle and we only want to choose its shade. Distance from the stop in fast ATR multiples picks that shade, so a bar riding far above a bullish stop comes out strong and one closing in on it fades, a visual cue that the stop is near. Draw order in the frame is deliberate: the cloud goes down first as background, levels and arrows sit above it, and the stop line goes on last so nothing can paint over the boundary we care most about. The chart is complete, so the last thing to settle is when any of this runs.
Creating the Canvas and Validating the Inputs
The bitmap label is created behind the candles and published transparent, and settings that could not produce a sensible stop are refused before anything starts.
//+------------------------------------------------------------------+
//| Create the single canvas object                                  |
//+------------------------------------------------------------------+
bool CreateCanvas()
  {
//--- Start from the current chart size, one pixel minimum
   int width = MathMax(1, (int)ChartGetInteger(0, CHART_WIDTH_IN_PIXELS, 0));
   int height = MathMax(1, (int)ChartGetInteger(0, CHART_HEIGHT_IN_PIXELS, 0));
//--- Create the bitmap label at the chart origin
   g_canvasName = OBJECT_PREFIX + "Canvas";
   if(!g_canvas.CreateBitmapLabel(0, 0, g_canvasName, 0, 0, width, height, COLOR_FORMAT_ARGB_NORMALIZE))
      return(false);
//--- The cloud belongs under the candles, set once here and never touched again
   ObjectSetInteger(0, g_canvasName, OBJPROP_BACK, true);
//--- Publish transparent so nothing flashes before the first paint
   g_canvas.Erase(0);
   g_canvas.Update();
   g_canvasReady = true;
   return(true);
  }
//+------------------------------------------------------------------+
//| Validate the inputs before the indicator starts                  |
//+------------------------------------------------------------------+
bool ValidateInputs()
  {
//--- Require positive rates and distances
   if(InpAccelerationRate <= 0.0 || InpMaxSpeed < 0.0 || InpStartDistanceAtr <= 0.0 || InpStepSizeAtr <= 0.0 || InpArrowOffsetAtr <= 0.0)
     {
      //--- Report the problem
      Print("Acceleration, distances and step size must be positive, max speed cannot be negative");
      return(false);
     }
//--- Require usable periods with the slow range above the fast one
   if(InpSmoothingBars < 1 || InpFastAtrPeriod < 1 || InpSlowAtrPeriod <= InpFastAtrPeriod)
     {
      //--- Report the problem
      Print("Smoothing at least 1, ATR periods at least 1, and the slow period above the fast one");
      return(false);
     }
//--- Require a sane boost and opacities
   if(InpVwapSpeedBoost < 1.0 || InpVwapBoostRangeAtr <= 0.0 || InpCloudOpacity < 0 || InpCloudOpacity > 100
      || InpFlipLevelOpacity < 0 || InpFlipLevelOpacity > 100)
     {
      //--- Report the problem
      Print("Speed boost at least 1, boost range positive, opacities between 0 and 100");
      return(false);
     }
//--- Require usable counts, widths and history
   if(InpMaxFlipLevels < 1 || InpMaxFlipMarkersKept < 1 || InpFlipLevelWidth < 1 || InpStopLineWidth < 1 || InpMaxHistoryBars < 0 || InpLabelFontSize < 7 || InpArrowSize < 3)
     {
      //--- Report the problem
      Print("Counts and widths at least 1, history not negative, label font at least 7");
      return(false);
     }
//--- Everything is acceptable
   return(true);
  }
One line in the canvas routine decides how the whole thing looks. Pushing the bitmap label behind the chart objects is what puts our cloud underneath the candles rather than over them, and we set it once at creation so no later repaint can disturb the order. Publishing a transparent frame immediately means nothing flashes on screen before the first real paint arrives. In the validation we demand the slow period sit above the fast one, since the two ranges only do different jobs if they are actually different, and every failure names the setting at fault instead of refusing silently. Starting the indicator is next.
Binding the Buffers and Building the Candle Palette
Five buffers carry the colored candle plot and three carry the trend context, and the palette is built by blending each trend color toward the chart background.
//+------------------------------------------------------------------+
//| Custom indicator initialization function                         |
//+------------------------------------------------------------------+
int OnInit()
  {
//--- Stop on invalid inputs
   if(!ValidateInputs())
      return(INIT_PARAMETERS_INCORRECT);
//--- The colored candle plot takes the first five buffers
   SetIndexBuffer(0, g_candleOpen, INDICATOR_DATA);
   SetIndexBuffer(1, g_candleHigh, INDICATOR_DATA);
   SetIndexBuffer(2, g_candleLow, INDICATOR_DATA);
   SetIndexBuffer(3, g_candleClose, INDICATOR_DATA);
   SetIndexBuffer(4, g_candleColorIndex, INDICATOR_COLOR_INDEX);
//--- The trend context follows in data buffers an EA can read
   SetIndexBuffer(5, g_stopBuffer, INDICATOR_DATA);
   SetIndexBuffer(6, g_trendBuffer, INDICATOR_DATA);
   SetIndexBuffer(7, g_flipBuffer, INDICATOR_DATA);
//--- Use forward indexing on every buffer
   ArraySetAsSeries(g_candleOpen, false);
   ArraySetAsSeries(g_candleHigh, false);
   ArraySetAsSeries(g_candleLow, false);
   ArraySetAsSeries(g_candleClose, false);
   ArraySetAsSeries(g_candleColorIndex, false);
//--- Trend context buffers
   ArraySetAsSeries(g_stopBuffer, false);
   ArraySetAsSeries(g_trendBuffer, false);
   ArraySetAsSeries(g_flipBuffer, false);
//--- Plot zero draws the candles, hidden when coloring is switched off
   PlotIndexSetInteger(0, PLOT_DRAW_TYPE, InpColorCandles ? DRAW_COLOR_CANDLES : DRAW_NONE);
   PlotIndexSetInteger(0, PLOT_COLOR_INDEXES, CANDLE_SHADES * 2);
   PlotIndexSetDouble(0, PLOT_EMPTY_VALUE, EMPTY_VALUE);
   PlotIndexSetString(0, PLOT_LABEL, "Open;High;Low;Close");
//--- The palette runs from the faded trend color to the full one, bullish shades first
   g_chartBackgroundColor = (color)ChartGetInteger(0, CHART_COLOR_BACKGROUND);
   for(int shade = 0; shade < CANDLE_SHADES; shade++)
     {
      //--- Blend toward the background for the near shades
      int opacity = 45 + shade * (100 - 45) / (CANDLE_SHADES - 1);
      PlotIndexSetInteger(0, PLOT_LINE_COLOR, shade, BlendTowardBackground(InpBullishColor, opacity));
      PlotIndexSetInteger(0, PLOT_LINE_COLOR, CANDLE_SHADES + shade, BlendTowardBackground(InpBearishColor, opacity));
     }
//--- Plot one carries the stop into the Data Window without drawing
   PlotIndexSetInteger(1, PLOT_DRAW_TYPE, DRAW_NONE);
   PlotIndexSetDouble(1, PLOT_EMPTY_VALUE, EMPTY_VALUE);
   PlotIndexSetString(1, PLOT_LABEL, "Trend Stop");
//--- Give this instance its own object prefix so several copies can share a chart
   g_objectPrefix = "VATS_" + IntegerToString((int)(GetMicrosecondCount() % 1000000)) + "_";
//--- Create the canvas
   if(!CreateCanvas())
     {
      //--- Report the problem
      Print(__FUNCTION__, ": failed to create the canvas");
      return(INIT_FAILED);
     }
//--- Start from a clean state
   ResetIndicatorState();
//--- Name the indicator and match the chart digits
   IndicatorSetString(INDICATOR_SHORTNAME, "VWAP Adaptive Trend Stop");
   IndicatorSetInteger(INDICATOR_DIGITS, _Digits);
//--- Ready
   return(INIT_SUCCEEDED);
  }
Sixteen palette entries are registered up front, eight bullish shades then eight bearish, so a single color index on a bar picks both its direction and its intensity. Each shade is mixed toward the chart background rather than made transparent, since a plot color has no alpha channel, and reading the background at startup is what keeps the faint shades faint on a dark theme instead of turning them muddy. Three buffers sit behind an undrawn plot purely so the stop, the trend, and the flip grade reach the Data Window and any program asking for them. Stamping the object prefix with a slice of the microsecond counter lets two copies of the indicator share a chart without colliding over one bitmap label. All of this waits on the terminal to call it.
Wiring the Pipeline to the Terminal Events
Each calculation updates the ranges and averages, runs the engine over the requested history, recolors the forming candle, and repaints, while a chart change repaints on its own.
//+------------------------------------------------------------------+
//| Custom indicator iteration function                              |
//+------------------------------------------------------------------+
int OnCalculate(const int32_t rates_total,
                const int32_t prev_calculated,
                const datetime &time[],
                const double &open[],
                const double &high[],
                const double &low[],
                const double &close[],
                const long &tick_volume[],
                const long &volume[],
                const int32_t &spread[])
  {
//--- Wait for the slow range plus a closed bar
   int minimumBars = InpSlowAtrPeriod + 2;
   if(rates_total < minimumBars)
      return(0);
//--- Identify the closed and forming bars
   int lastClosedBar = rates_total - 2;
   int formingBar = rates_total - 1;
   g_ratesTotal = rates_total;
//--- Detect a full recalculation
   bool fullRecompute = (prev_calculated == 0);
//--- Ticks that did not close a bar recolor the forming candle and repaint only when the view moved
   if(!fullRecompute && time[lastClosedBar] <= g_lastProcessedBarTime)
     {
      //--- Five buffer writes so the live candle follows the trend like the closed ones
      if(g_engineStarted)
         PublishCandle(formingBar, open, high, low, close, g_stopPrice, g_isBullish);
      //--- The view is read on every call, a moved mapping repaints everything
      if(ReadViewport())
         FullRedraw();
      return(rates_total);
     }
//--- Resolve where processing starts
   int startBar = 0;
   if(fullRecompute)
     {
      //--- Wipe every piece of state and blank the plot buffers
      ResetIndicatorState();
      ArrayInitialize(g_candleOpen, EMPTY_VALUE);
      ArrayInitialize(g_candleHigh, EMPTY_VALUE);
      ArrayInitialize(g_candleLow, EMPTY_VALUE);
      ArrayInitialize(g_candleClose, EMPTY_VALUE);
      ArrayInitialize(g_candleColorIndex, 0.0);
      //--- Trend context buffers
      ArrayInitialize(g_stopBuffer, EMPTY_VALUE);
      ArrayInitialize(g_trendBuffer, 0.0);
      ArrayInitialize(g_flipBuffer, 0.0);
      //--- Replay only the history window the user asked for
      startBar = 1;
      if(InpMaxHistoryBars > 0 && rates_total - InpMaxHistoryBars > startBar)
         startBar = rates_total - InpMaxHistoryBars;
      //--- Never start past the last closed bar
      if(startBar > lastClosedBar)
         startBar = lastClosedBar;
     }
   else
     {
      //--- Continue from the bar that was forming last time
      startBar = MathMax(1, prev_calculated - 1);
     }
//--- Working arrays always cover the chart
   EnsureArrays(rates_total);
//--- Ranges and averages are cheap and recursive, so they always run from the first bar
   int seriesStart = fullRecompute ? 1 : startBar;
   for(int bar = seriesStart; bar <= lastClosedBar; bar++)
     {
      //--- Skip bars already handled
      if(time[bar] <= g_lastProcessedBarTime)
         continue;
      UpdateRanges(bar, high, low, close);
      UpdateVwaps(bar, time, high, low, tick_volume, volume);
     }
//--- The stop engine runs only over the requested history window
   for(int bar = startBar; bar <= lastClosedBar; bar++)
     {
      //--- Skip bars already processed
      if(time[bar] <= g_lastProcessedBarTime)
         continue;
      //--- Allow alerts only for the newest closed bar during live updates
      bool alertable = (!fullRecompute && bar == lastClosedBar);
      //--- Run the pipeline
      ProcessBar(bar, alertable, time, open, high, low, close, tick_volume, volume);
      //--- Remember the bar as handled
      g_lastProcessedBarTime = time[bar];
     }
//--- The forming candle takes the live trend shade, the rest of its context is not final
   if(g_engineStarted)
      PublishCandle(formingBar, open, high, low, close, g_stopPrice, g_isBullish);
   else
      PublishCandle(formingBar, open, high, low, close, EMPTY_VALUE, true);
//--- The trend context of the forming bar is not final either
   g_stopBuffer[formingBar] = EMPTY_VALUE;
   g_trendBuffer[formingBar] = 0.0;
   g_flipBuffer[formingBar] = 0.0;
   g_smoothedStop[formingBar] = EMPTY_VALUE;
   g_priceReference[formingBar] = EMPTY_VALUE;
//--- A new bar shifts the picture, repaint everything
   ReadViewport();
   FullRedraw();
//--- Return value of prev_calculated for next call
   return(rates_total);
  }
//+------------------------------------------------------------------+
//| ChartEvent function                                              |
//+------------------------------------------------------------------+
void OnChartEvent(const int id, const long &lparam, const double &dparam, const string &sparam)
  {
//--- Only chart change events matter here
   if(id != CHARTEVENT_CHART_CHANGE)
      return;
//--- Repaint only when the mapping actually moved
   if(ReadViewport())
      FullRedraw();
  }
Ranges and averages are recursive, so a gap in them corrupts every value that follows, which is why they run from the first bar regardless of how much history we choose to display, while the stop engine only needs to cover the window we intend to draw. Splitting them into two loops is what lets the history setting shorten startup without producing a wrong ATR. A tick inside an unfinished bar takes the cheap path, rewriting only the five candle values so the live bar keeps pace with the trend, and repainting the canvas only if the viewport actually moved.
The forming bar's stop, trend, and flip values are cleared every pass, since none of them is settled until the bar closes, and publishing them would hand a program a figure that changes under it. In the "OnChartEvent" event handler, nothing new happens, only the same viewport test, because scrolling and zooming move the mapping without ever producing a tick. What remains now is testing the indicator on a chart, and we handle that in the next section.
Visualization
We compile the indicator, load it onto a chart, and watch it flip, reseed, and close in as price moves. We ran it on gold (XAUUSDm) from Exness on the one-minute chart over one month of data, in the Strategy Tester on every tick, with the default inputs, which use tick volume. The result is shown in the Graphics Interchange Format (GIF) below.
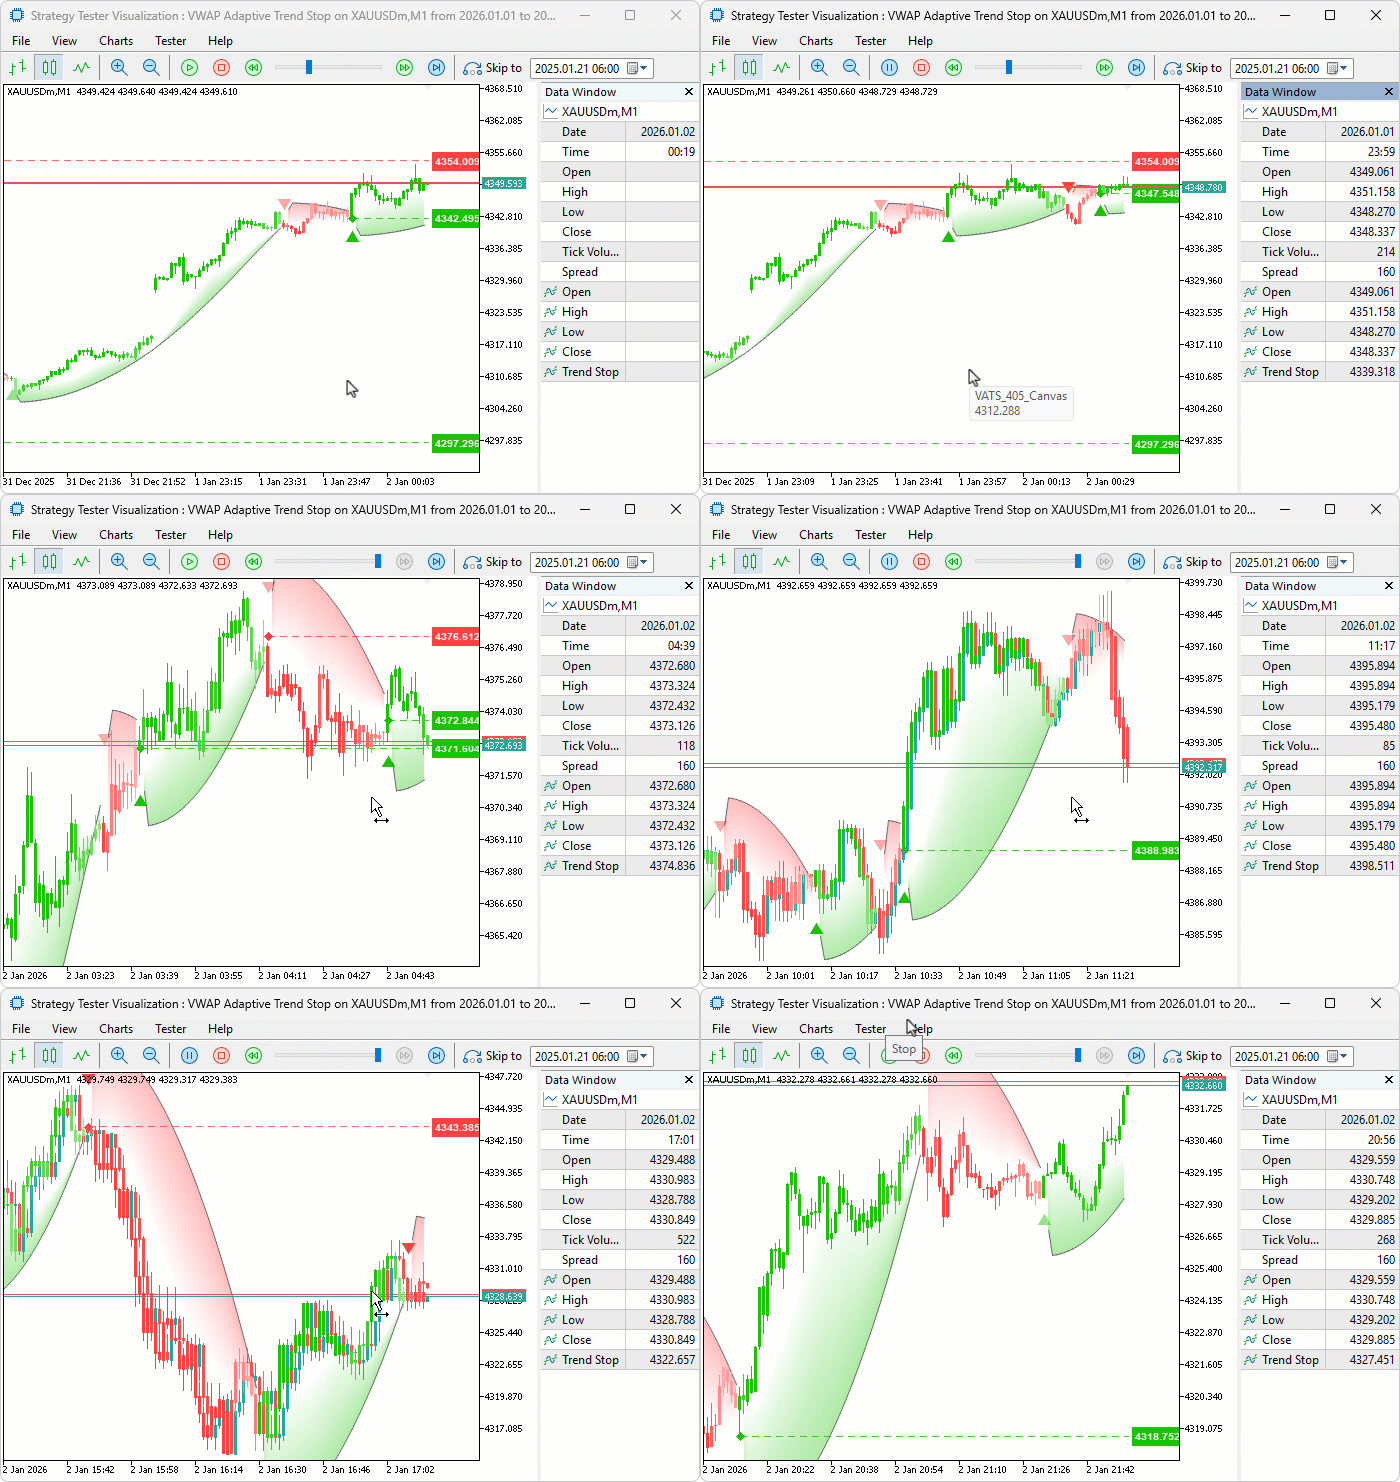
During testing, each flip reseeded the stop well clear of the candle that caused it, and the gap closed slowly at first and then quickly as the trend aged. Confirmed flips stood out against the faded ones, the candles dimmed as price drew near the stop, and the flip levels held until a close broke them and dropped them from the chart.
Conclusion
We have built a trailing stop in MQL5 that sets its own urgency rather than holding a fixed distance. On every flip, it reseeds two slow ATR multiples beyond the candle that turned it and starts over at zero speed. From there it accelerates toward price bar after bar, gaining ground faster the further the market has run from its VWAP, so a young trend gets room while a stalled one meets the stop sooner. The same VWAP grades each turn against the session, weekly, or monthly average, or a combination of them, and the chart keeps a confirmed or filtered arrow and a flip level that stands until a close breaks it.
The result works in two ways. On the chart, the stop line, its fading cloud, the candles shaded by distance from the stop, the flip levels, and the arrows all come off one anti-aliased canvas, with optional alerts on confirmed flips, filtered flips, and broken levels. In code, the stop, the trend, and the signed flip grade go out through three buffers that any program can read, so a strategy can act on the same flips we see. Every engine distance is a volatility multiple, which keeps the settings in the same units on any symbol, but the defaults are starting points, and the acceleration, step size, and boost are the settings to tune for each market and timeframe.
Warning: All rights to these materials are reserved by MetaQuotes Ltd. Copying or reprinting of these materials in whole or in part is prohibited.
This article was written by a user of the site and reflects their personal views. MetaQuotes Ltd is not responsible for the accuracy of the information presented, nor for any consequences resulting from the use of the solutions, strategies or recommendations described.