

Developing Smart Chart Objects in MQL5 (Part 2): Automating Trendline Discovery and Lifecycle Management
 270
270
 2
2

Introduction
You already treat trendlines as “live” objects with states (touch, bounce, break), but adding automatic generation risks fragmenting that architecture: generators begin depending on state, managers on swings, and the chart fills with duplicates and orphaned objects. This part addresses that problem by introducing automatic trendline construction while preserving a single, consistent lifecycle. The Builder (CTrendlineBuilder) turns market structure into candidates; the Manager discovers and registers chart objects; and CManagedTrendline remains the single authority for lifecycle, confirmation, resurrection, expiration, and visual state. Success is measured by observable behavior: auto-generated lines appear, are discovered and registered, and then follow the same state machine, update ordering, and visual rules as manual lines—without generator-specific logic leaking into the lifecycle engine. A trendline can now enter the framework in two ways. It can be drawn manually by the user, or it can be generated automatically from market structure. Although the entry paths are different, both eventually converge into the same management system. This distinction introduces two separate responsibilities. Registration and ownership handle the transition from a chart object to a managed object. Lifecycle management then takes over. It handles proximity, touches, bounces, breaks, resurrection, expiration, and the related state transitions.
The architecture can be viewed through a simple flow.
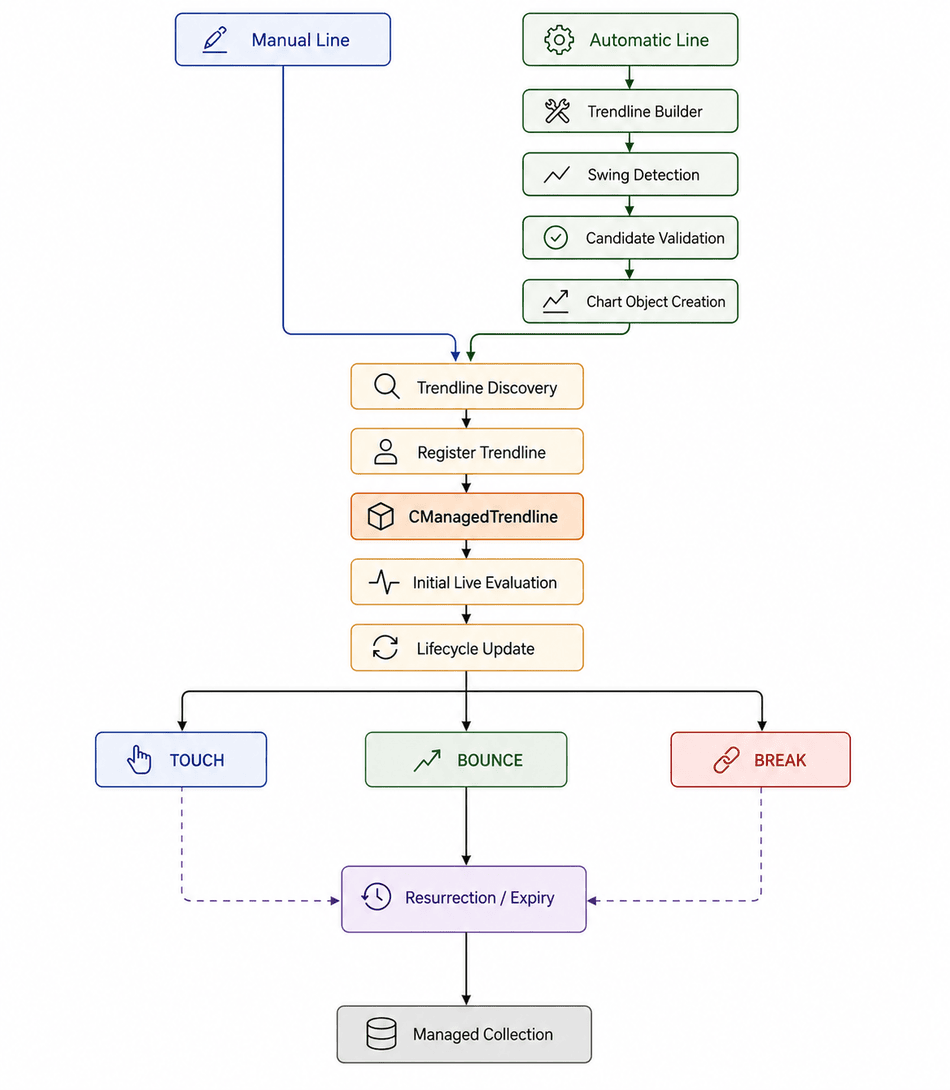
Fig. 1. Architectural flow diagram
The important principle is that creation and management remain separate. The component that creates a trendline should not also become responsible for managing its entire lifecycle. A manually drawn trendline and an automatically generated trendline may therefore follow different paths at the beginning. Once they reach registration, they converge into the same CManagedTrendline lifecycle.
This separation allows the automatic generation system to evolve without turning the lifecycle manager into a collection of generation-specific rules.
Revisiting the Managed Trendline Foundation
Before introducing automatic generation, it is useful to revisit the role of CManagedTrendline. The class remains the lifecycle authority for an individual trendline. Part 2 does not replace the model introduced in Part 1. It gives that model another source of objects.
The distinction is straightforward:
- The builder creates candidates.
- The managed trendline manages those candidates afterward.
The builder identifies and constructs a geometric relationship.
The managed trendline handles everything that happens after the chart object exists. This includes proximity, touches, bounce confirmation, breaks, resurrection, expiration, and visual state.
Keeping these responsibilities separate prevents generation logic from becoming part of the lifecycle engine.
//+------------------------------------------------------------------+
//| Encapsulates a single chart trendline object and its state.      |
//| Inherits from CObject to enable CArrayObj collection management. |
//+------------------------------------------------------------------+
class CManagedTrendline : public CObject
  {
private:
   //--- Object Identity
   string                m_name;                         // Chart object name
   long                  m_chart_id;                     // Target chart ID

   //--- Time & Price Coordinates
   datetime              m_time1;                        // Anchor 1 timestamp
   double                m_price1;                       // Anchor 1 price
   datetime              m_time2;                        // Anchor 2 timestamp
   double                m_price2;                       // Anchor 2 price

   //--- State & Tracking
   ENUM_TRENDLINE_STATE m_state;                         // Current lifecycle state
   int                  m_touch_count;                   // Total touches recorded
   int                  m_bounce_count;                  // Total confirmed bounces recorded
   datetime             m_last_touch_time;               // Timestamp of last touch
   datetime             m_break_time;                    // Timestamp of breakout
   bool                 m_was_recently_moved;            // Flag indicating direct user drag/modification
   bool                 m_needs_initial_proximity_check; // Line just entered management; initial live check pending

   //--- Pending Resolution Tracking
   int                  m_pending_close_count;           // Number of completed candles observed in pending state
   int                  m_break_close_count;             // Accumulated breakout confirmation closes
   int                  m_bounce_close_count;            // Accumulated bounce confirmation closes
   bool                 m_support_context;               // Locked interaction context (true = support, false = resistance)

   //--- Part 2: Post-Break Tracking (Resurrection & Expiration)
   int                  m_bars_since_break;              // Bars elapsed since breakout confirmation
   bool                 m_enable_resurrection;           // Enable reclamation check after break
   int                  m_resurrection_bars;             // Window of bars eligible for resurrection
   int                  m_expiration_bars;               // Window of bars before broken line expires
   int                  m_resurrection_count;            // Total resurrection events recorded

   //--- Settings & Volatility Thresholds
   double               m_proximity_pts;                 // Touch tolerance in points
   double               m_break_atr_mult;                // ATR multiplier for BROKEN confirmation
   int                  m_break_confirm_closes;          // Required closes for breakout confirmation
   double               m_bounce_atr_mult;               // ATR multiplier for BOUNCED confirmation
   int                  m_bounce_confirm_closes;         // Required closes for bounce confirmation
   double               m_touch_atr_mult;                // ATR multiplier for TOUCH_PENDING trigger

   //--- Part 2: Directional Trendline Colors
   color                m_bullish_color;                 // Active color for rising (bullish) trendlines
   color                m_bearish_color;                 // Active color for falling (bearish) trendlines
Expanding the Configuration Surface
Automatic generation and the expanded lifecycle introduce a broader configuration surface to the framework. The new inputs define the thresholds and behavioral limits used throughout the trendline lifecycle. They cover proximity detection, break confirmation, bounce confirmation, resurrection, expiration, and directional visualization.
//--- Directional Trendline Colors (Part 2)
input color InpBullishTrendlineColor = clrLime;           // Bullish trendline color (rising lines)
input color InpBearishTrendlineColor = clrBlue;           // Bearish trendline color (falling lines)

//--- Automatic Trendline Generation (Part 2)
input bool   InpEnableAutoTrendlines  = true;             // Master toggle for automatic trendline generation
input int    InpLookbackCandles       = 100;              // Recent historical bars to scan for swings
input int    InpSwingDepth            = 5;                // Bars on each side required for swing pivot
input int    InpMinTrendlineSwings    = 2;                // Minimum qualifying swings to form trendline
input int    InpMinBarsBetweenSwings  = 5;                // Minimum bars between qualifying swings
input int    InpSwingConfirmationBars = 3;                // Minimum bars elapsed to confirm swing
input bool   InpAutoBullishTrendlines = true;             // Enable automatic bullish trendlines (HL -> HL)
input bool   InpAutoBearishTrendlines = true;             // Enable automatic bearish trendlines (LH -> LH)

//--- Broken Trendline Lifecycle (Part 2)
input bool   InpEnableResurrection    = true;             // Enable resurrection on level reclaim
input int    InpResurrectionBars      = 10;               // Max bars after break eligible for resurrection
input int    InpExpirationBars        = 20;               // Max bars after break before line is purged
With these additions, the manager can now configure the complete set of conditions required to evaluate a trendline from its initial proximity through touch, bounce, break, possible resurrection, and eventual expiration.
The visual configuration also distinguishes bullish and bearish trendlines, allowing their directional character to be reflected directly on the chart.
The Trendline Builder
The first major addition is CTrendlineBuilder. Its role is to turn market structure into concrete trendline candidates. The builder scans the price structure and identifies relevant swing points. It then forms point relationships and validates whether they produce a meaningful directional line.
Once a candidate satisfies the required structural conditions, the builder constructs the corresponding chart trendline and assigns it the properties required for registration.
Its responsibilities can therefore be summarized as:
-
inspect available price structure;
-
identify relevant swing points;
-
establish valid point pairs;
-
validate their directional relationship;
-
construct valid trendline candidates;
-
create the corresponding chart objects.
The implementation is organized around these operations, with the builder retaining the structural information required to scan, validate, and construct candidates consistently.
//+------------------------------------------------------------------+
//| Automatic Trendline Builder Engine                               |
//| Discovers market swings and constructs candidate trendlines.     |
//+------------------------------------------------------------------+
class CTrendlineBuilder
  {
private:
   long              m_chart_id;
   string            m_prefix;

   //--- Structural Detection Parameters
   int               m_lookback_bars;
   int               m_depth;
   int               m_min_swings;
   int               m_min_bars_between;
   int               m_confirmation_bars;
   bool              m_auto_bullish;
   bool              m_auto_bearish;

   //--- Internal Swing Buffer
   BuilderSwingPt    m_swings[];

private:
   bool              IsSwingHigh(const int i, const double &high[], const int total_bars);
   bool              IsSwingLow(const int i, const double &low[], const int total_bars);
   int               ExtractSwings(const datetime &time[], const double &high[], const double &low[], const int total_bars);

   bool              BuildBullishTrendline(const datetime &time[]);
   bool              BuildBearishTrendline(const datetime &time[]);

   string            GenerateObjectName(const string dir, const datetime t1, const datetime t2);
   bool              CreateChartTrendline(const string name, const datetime t1, const double p1, const datetime t2, const double p2);

public:
                     CTrendlineBuilder(const string prefix = DEFAULT_TRENDLINE_PREFIX,
                     int lookback_bars = 100,
                     int depth = 5,
                     int min_swings = 2,
                     int min_bars_between = 5,
                     int confirmation_bars = 3,
                     bool auto_bullish = true,
                     bool auto_bearish = true,
                     long chart_id = 0);
                    ~CTrendlineBuilder();

   //--- Configuration Setter
   void              Configure(int lookback_bars, int depth, int min_swings, int min_bars_between,
                               int confirmation_bars, bool auto_bullish, bool auto_bearish);

   //--- Core Scan & Build Routine (Returns number of created lines)
   int               ScanAndBuild(const datetime &time[], const double &high[], const double &low[], const int rates_total);
  };
From Swing Points to Trendline Candidates
The builder works from swing information derived from the supplied market data, using those structural points as the basis for forming potential trendlines. The candidate-generation process follows a simple progression.
Relevant swing points are first identified within the configured lookback window.
Candidate point pairs are then formed from those swings and evaluated for a valid geometric relationship. The resulting relationship is checked for directional validity, with unsuitable combinations rejected before any chart object is constructed.
Only candidates that satisfy these structural conditions proceed to trendline construction.
//+------------------------------------------------------------------+
//| Bilateral Swing High Detection                                   |
//+------------------------------------------------------------------+
bool CTrendlineBuilder::IsSwingHigh(const int i, const double &high[], const int total_bars)
  {
   if(i - m_depth < 0 || i + m_depth >= total_bars)
      return false;

   for(int k = 1; k <= m_depth; k++)
     {
      if(high[i] <= high[i - k] || high[i] <= high[i + k])
         return false;
     }
   return true;
  }

//+------------------------------------------------------------------+
//| Bilateral Swing Low Detection                                    |
//+------------------------------------------------------------------+
bool CTrendlineBuilder::IsSwingLow(const int i, const double &low[], const int total_bars)
  {
   if(i - m_depth < 0 || i + m_depth >= total_bars)
      return false;

   for(int k = 1; k <= m_depth; k++)
     {
      if(low[i] >= low[i - k] || low[i] >= low[i + k])
         return false;
     }
   return true;
  }

//+------------------------------------------------------------------+
//| Scans lookback range and extracts classified swing structure     |
//+------------------------------------------------------------------+
int CTrendlineBuilder::ExtractSwings(const datetime &time[], const double &high[], const double &low[], const int total_bars)
  {
   ArrayFree(m_swings);
   BuilderSwingPt temp[];
   int scan_limit = MathMin(m_lookback_bars, total_bars - m_depth - 1);
   ArrayResize(temp, scan_limit);
   int count = 0;

   double last_high_price = 0.0;
   double last_low_price  = 0.0;
   bool has_high = false;
   bool has_low  = false;

   int start_bar = scan_limit;
   int end_bar   = MathMax(m_depth, m_confirmation_bars);

   for(int i = start_bar; i >= end_bar; i--)
     {
      if(IsSwingHigh(i, high, total_bars))
        {
         double price = high[i];
         string label = (!has_high || price > last_high_price) ? "HH" : "LH";
         last_high_price = price;
         has_high = true;

         temp[count].t         = time[i];
         temp[count].price     = price;
         temp[count].type      = 1;
         temp[count].label     = label;
         temp[count].bar_index = i;
         count++;
        }

      if(IsSwingLow(i, low, total_bars))
        {
         double price = low[i];
         string label = (!has_low || price > last_low_price) ? "HL" : "LL";
         last_low_price = price;
         has_low = true;

         temp[count].t         = time[i];
         temp[count].price     = price;
         temp[count].type      = -1;
         temp[count].label     = label;
         temp[count].bar_index = i;
         count++;
        }
     }

   if(count == 0)
      return 0;

   ArrayResize(m_swings, count);
   for(int s = 0; s < count; s++)
      m_swings[s] = temp[s];

   return count;
  }
Building Bullish Trendlines
A bullish candidate is built from a valid sequence of rising lows. The builder evaluates the selected swing points against the required structural distance and verifies that the second anchor establishes a higher low than the first. Once the relationship satisfies the bullish geometry, the builder uses the two anchors to construct the trendline and create the corresponding chart object.
//+------------------------------------------------------------------+
//| Identifies qualifying HL sequence and creates Bullish trendline  |
//+------------------------------------------------------------------+
bool CTrendlineBuilder::BuildBullishTrendline(const datetime &time[])
  {
   int total = ArraySize(m_swings);
   if(total < m_min_swings)
      return false;

   int hl_indices[];
   int hl_count = 0;

   for(int i = 0; i < total; i++)
     {
      if(m_swings[i].label == "HL")
        {
         ArrayResize(hl_indices, hl_count + 1);
         hl_indices[hl_count] = i;
         hl_count++;
        }
     }

   if(hl_count < m_min_swings)
      return false;

   int idx_anchor2 = hl_indices[hl_count - 1];
   int idx_anchor1 = hl_indices[hl_count - m_min_swings];

   BuilderSwingPt p1 = m_swings[idx_anchor1];
   BuilderSwingPt p2 = m_swings[idx_anchor2];

   if(MathAbs(p1.bar_index - p2.bar_index) < m_min_bars_between)
      return false;

   if(p2.price <= p1.price)
      return false;

   string line_name = GenerateObjectName("BULL", p1.t, p2.t);
   return CreateChartTrendline(line_name, p1.t, p1.price, p2.t, p2.price);
  }
Building Bearish Trendlines
The bearish path applies the corresponding geometry in the opposite direction. The selected swing points must form a valid sequence of lower highs, satisfy the required structural distance, and place the second anchor below the first. Once the relationship satisfies the bearish geometry, the builder constructs the trendline from those anchors and creates the corresponding chart object.
//+------------------------------------------------------------------+
//| Identifies qualifying LH sequence and creates Bearish trendline  |
//+------------------------------------------------------------------+
bool CTrendlineBuilder::BuildBearishTrendline(const datetime &time[])
  {
   int total = ArraySize(m_swings);
   if(total < m_min_swings)
      return false;

   int lh_indices[];
   int lh_count = 0;

   for(int i = 0; i < total; i++)
     {
      if(m_swings[i].label == "LH")
        {
         ArrayResize(lh_indices, lh_count + 1);
         lh_indices[lh_count] = i;
         lh_count++;
        }
     }

   if(lh_count < m_min_swings)
      return false;

   int idx_anchor2 = lh_indices[lh_count - 1];
   int idx_anchor1 = lh_indices[lh_count - m_min_swings];

   BuilderSwingPt p1 = m_swings[idx_anchor1];
   BuilderSwingPt p2 = m_swings[idx_anchor2];

   if(MathAbs(p1.bar_index - p2.bar_index) < m_min_bars_between)
      return false;

   if(p2.price >= p1.price)
      return false;

   string line_name = GenerateObjectName("BEAR", p1.t, p2.t);
   return CreateChartTrendline(line_name, p1.t, p1.price, p2.t, p2.price);
  }
The two construction paths therefore differ only in the structural relationship they validate: bullish candidates are formed from higher lows, while bearish candidates are formed from lower highs.
Creating the Chart Object
Once a candidate has passed structural validation, the builder converts it into an actual MetaTrader chart object.
The construction stage establishes the properties required by the chart representation:
-
object name;
-
anchor times;
-
anchor prices;
-
ray configuration;
-
initial visual properties;
-
successful object creation.
The builder also checks the existing chart state before creating a new object, preventing the same structural relationship from being recreated during subsequent scans.
At this point, the structural candidate has become a concrete trendline on the chart.
//+------------------------------------------------------------------+
//| Creates OBJ_TREND on chart if duplicate does not exist           |
//+------------------------------------------------------------------+
bool CTrendlineBuilder::CreateChartTrendline(const string name, const datetime t1, const double p1, const datetime t2, const double p2)
  {
   if(ObjectFind(m_chart_id, name) >= 0)
      return false;

   if(!ObjectCreate(m_chart_id, name, OBJ_TREND, 0, t1, p1, t2, p2))
      return false;

   ObjectSetInteger(m_chart_id, name, OBJPROP_RAY_RIGHT, true);
   ObjectSetInteger(m_chart_id, name, OBJPROP_BACK, true);
   ObjectSetInteger(m_chart_id, name, OBJPROP_WIDTH, TrendlineDefaults::DefaultWidth);
   ObjectSetInteger(m_chart_id, name, OBJPROP_COLOR, TrendlineDefaults::ActiveColor);
   ObjectSetInteger(m_chart_id, name, OBJPROP_SELECTABLE, true);

   PrintFormat("//--- [TrendlineBuilder] Created auto trendline: '%s' (P1: %.5f @ %s | P2: %.5f @ %s)",
               name, p1, TimeToString(t1), p2, TimeToString(t2));

   return true;
  }
Scanning and Building
ScanAndBuild() provides the operational entry point for automatic trendline generation. The manager supplies the current market data and structural context, while the builder performs the candidate scan and construction process.
The scan evaluates the available structure, processes qualifying candidates, and attempts to create the corresponding chart objects.
This provides a single entry point through which the automatic-generation process can be invoked.
//+------------------------------------------------------------------+
//| Master Execution Method                                          |
//+------------------------------------------------------------------+
int CTrendlineBuilder::ScanAndBuild(const datetime &time[], const double &high[], const double &low[], const int rates_total)
  {
   if(rates_total < m_lookback_bars || rates_total < (m_depth * 2 + 1))
      return 0;

   int swing_count = ExtractSwings(time, high, low, rates_total);
   if(swing_count < m_min_swings)
      return 0;

   int created = 0;

   if(m_auto_bullish && BuildBullishTrendline(time))
      created++;

   if(m_auto_bearish && BuildBearishTrendline(time))
      created++;

   return created;
  }
Discovering and Registering Trendlines
Creating a chart object does not automatically place it under the manager's control. The manager must first discover relevant trendline objects on the chart and then register those objects in its internal collection.
The transition is therefore:
Chart object → discovery → registration → managed object
DiscoverTrendlines() identifies trendlines that are not yet managed, while RegisterTrendline() establishes their CManagedTrendline representation and adds them to the lifecycle system. Registration also performs the initial evaluation when a trendline first enters the manager, which is critical for auto-generated lines that may be created near the current price.
The initial evaluation uses the existing live evaluation path rather than introducing a separate detection mechanism.
//+------------------------------------------------------------------+
//| Scans chart for objects matching prefix and registers them.      |
//+------------------------------------------------------------------+
int CTrendlineManager::DiscoverTrendlines()
  {
   int registered_count = 0;
   int total_objects = ObjectsTotal(m_chart_id, -1, OBJ_TREND);

   for(int i = total_objects - 1; i >= 0; i--)
     {
      string name = ObjectName(m_chart_id, i, -1, OBJ_TREND);

      //--- Prefix filter match
      if(StringFind(name, m_prefix) == 0)
        {
         if(!IsManaged(name))
           {
            if(RegisterTrendline(name))
               registered_count++;
           }
        }
     }

   if(registered_count > 0)
     {
      PrintFormat("//--- [SmartTrendline] Discovery complete: %d new trendlines registered.", registered_count);
     }

   return registered_count;
  }

//+------------------------------------------------------------------+
//| Registers a new trendline object into the collection.            |
//+------------------------------------------------------------------+
bool CTrendlineManager::RegisterTrendline(const string name)
  {
   if(IsManaged(name))
      return false;

   CManagedTrendline *new_line = new CManagedTrendline(name,
         m_chart_id,
         m_proximity_pts,
         m_break_atr_mult,
         m_break_confirm_closes,
         m_bounce_atr_mult,
         m_bounce_confirm_closes,
         m_enable_resurrection,
         m_resurrection_bars,
         m_expiration_bars,
         m_bullish_color,
         m_bearish_color);
   if(new_line == NULL)
      return false;

   if(m_lines.Add(new_line))
     {
      //--- Overwrite visual properties directly on managed chart object
      ObjectSetInteger(m_chart_id, name, OBJPROP_RAY_RIGHT, true);
      ObjectSetInteger(m_chart_id, name, OBJPROP_BACK, true);
      ObjectSetInteger(m_chart_id, name, OBJPROP_WIDTH, TrendlineDefaults::DefaultWidth);
      //--- Part 2: Directional color is owned by CManagedTrendline::UpdateVisualState() - not overwritten here

      //--- Immediately evaluate initial attachment proximity.
      //--- This is NOT a user drag and must not set m_was_recently_moved.
      new_line.EvaluateLiveDrag(false);

      PrintFormat("//--- [SmartTrendline] Registered trendline: '%s'", name);
      return true;
     }

   delete new_line;
   return false;
  }
Architectural Note: Swing Point Reuse
The current automatic trendline generation process does not permanently mark a swing point as consumed after it participates in a generated trendline. Consequently, the same swing point may participate in subsequent candidate pairs when the builder performs later structure scans, potentially resulting in multiple trendlines originating from the same market structure point.
This behavior is intentional within the current generation model and does not affect the lifecycle management described in this article. Controlling swing-point reuse and reducing redundant trendline candidates represents a separate refinement of the automatic generation layer rather than a responsibility of the trendline lifecycle manager.
One Management Path for Manual and Automatic Trendlines
Manual and automatic trendlines enter the framework through different paths. A manually created trendline is discovered and registered directly, while an automatically generated trendline passes through the builder before its chart object is discovered and registered.
After registration, however, the distinction disappears. Both become CManagedTrendline objects and enter the same lifecycle management path. This convergence keeps the origin of a trendline separate from its subsequent behavior, allowing automatic generation to evolve without fragmenting the management system.
The Central Update Cycle
CTrendlineManager::Update() is the orchestration point for the framework. Each update begins with the manager establishing the conditions required for processing the current market data. Immediate interactions are handled first. The normal lifecycle is processed only on closed bars.
The manager then updates the trendlines already under management before continuing with automatic generation, discovery, and registration of newly created objects. This ordering is important. Existing managed objects complete their current lifecycle processing before new candidates are introduced into the system.
//+------------------------------------------------------------------+
//| Orchestrates lifecycle updates across all managed trendlines.    |
//+------------------------------------------------------------------+
void CTrendlineManager::Update(const double &open[], const double &high[], const double &low[],
                               const double &close[], const datetime &time[], const double atr,
                               const int rates_total)
  {
   if(ArraySize(time) < 3)
      return;

//--- Enforce time-series indexing (Index 0 = current live bar, Index 1 = last closed bar)
   ArraySetAsSeries(open, true);
   ArraySetAsSeries(high, true);
   ArraySetAsSeries(low, true);
   ArraySetAsSeries(close, true);
   ArraySetAsSeries(time, true);

//--- 1. Live Drag Branch: process immediate touch evaluation if user moved lines
   bool has_moved_lines = false;
   int total = m_lines.Total();

   for(int i = 0; i < total; i++)
     {
      CManagedTrendline *line = (CManagedTrendline*)m_lines.At(i);

      if(line != NULL && line.WasRecentlyMoved())
        {
         has_moved_lines = true;
         line.EvaluateLiveDrag();
        }
     }

//--- 2. Closed-Bar Gate: skip unless a new bar completed
   bool is_new_bar = (time[1] != m_last_processed_bar);

   if(!is_new_bar && !has_moved_lines)
      return;

   if(is_new_bar)
     {
      m_last_processed_bar = time[1];

      //--- Standard closed-bar state machine processing
      for(int i = m_lines.Total() - 1; i >= 0; i--)
        {
         CManagedTrendline *line = (CManagedTrendline*)m_lines.At(i);

         if(line == NULL)
           {
            m_lines.Delete(i);
            continue;
           }

         line.Update(open, high, low, close, time, atr);

         //--- Expired lines removed their chart object internally; drop from collection
         if(line.IsExpired())
           {
            string name = line.GetName();
            m_lines.Delete(i);

            PrintFormat("[SmartTrendline] Expired line dropped from manager: '%s'.",
                        name);
           }
        }

      //--- 3. Automatic trendline generation on fresh bars
      if(m_builder_ready && m_builder != NULL)
        {
         int created = m_builder.ScanAndBuild(time, high, low, rates_total);

         //--- Immediately discover and register newly created automatic lines
         if(created > 0)
           {
            DiscoverTrendlines();
           }
        }
     }
  }
Immediate Interaction and Closed-Bar Processing
The update cycle operates across two timing contexts. Some interactions require an immediate response. A user moving a trendline should not have to wait for another completed candle before the line is evaluated. The same applies when a newly registered automatic trendline is first introduced into the manager and requires its initial proximity evaluation.
The normal lifecycle follows a different boundary. Touch confirmation, bounce confirmation, break confirmation, and the resulting state transitions depend on completed market data. The manager therefore uses the last processed closed bar to ensure that each completed candle enters the lifecycle evaluation once. The two paths work together without duplicating the evaluation logic:
Live interaction is immediate. Lifecycle progression is bar aware.
The live path continues to use the existing EvaluateLiveDrag() mechanism, while the closed-bar path proceeds through the managed trendline's normal update cycle.
//+------------------------------------------------------------------+
//| Immediate On-Tick Proximity Evaluation Routine.                  |
//| Handles both user-drag and initial attachment evaluation.        |
//+------------------------------------------------------------------+
void CManagedTrendline::EvaluateLiveDrag(const bool force_evaluation)
  {
   if(!force_evaluation && !m_was_recently_moved && !m_needs_initial_proximity_check)
      return;

//--- One-shot flag consumption: capture initial-check reason before clearing
   bool was_initial_check = m_needs_initial_proximity_check;

   m_was_recently_moved            = false;
   m_needs_initial_proximity_check = false;

//--- Only evaluate active lines
   if(m_state != TRENDLINE_STATE_ACTIVE)
      return;

   double live_bid = SymbolInfoDouble(_Symbol, SYMBOL_BID);

   Point2D p1, p2;
   p1.x = (double)m_time1;
   p1.y = m_price1;
   p2.x = (double)m_time2;
   p2.y = m_price2;

   double line_price = CGeometry::GetYAtX(p1, p2, (double)TimeCurrent());

   if(line_price == 0.0)
      return;

   double proximity_margin = m_proximity_pts * _Point;

//--- Check if live bid is within proximity threshold
   if(MathAbs(live_bid - line_price) <= proximity_margin)
     {
      ENUM_TRENDLINE_STATE previous_state = m_state;

      m_touch_count++;
      m_last_touch_time = TimeCurrent();
      m_pending_close_count = 0;
      m_break_close_count = 0;
      m_bounce_close_count = 0;
      m_support_context = (live_bid >= line_price);
      m_state            = TRENDLINE_STATE_TOUCH_PENDING;

      //--- Distinguish initial attachment evaluation from genuine user drag
      if(force_evaluation || was_initial_check)
        {
         PrintFormat("//--- [SmartTrendline] Object '%s' Initial Proximity Touch: %s -> %s | Total Touches: %d",
                     m_name, EnumToString(previous_state), EnumToString(m_state), m_touch_count);
        }
      else
        {
         PrintFormat("//--- [SmartTrendline] Object '%s' Live Drag Touch Intercept: %s -> %s | Total Touches: %d",
                     m_name, EnumToString(previous_state), EnumToString(m_state), m_touch_count);
        }

      UpdateVisualState();
     }
  }
Updating the Managed Trendline
Once the manager reaches the normal lifecycle stage, responsibility moves to the individual CManagedTrendline.
CManagedTrendline::Update() implements the object-level lifecycle evaluation. It refreshes the trendline properties, evaluates the current relationship between price and the line, processes the conditions associated with its current state, updates confirmation information, performs state transitions, and reconciles the visual representation.
This is where the lifecycle becomes concrete. A proximity event can begin a touch interaction. Continued evidence can confirm a bounce, while sufficient penetration and confirmation can establish a break. A broken relationship can subsequently be reconsidered during its configured reclaim window, while expiration provides the final lifetime boundary.
The manager therefore remains the coordinator of the update cycle, while the managed trendline carries the state-dependent evaluation.
//+------------------------------------------------------------------+
//| Core State Machine & Pending Resolution Engine Routine.          |
//+------------------------------------------------------------------+
bool CManagedTrendline::Update(const double &open[], const double &high[], const double &low[], const double &close[], const datetime &time[], const double atr)
  {
   if(ArraySize(close) < 3)
      return false;

//--- Evaluate latest closed bar (Bar 1)
   int bar_idx = 1;
   double expected_price = GetPriceAtBarIndex(bar_idx, time);
   if(expected_price == 0.0)
      return false;

   double current_close = close[bar_idx];

//--- Signed Difference: Positive = Above line (Support context), Negative = Below line (Resistance context)
   double signed_diff  = current_close - expected_price;
   double dist_to_line = MathAbs(signed_diff);

   ENUM_TRENDLINE_STATE previous_state = m_state;

//--- Convert point tolerance input to price units
   double proximity_price = m_proximity_pts * _Point;

//--- STATE 1: ACTIVE -> Shift to TOUCH_PENDING on Volatility/Proximity
   if(m_state == TRENDLINE_STATE_ACTIVE)
     {
      //--- Calculate dynamic touch threshold (ATR multiplier + static point proximity)
      double touch_threshold = (atr * m_touch_atr_mult) + proximity_price;

      if(dist_to_line <= touch_threshold ||
         MathAbs(high[bar_idx] - expected_price) <= touch_threshold ||
         MathAbs(low[bar_idx] - expected_price) <= touch_threshold)
        {
         if(m_last_touch_time != time[bar_idx])
           {
            m_touch_count++;
            m_last_touch_time = time[bar_idx];
            m_pending_close_count = 0;
            m_break_close_count = 0;
            m_bounce_close_count = 0;
            m_support_context = (current_close >= expected_price);
            m_state            = TRENDLINE_STATE_TOUCH_PENDING;
           }
        }
     }
//--- STATE 2: TOUCH_PENDING -> Deterministic Completed-Candle Resolution
   else
      if(m_state == TRENDLINE_STATE_TOUCH_PENDING)
        {
         m_pending_close_count++;

         double break_threshold  = (atr * m_break_atr_mult) + proximity_price;
         double bounce_threshold = (atr * m_bounce_atr_mult) + proximity_price;
         // --- SUPPORT INTERACTION CONTEXT ---
         if(m_support_context)
           {
            if(signed_diff <= -break_threshold)
              {
               m_break_close_count++;
               m_bounce_close_count = 0;
              }
            else
               if(signed_diff >= bounce_threshold)
                 {
                  m_bounce_close_count++;
                  m_break_close_count = 0;
                 }
               else
                 {
                  m_break_close_count = 0;
                  m_bounce_close_count = 0;
                 }
           }
         // --- RESISTANCE INTERACTION CONTEXT ---
         else
           {
            if(signed_diff >= break_threshold)
              {
               m_break_close_count++;
               m_bounce_close_count = 0;
              }
            else
               if(signed_diff <= -bounce_threshold)
                 {
                  m_bounce_close_count++;
                  m_break_close_count = 0;
                 }
               else
                 {
                  m_break_close_count = 0;
                  m_bounce_close_count = 0;
                 }
           }

         PrintFormat("//--- [SmartTrendline] '%s' Pending | Candles=%d | Break=%d | Bounce=%d",
                     m_name, m_pending_close_count, m_break_close_count, m_bounce_close_count);

         if(m_break_close_count >= m_break_confirm_closes)
           {
            m_state = TRENDLINE_STATE_BROKEN;
            m_break_time = time[bar_idx];
            m_bars_since_break = 0; // Reset post-break elapsed bar counter (Part 2)
           }
         else
            if(m_bounce_close_count >= m_bounce_confirm_closes)
              {
               m_state = TRENDLINE_STATE_BOUNCED;
              }
        }
      //--- STATE 3: BOUNCED -> Record bounce count telemetry and reset to ACTIVE for subsequent retests
      else
         if(m_state == TRENDLINE_STATE_BOUNCED)
           {
            m_bounce_count++;
            PrintFormat("//--- [SmartTrendline] Object '%s' Bounce Confirmed! Total Bounces: %d", m_name, m_bounce_count);
            m_state = TRENDLINE_STATE_ACTIVE;
           }
         //--- STATE 4: BROKEN -> Evaluate post-break resurrection or timeout expiration (Part 2)
         else
            if(m_state == TRENDLINE_STATE_BROKEN)
              {
               m_bars_since_break++;

               //--- 4A: Check Resurrection / Reclamation condition
               if(m_enable_resurrection && m_bars_since_break <= m_resurrection_bars)
                 {
                  bool reclaimed = false;

                  //--- If broken as support, price reclaiming above line indicates resurrection
                  if(m_support_context && signed_diff > 0.0)
                     reclaimed = true;
                  //--- If broken as resistance, price reclaiming below line indicates resurrection
                  else
                     if(!m_support_context && signed_diff < 0.0)
                        reclaimed = true;

                  if(reclaimed)
                    {
                     m_state = TRENDLINE_STATE_ACTIVE;
                     m_bars_since_break = 0;
                     m_resurrection_count++;
                     PrintFormat("[SmartTrendline] Line '%s' RESURRECTED after %d bars | Total Resurrections: %d",
                                 m_name, m_bars_since_break, m_resurrection_count);
                    }
                 }

               //--- 4B: Check Expiration condition if not resurrected -> purge chart object
               if(m_state == TRENDLINE_STATE_BROKEN && m_bars_since_break >= m_expiration_bars)
                 {
                  m_state = TRENDLINE_STATE_EXPIRED;
                  if(ObjectDelete(m_chart_id, m_name))
                    {
                     PrintFormat("[SmartTrendline] Line '%s' EXPIRED after %d bars post-break - chart object purged.",
                                 m_name, m_bars_since_break);
                    }
                  else
                    {
                     PrintFormat("[SmartTrendline] Line '%s' EXPIRED after %d bars - object delete failed (err=%d).",
                                 m_name, m_bars_since_break, GetLastError());
                    }
                 }
              }

//--- Handle state transition log & visual update
   if(m_state != previous_state)
     {
      PrintFormat("//--- [SmartTrendline] Object '%s' State Changed: %s -> %s | Total Touches: %d | Total Bounces: %d",
                  m_name, EnumToString(previous_state), EnumToString(m_state), m_touch_count, m_bounce_count);

      UpdateVisualState();
     }

   return true;
  }
The Lifecycle Progression
With the managed update cycle in place, automatically generated trendlines follow the same states already established for manually created trendlines. A newly registered trendline begins in the active state. Interaction with price can move it into touch-pending, where subsequent market evidence determines whether the interaction becomes a bounce or develops into a break.
A broken trendline may remain eligible for reclamation during the configured resurrection window. If the required reclaim conditions are met, it can return to the active lifecycle. If not, the trendline eventually reaches its configured expiration boundary.
The important distinction is between the market relationship and the lifetime of the object.
A break describes what price has done relative to the trendline. Resurrection determines whether that broken relationship can be recovered. Expiration determines whether the managed object has remained relevant for too long.
This gives the lifecycle a complete progression from active interaction through confirmation, failure, possible recovery, and eventual retirement.
Cleaning Up Orphaned Trendline Objects
Automatic generation introduces another ownership concern. The manager maintains its own collection of managed trendlines, while MetaTrader 5 maintains the corresponding chart objects separately. These two representations must therefore remain synchronized.
A managed trendline can leave the lifecycle while its chart object remains on the chart. Likewise, a chart object can remain without a corresponding managed representation.
The result is an orphaned chart object.
To curb this, we introduce explicit cleanup and reconciliation to remove chart objects that no longer have a legitimate relationship with the manager.
The distinction keeps lifecycle retirement and chart-object ownership as separate concerns.
//+------------------------------------------------------------------+
//| Full teardown used by the destructor / deinit. Auto lines are    |
//| always deleted from the chart. Manual lines are deleted only if  |
//| wipe_manual is true AND they match the scoped prefix (InpPrefix).|
//+------------------------------------------------------------------+
void CTrendlineManager::ReleaseAllManaged(const bool wipe_manual)
  {
//--- First release/delete every object currently tracked by manager
   for(int i = m_lines.Total() - 1; i >= 0; i--)
     {
      CManagedTrendline *line = (CManagedTrendline*)m_lines.At(i);

      if(line == NULL)
        {
         m_lines.Delete(i);
         continue;
        }

      string name = line.GetName();

      //--- During full teardown, delete every tracked line.
      //--- During partial cleanup, only auto-generated lines are deleted.
      bool is_auto = line.IsAutoGenerated();

      if(wipe_manual || is_auto)
        {
         if(ObjectFind(m_chart_id, name) >= 0)
           {
            if(ObjectDelete(m_chart_id, name))
              {
               PrintFormat("[SmartTrendline] Cleanup removed managed object: '%s'.",
                           name);
              }
            else
              {
               PrintFormat("[SmartTrendline] Cleanup FAILED to remove managed object: '%s' | Error=%d",
                           name,
                           GetLastError());
              }
           }
        }
      else
        {
         PrintFormat("[SmartTrendline] Cleanup released tracking only: '%s'.",
                     name);
        }

      //--- Free CManagedTrendline object
      //--- m_lines uses FreeMode(true)
      m_lines.Delete(i);
     }

//--- Sweep the actual chart as the final authority.
   if(wipe_manual)
     {
      int total_objects = ObjectsTotal(m_chart_id, -1, OBJ_TREND);

      for(int i = total_objects - 1; i >= 0; i--)
        {
         string name = ObjectName(m_chart_id, i, -1, OBJ_TREND);

         //--- Only remove objects belonging to this manager's scope.
         if(StringFind(name, m_prefix) != 0)
            continue;

         if(ObjectDelete(m_chart_id, name))
           {
            PrintFormat("[SmartTrendline] Cleanup sweep removed chart object: '%s'.",
                        name);
           }
         else
           {
            PrintFormat("[SmartTrendline] Cleanup sweep FAILED: '%s' | Error=%d",
                        name,
                        GetLastError());
           }
        }
     }

   ChartRedraw(m_chart_id);
  }
Direction-Aware Visualization
Automatic generation also extends the managed visual representation with directional awareness. The direction of a trendline is derived directly from its geometry. A rising relationship is treated as bullish, while a falling relationship is treated as bearish. This determination is independent of how the trendline entered the framework.
UpdateVisualState() remains the rendering authority for the managed trendline. It combines the trendline's geometric direction with its current lifecycle state to determine the appropriate color, style, and width.
This keeps rendering centralized and ensures that directional appearance and lifecycle appearance are reconciled through the same visual update path.
//+------------------------------------------------------------------+
//| Updates line visual appearance based on internal state.          |
//+------------------------------------------------------------------+
void CManagedTrendline::UpdateVisualState()
  {
//--- Part 2: Determine active trendline color from geometric direction
   Point2D p1, p2;
   p1.x = (double)m_time1;
   p1.y = m_price1;
   p2.x = (double)m_time2;
   p2.y = m_price2;

   double slope = CGeometry::CalculateSlope(p1, p2);

//--- Rising = bullish, falling = bearish, flat = neutral default color
   color active_color = TrendlineDefaults::ActiveColor;
   if(slope > 0.0)
      active_color = m_bullish_color;
   else
      if(slope < 0.0)
         active_color = m_bearish_color;

   color target_color = active_color;
   ENUM_LINE_STYLE target_style = TrendlineDefaults::ActiveStyle;
   int target_width = TrendlineDefaults::DefaultWidth;

   switch(m_state)
     {
      case TRENDLINE_STATE_ACTIVE:
      case TRENDLINE_STATE_BOUNCED:
         target_color = active_color;
         target_style = TrendlineDefaults::ActiveStyle;
         break;

      case TRENDLINE_STATE_TOUCH_PENDING:
         target_color = TrendlineDefaults::TouchedColor;
         target_style = TrendlineDefaults::ActiveStyle;
         target_width = TrendlineDefaults::DefaultWidth + 1;
         break;

      case TRENDLINE_STATE_BROKEN:
         target_color = TrendlineDefaults::BrokenColor;
         target_style = TrendlineDefaults::BrokenStyle;
         break;

      case TRENDLINE_STATE_RETESTED:
         target_color = TrendlineDefaults::RetestedColor;
         target_style = TrendlineDefaults::ActiveStyle;
         break;

      default:
         break;
     }

//--- Apply visual modifications to chart object
   ObjectSetInteger(m_chart_id, m_name, OBJPROP_COLOR, target_color);
   ObjectSetInteger(m_chart_id, m_name, OBJPROP_STYLE, target_style);
   ObjectSetInteger(m_chart_id, m_name, OBJPROP_WIDTH, target_width);
   ChartRedraw(m_chart_id);
  }
Operational Walkthrough
After attaching the trendline management system, these were the resulting behaviors for both automatically detected and manually drawn trendlines.
Automatic Trendline
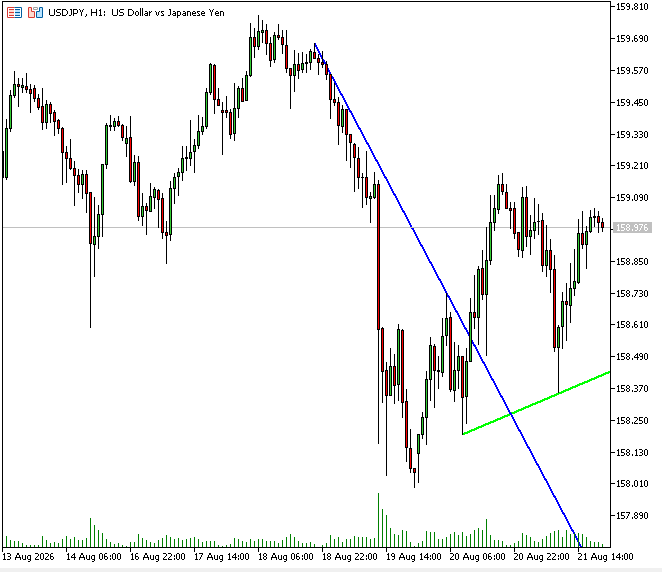
Fig. 2. Automatically Generated Trendlines
The builder identifies the qualifying market structure and creates the trendline automatically. The resulting object is then discovered and registered by the manager, allowing it to enter the same managed lifecycle as any other trendline.
Manual Trendline
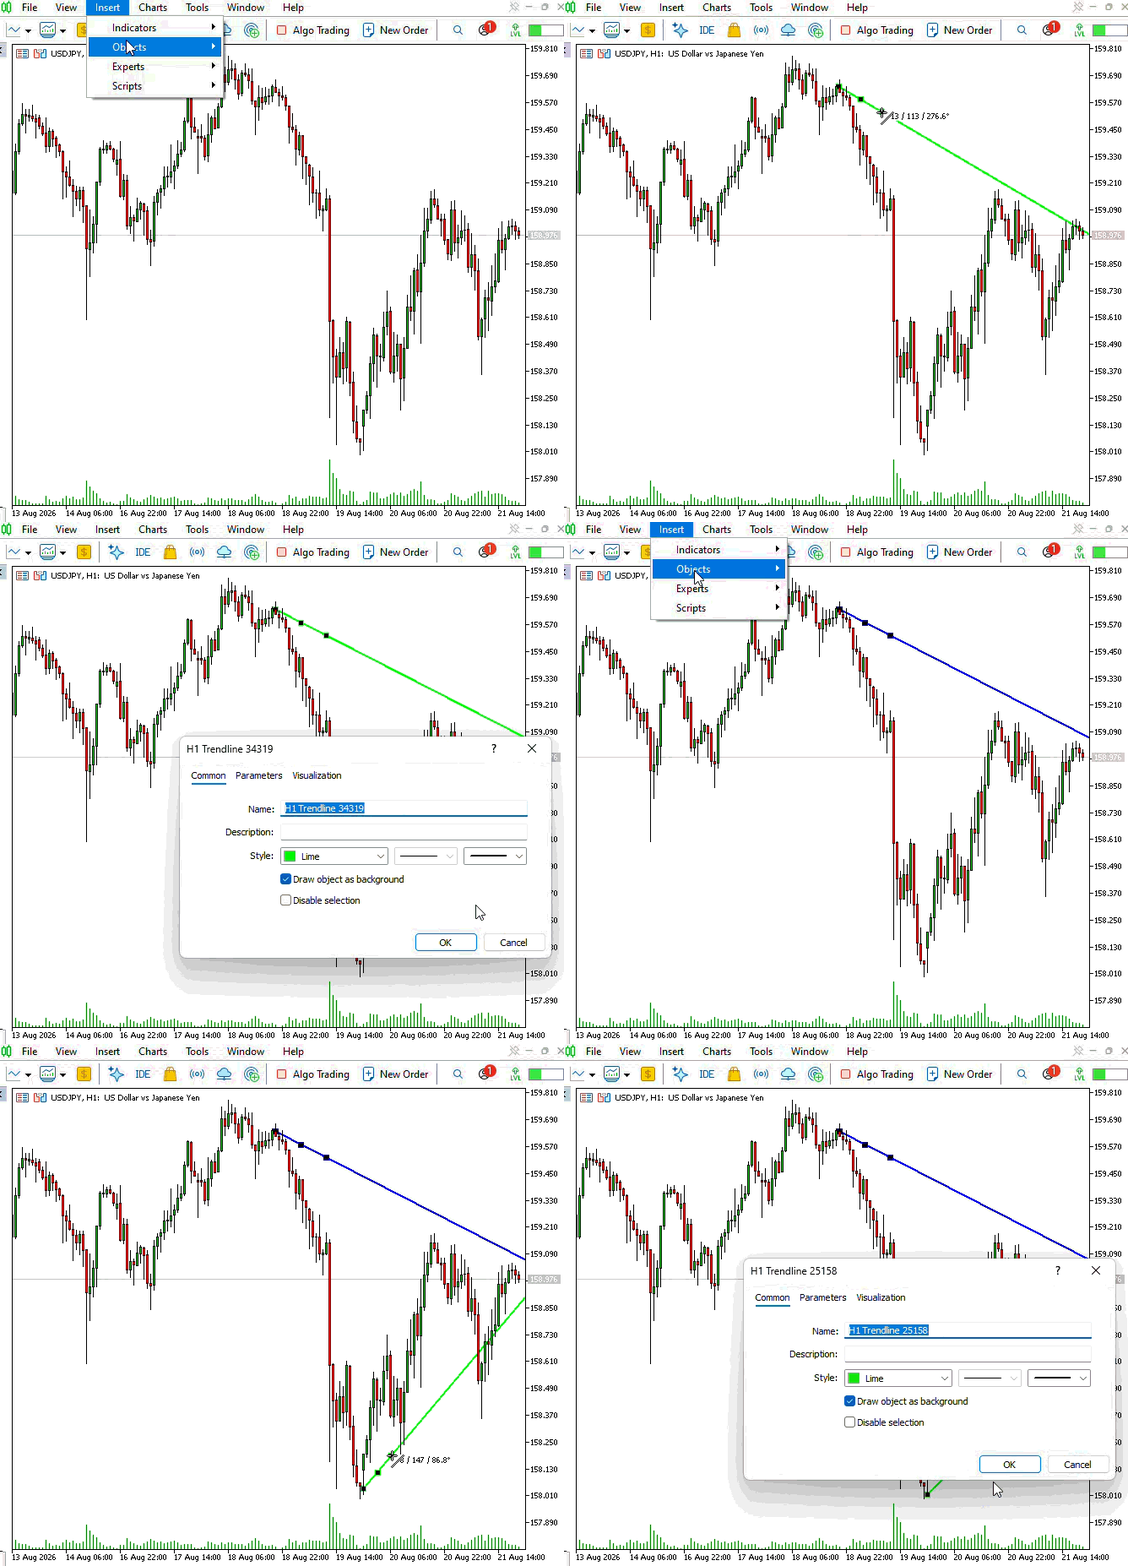 .
.
Fig. 3. Manual Trendline Registration and Framework Interpretation
The manually drawn trendline is detected and registered by the framework immediately. Its original chart appearance is then replaced by the managed visual state, with the line interpreted from its geometry and rendered according to its bullish or bearish direction.
Lifecycle Output
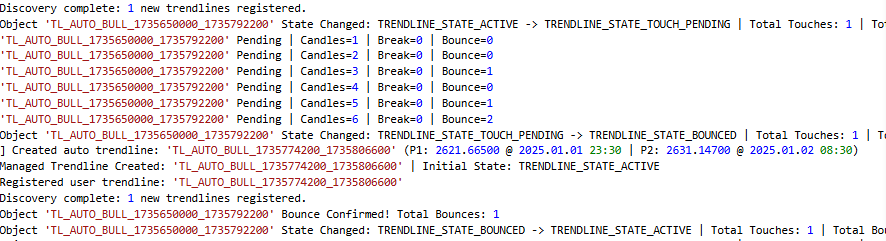
Fig. 4. Minimal Runtime Telemetry of the Trendline Lifecycle
The runtime printouts trace the lifecycle: object registration and state transitions during execution.
Conclusion
With the trendline lifecycle now fully managed, both automatically generated and manually drawn trendlines can be discovered, registered, interpreted, and tracked through a consistent state-driven framework. The result is a reusable management layer that separates trendline lifecycle handling from the logic responsible for creating or drawing the objects themselves.
This establishes the foundation for the next stage of the framework. In the following phase, the managed trendline states will become actionable through alert integration, allowing significant lifecycle events such as touches, bounces, and breaks to be communicated as they occur.
The framework can therefore move beyond simply managing what happens to a trendline and begin communicating when something important happens to it.
| File Name | Description |
|---|---|
| SmartTrendlineManager2.mq5 | The main indicator entry point. It connects MetaTrader 5 events and market data with the internal framework by creating the trendline manager, forwarding chart interactions, and passing market updates for lifecycle evaluation. |
| TrendlineManager.mqh | Implements the orchestration layer of the framework. It discovers existing trendlines, registers managed entities, handles chart events, maintains the collection of active trendlines, and coordinates lifecycle updates across multiple objects. |
| ManagedTrendline.mqh | Implements the behavior of an individual managed trendline. It encapsulates trendline geometry, lifecycle states, interaction tracking, confirmation logic, and visual state updates while remaining independent from the manager. |
| Common.mqh | Contains shared definitions used throughout the framework, including common constants, enumerations, default configuration values, and supporting declarations required by multiple components. |
| Geometry.mqh | Provides the geometric calculations required by the framework, including trendline projection and price evaluation at specific chart positions. This module remains independent from lifecycle logic to keep calculations reusable and isolated. |
| TrendlineBuilder.mqh | Implements the automatic trendline generation layer. It analyzes market structure to identify qualifying trendline candidates, constructs the corresponding chart objects, and supplies them to the management layer for discovery and lifecycle tracking. |
| MQL5.zip | An archive containing the complete MQL5 folder structure. Extract it into the MetaTrader 5 terminal directory so that SmartTrendlineManager2.mq5 is placed under MQL5\Indicators\SmartTrendlineManager2\ and all supporting .mqh files are placed under MQL5\Include\SmartTrendline2\. |
Warning: All rights to these materials are reserved by MetaQuotes Ltd. Copying or reprinting of these materials in whole or in part is prohibited.
This article was written by a user of the site and reflects their personal views. MetaQuotes Ltd is not responsible for the accuracy of the information presented, nor for any consequences resulting from the use of the solutions, strategies or recommendations described.

 Swarm Optimizer with Hierarchical Sub-Flocks — Flock by Leader
 Meta-Labeling the Classics (Part 4): Filtering and Sizing MACD Trades
 Monthly Profit and Loss Calendar Heatmap Renderer in MQL5
 Consecutive Loss Streak Analyzer and Risk-of-Ruin Calculator in MQL5

- Free trading apps
- Over 8,000 signals for copying
- Economic news for exploring financial markets
You agree to website policy and terms of use
Check out the new article: Developing Smart Chart Objects in MQL5 (Part 2): Automating Trendline Discovery and Lifecycle Management.
Author: Francis Nyoike Thumbi
How do YOU define touch, bounce and break? Thank you.