

Building a Market Behavior Analyzer in MQL5
 263
263
 0
0

Introduction
Price charts are inherently human-friendly. A trader can glance at a chart for a few seconds and quickly recognize the prevailing trend, shifts in momentum, and changes in market structure. To an Expert Advisor, however, that same chart is nothing more than a sequence of open, high, low, and close prices. Market context is not something an algorithm naturally understands—it must be derived from the available price data.
A single swing high or swing low has little meaning on its own. Its significance comes from its relationship with previous swings and the sequence they form over time. It is this evolving structure that allows traders to distinguish between bullish and bearish conditions, identify impulses and pullbacks, and understand how the market is developing.
So how can we teach an algorithm to interpret price action in the same structured way?
The Market Behavior Analyzer solves this by converting raw swing points into a structured model of market behavior. The framework does not treat pivots as isolated events. It enriches each detected swing with structural metadata, so the indicator can interpret the context of each turn, not only its location.Throughout this article, we will build the analyzer in several logical stages:
- Detect significant swing highs and swing lows.
- Enrich each swing with structural information.
- Evaluate the latest confirmed market structure.
- Classify price movement into impulses and pullbacks.
- Generate a concise description of the latest confirmed market state.
- Present the analysis through interactive chart visualizations.
The objective is not to predict future price movement. Instead, the framework provides a systematic way of interpreting the most recently confirmed market behavior, creating a reusable foundation that can later support decision-making, trade management, or automated trading systems.
Designing the Analyzer Architecture
Before implementing the analyzer, it is useful to define the overall processing flow. The indicator separates market detection, interpretation, and presentation into independent stages, allowing each component to focus on a specific responsibility.
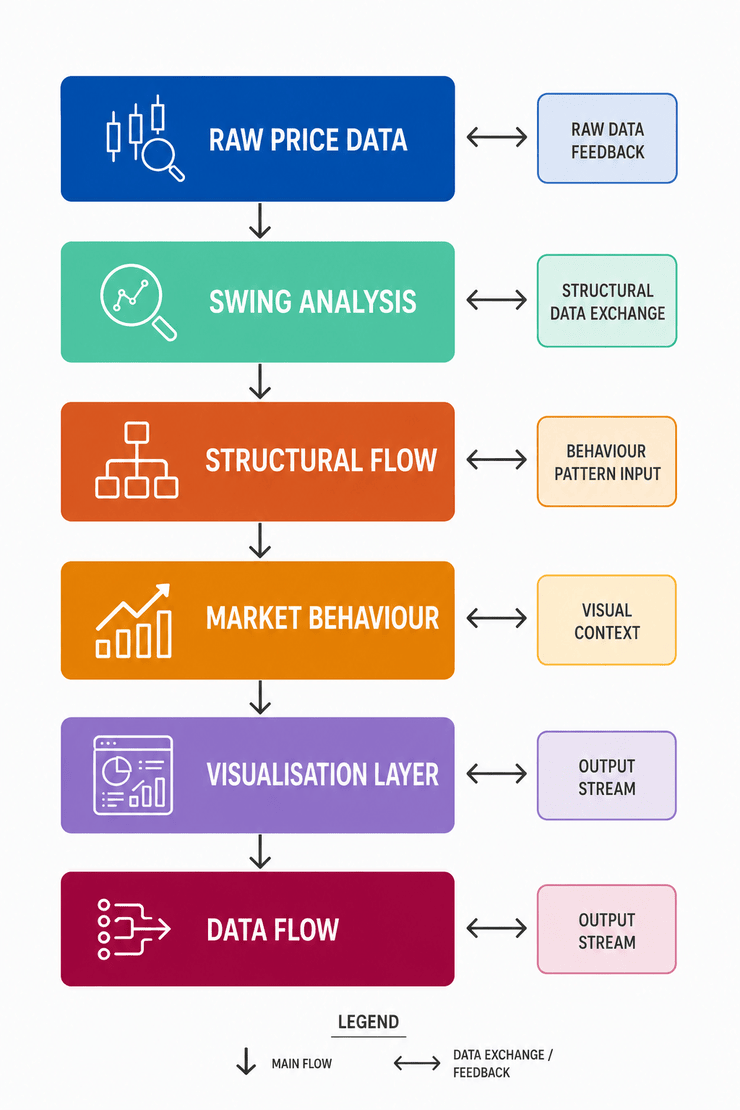
Fig. 1. Processing Pipeline Architecture
The analyzer follows three main stages:
- Market Analyzer: Detects swing points and enriches them with structural information.
- Story Engine: Interprets the collected swing data to determine market structure and latest confirmed price behavior.
- Visualization Layer: Presents the generated analysis through chart objects, dashboards, and interactive inspection tools.
This separation creates a clear path from raw price data to a structured market interpretation. Each stage builds on the output of the previous one, allowing the analyzer to remain modular and easier to extend. The analyzer exposes several input parameters that control swing detection, visual rendering, and the interactive interface.
//--- Input Parameters
input group "=== Lookback & Swing Settings ==="
input int      InpLookbackCandles = 100;                 // Recent bars to analyze
input int      InpDepth           = 10;                  // Bars each side for swing confirmation
input double   InpMinDistPoints   = 0.0;                 // Min distance from previous accepted pivot of the same type (points)

input group "=== Visual Settings ==="
input bool     InpShowLines       = true;                // Connect swings with lines
input bool     InpShowLabels      = true;                // Show HH/HL/LH/LL labels
input int      InpFontSize        = 8;                   // Label font size
input color    InpImpulseColor    = clrLimeGreen;        // Impulse line color
input color    InpPullbackColor   = clrTomato;           // Pullback line color
input color    InpLowColor        = clrDeepSkyBlue;      // Swing low arrow color
input bool     InpShowDashboard   = true;                // Show dashboard

input group "=== UI Settings ==="
input bool     InpShowMarketStory      = true;           // Enable Market Story Panel
input bool     InpEnableSwingInspector = true;           // Enable Swing Inspector on Click
input color    InpPanelBackground      = clrBlack;       // Panel background color
input color    InpPanelBorder          = clrDimGray;     // Panel border color
input color    InpPanelTitle           = clrDeepSkyBlue; // Panel title text color
input color    InpLabelColor           = clrSilver;      // Field label color
input color    InpValueColor           = clrWhite;       // Field value color
input color    InpBullishColor         = clrLimeGreen;   // Bullish status color
input color    InpBearishColor         = clrTomato;      // Bearish status color
input color    InpNeutralColor         = clrGold;        // Neutral/Transition status color
With the architecture established, we can begin by defining the data structures that store the information exchanged between these processing stages.
Creating the Core Data Structures
With the overall architecture established, the next step is defining how market information is represented internally. Rather than passing individual variables between different parts of the indicator, the analyzer organizes related information into dedicated data structures. This approach keeps the implementation organized while allowing each processing stage to work with a complete description of the latest market state.
The analyzer uses two primary structures. The first represents individual swing points detected on the chart, while the second stores the interpreted behavior of the market after all detected swings have been analyzed.
Representing Individual Swing Points
Every detected swing becomes more than a simple price level. Besides its position on the chart, the analyzer stores additional information describing how that swing relates to neighboring swings and the price movement that produced it. This enriched representation allows later stages of the analyzer to evaluate market structure without repeatedly recalculating the same information.
For each swing, the analyzer stores the timestamp, price, structural label, move length, retracement, links to neighboring swings, and the move type that produced it. Collectively, these attributes provide enough context for higher-level analysis while keeping the detection stage focused solely on identifying valid turning points.
//+------------------------------------------------------------------+
//| LAYER 1 — MARKET ANALYZER DATA STRUCTURES                        |
//+------------------------------------------------------------------+
struct SwingPt
  {
   datetime          t;                   // Timestamp of swing pivot
   double            price;               // Price level of swing pivot
   int               type;                // 1 = High, -1 = Low
   string            label;               // HH / LH / HL / LL classification
   int               bar_index;           // Bar index in series indexing (0 = current bar)
   double            move_length_pips;    // Length of move leading to this swing (in pips)
   int               bars_required;       // Bars taken to form move leading to this swing
   string            move_type;           // Impulse or Pullback
   double            retracement_pct;     // Retracement percentage relative to prior move (capped at 100%)
   int               prev_index;          // Array index of previous swing (-1 if none)
   int               next_index;          // Array index of next swing (-1 if pending)
  };
Once individual swings have been collected, the analyzer requires a separate structure to store the overall interpretation of the market rather than properties belonging to a single swing.
Maintaining the Evaluated Market State
While the swing structure describes individual turning points, the analyzer also maintains a summary describing the interpreted state of the market based on the latest confirmed swings. This information is updated after each analysis cycle and summarizes the interpretation derived from the latest confirmed swing and its neighbors.
Instead of repeatedly determining the latest market structure and phase, or retracement strength whenever the information is needed, the framework stores these values in a dedicated state object. This provides a central location from which the visualization layer can obtain the latest market assessment without performing additional calculations.
The stored information includes the latest market structure, latest price phase, latest structural label, next structural expectation, impulse and pullback measurements, retracement percentage, and an assessment of whether the latest structure remains intact.
//+------------------------------------------------------------------+
//| LAYER 2 — STORY ENGINE DATA STRUCTURES                           |
//+------------------------------------------------------------------+
struct MarketStoryState
  {
   string            structure;               // Bullish, Bearish, or Transition (reserved fallback)
   string            current_phase;           // Impulse, Pullback, or Consolidation (reserved fallback)
   string            latest_swing_label;      // HH, HL, LH, LL, or N/A
   string            next_expectation;        // Expected next structural form
   double            last_impulse_pips;       // Size of last confirmed impulse (pips)
   double            current_pullback_pips;   // Size of latest completed pullback (pips)
   double            retracement_pct;         // Retracement ratio of latest completed pullback
   string            structure_status;        // Intact or Threat
  };
Finally, the analyzer maintains several global variables that preserve its working state between calculation cycles. These variables store the collection of detected swings, the evaluated market story, the most recently processed bar, and the currently selected swing displayed within the Swing Inspector.
Together, these components establish the data foundation used by every subsequent stage of the analyzer. With the required structures now in place, the next step is building the execution pipeline that coordinates the entire analysis process whenever new market data becomes available.
//--- Global Engine State
datetime          g_lastBarTime       = 0;
SwingPt           g_swings[];                 // Global array storing current lookback swings
MarketStoryState  g_story;                    // Current evaluated market story
int               g_selectedSwingIdx  = -1;   // Index of swing currently displayed in Inspector
ulong g_lastObjectClickTime = 0;              // State tracking for event debouncing
Building the Analysis Pipeline
With the core data structures in place, the next step is defining how the analyzer processes incoming market data. Rather than performing every operation continuously, the indicator follows a fixed execution pipeline whenever a new bar becomes available.
The implementation begins by validating that sufficient historical data exists for analysis. If the required lookback period has not yet been loaded, the current calculation cycle is skipped until enough price history becomes available.
Next, the price arrays are configured to use series indexing, allowing the most recent bar to remain at index zero while older bars extend further into history. This indexing convention simplifies swing detection and keeps the analysis consistent with standard MQL5 practices.
For efficiency, the analyzer recalculates the structure only on a new bar. Once the current bar has already been processed, subsequent ticks simply return without repeating the entire analysis. This prevents unnecessary recalculations while ensuring that the displayed market structure remains synchronized with completed price action.Before beginning a new analysis cycle, previously drawn chart objects are removed to ensure that only the latest market interpretation is displayed. The analyzer then executes its three processing stages in sequence.
First, the Market Analyzer detects and enriches the available swing points. If insufficient swings are found to establish meaningful structure, the indicator displays an initial status panel and waits for additional price development.
Once enough structural information exists, the Story Engine evaluates the detected swings to determine the recent market behavior. Finally, the Visualization Layer renders the updated swing markers, connecting lines, dashboard, and any active Swing Inspector panel before refreshing the chart.
This layered execution sequence ensures that every calculation depends on fully prepared data from the previous stage, resulting in a clear separation between data collection, market interpretation, and visual presentation.
//+------------------------------------------------------------------+
//| Custom Indicator Iteration Function                              |
//+------------------------------------------------------------------+
int OnCalculate(const int rates_total,
                const int prev_calculated,
                const datetime &time[],
                const double &open[],
                const double &high[],
                const double &low[],
                const double &close[],
                const long &tick_volume[],
                const long &volume[],
                const int &spread[])
  {
   if(rates_total < InpLookbackCandles || InpDepth < 1)
      return(rates_total);

//--- Enforce series indexing: 0 = current live bar, moving backward into history
   ArraySetAsSeries(time, true);
   ArraySetAsSeries(high, true);
   ArraySetAsSeries(low, true);
   ArraySetAsSeries(close, true);

//--- Only recalculate structural engine on new bar formation to maintain efficiency
   if(time[0] == g_lastBarTime && prev_calculated == rates_total)
      return(rates_total);

   g_lastBarTime = time[0];

//--- Clear past objects so only active lookback window is rendered visually
   DeleteAllObjects();

//--- LAYER 1: MARKET ANALYZER — DETECT & ENRICH SWING DATA

   int swing_count = AnalyzeMarketSwings(time, high, low);

   if(swing_count < 2)
     {
      if(InpShowDashboard && InpShowMarketStory)
         DrawEmptyMarketStoryPanel();
      return(rates_total);
     }

//--- LAYER 2: STORY ENGINE — INTERPRET STRUCTURE & PHASES
   EvaluateMarketStory();

//--- LAYER 3: USER INTERFACE — RENDER CHART OBJECTS & PANELS

   RenderChartVisuals();

   if(InpShowDashboard && InpShowMarketStory)
     {
      RenderMarketStoryPanel();
     }

//--- Maintain active Swing Inspector panel state across bar updates
   if(InpEnableSwingInspector && g_selectedSwingIdx >= 0 && g_selectedSwingIdx < ArraySize(g_swings))
     {
      RenderSwingInspectorPanel(g_swings[g_selectedSwingIdx]);
     }

   ChartRedraw(0);
   return(rates_total);
  }
Although the analysis pipeline performs most of the work, the indicator also includes lightweight initialization and cleanup routines. During initialization, chart event handling is enabled to support the interactive Swing Inspector. When the indicator is removed, all objects created by the analyzer are deleted to leave the chart in a clean state.
//+------------------------------------------------------------------+
//| Custom Indicator Initialization Function                         |
//+------------------------------------------------------------------+
int OnInit()
  {
//--- Enable chart event handling for mouse clicks
   ChartSetInteger(0, CHART_EVENT_OBJECT_CREATE, true);
   ChartSetInteger(0, CHART_EVENT_MOUSE_MOVE, false);

   return(INIT_SUCCEEDED);
  }

//+------------------------------------------------------------------+
//| Custom Indicator Deinitialization Function                       |
//+------------------------------------------------------------------+
void OnDeinit(const int reason)
  {
   DeleteAllObjects();
  }
Detecting and Enriching Market Swings
Every structural analysis begins with identifying candidate turning points in price. Before the analyzer can determine whether the market is bullish or bearish, classify impulses and pullbacks, or evaluate retracement strength, it must first establish where meaningful swing highs and swing lows occur.
The analyzer scans the configured lookback window and confirms potential turning points using the defined swing depth. Once a valid pivot is identified, it is classified relative to the previously accepted swing of the same type as a Higher High (HH), Lower High (LH), Higher Low (HL), or Lower Low (LL). However, a swing point alone only describes where price changed direction. To make these points useful for higher-level interpretation, the analyzer enriches each detected swing with additional structural information.
After collecting the initial swing sequence, the analyzer establishes relationships between consecutive pivots by storing references to previous and next swings. It also records the distance between consecutive swings, the number of bars required for each move, and the retracement percentage relative to the previous movement.
This additional information transforms each swing from a simple chart marker into a structural object that describes both its location and its role within the broader market sequence.
These enriched swing objects provide the foundation for the Story Engine, which later uses them to evaluate market structure, classify impulses and pullbacks, and generate the recent market behavior description.
The swing identification process relies on three small helper functions. The first two determine whether a candidate bar qualifies as a swing high or swing low based on the configured depth, while the third applies the optional minimum distance filter to discard pivots too close to the previously accepted pivot of the same type that may represent insignificant price fluctuations.
Although these helper functions are relatively compact, separating them from the main analysis routine keeps the implementation easier to read and allows the primary function to focus on building and enriching the sequence of structural turning points.
//+------------------------------------------------------------------+
//| Swing high detection using series indexing                       |
//+------------------------------------------------------------------+
bool IsSwingHigh(const int i, const double &high[])
  {
   for(int k = 1; k <= InpDepth; k++)
     {
      if(high[i] <= high[i - k])
         return(false);
      if(high[i] <= high[i + k])
         return(false);
     }
   return(true);
  }

//+------------------------------------------------------------------+
//| Swing low detection using series indexing                        |
//+------------------------------------------------------------------+
bool IsSwingLow(const int i, const double &low[])
  {
   for(int k = 1; k <= InpDepth; k++)
     {
      if(low[i] >= low[i - k])
         return(false);
      if(low[i] >= low[i + k])
         return(false);
     }
   return(true);
  }

//+--------------------------------------------------------------------------------------+
//| Filters candidate pivots against the previous accepted pivot of the same type        |
//+--------------------------------------------------------------------------------------+
bool PassDistFilter(const double price, const double prev, const bool has_prev)
  {
   if(!has_prev || InpMinDistPoints <= 0.0)
      return(true);
   return(MathAbs(price - prev) >= InpMinDistPoints * _Point);
  }
The helper functions provide the individual validation steps, while the main analysis routine combines them into a complete swing sequence. AnalyzeMarketSwings() scans the configured lookback window, accepts valid pivots, assigns structural labels, and then enriches the collected swings with neighboring links, move length, bar count, and retracement information.
//+------------------------------------------------------------------+
//| LAYER 1 IMPLEMENTATION: DETECT AND ENRICH SWINGS                 |
//+------------------------------------------------------------------+
int AnalyzeMarketSwings(const datetime &time[], const double &high[], const double &low[])
  {
   ArrayFree(g_swings);
   SwingPt temp_swings[];
   ArrayResize(temp_swings, InpLookbackCandles*2);
   int count = 0;

   double last_high_price = 0.0;
   double last_low_price  = 0.0;
   bool has_high = false;
   bool has_low  = false;

//--- Scan lookback window from oldest bars to newest
   for(int i = InpLookbackCandles - InpDepth - 1; i >= InpDepth; i--)
     {
      if(IsSwingHigh(i, high))
        {
         double price = high[i];
         if(!PassDistFilter(price, last_high_price, has_high))
            continue;

         string label = (!has_high || price > last_high_price) ? "HH" : "LH";
         last_high_price = price;
         has_high = true;

         temp_swings[count].t          = time[i];
         temp_swings[count].price      = price;
         temp_swings[count].type       = 1;
         temp_swings[count].label      = label;
         temp_swings[count].bar_index  = i;
         count++;
        }

      if(IsSwingLow(i, low))
        {
         double price = low[i];
         if(!PassDistFilter(price, last_low_price, has_low))
            continue;

         string label = (!has_low || price > last_low_price) ? "HL" : "LL";
         last_low_price = price;
         has_low = true;

         temp_swings[count].t          = time[i];
         temp_swings[count].price      = price;
         temp_swings[count].type       = -1;
         temp_swings[count].label      = label;
         temp_swings[count].bar_index  = i;
         count++;
        }
     }

   if(count == 0)
      return(0);

   ArrayResize(g_swings, count);

//--- Copy and populate metadata linking swings together
   for(int s = 0; s < count; s++)
     {
      g_swings[s] = temp_swings[s];
      g_swings[s].prev_index = (s > 0) ? s - 1 : -1;
      g_swings[s].next_index = (s < count - 1) ? s + 1 : -1;

      if(s > 0)
        {
         g_swings[s].move_length_pips = MathAbs(g_swings[s].price - g_swings[s - 1].price) / GetPipSize();
         g_swings[s].bars_required   = MathAbs(g_swings[s].bar_index - g_swings[s - 1].bar_index);
         //--- Retracement calculation relative to previous swing move
         if(s >= 2)
           {
            double prior_move = MathAbs(g_swings[s - 1].price - g_swings[s - 2].price);
            double curr_move  = MathAbs(g_swings[s].price - g_swings[s - 1].price);

            double raw_retracement = (prior_move > 0) ? (curr_move / prior_move) * 100.0 : 0.0;
            g_swings[s].retracement_pct = MathMin(raw_retracement, 100.0);
           }
         else
           {
            g_swings[s].retracement_pct = 0.0;
           }
        }
      else
        {
         g_swings[s].move_length_pips = 0.0;
         g_swings[s].bars_required   = 0;
         g_swings[s].retracement_pct = 0.0;
        }
     }

   return(count);
  }
With the swing points identified, classified, and enriched with structural information, the analyzer now has a structural representation of recent price behavior. The next stage uses this prepared swing data to evaluate market structure, classify price movement into impulses and pullbacks, and generate the market behavior state.
Evaluating Market Behavior
With the swing sequence identified, classified, and enriched with structural information, the analyzer now has the context required to interpret the state of the market. Instead of examining individual turning points in isolation, the Story Engine interprets the latest confirmed swing and its immediate predecessor to determine the structural state.
This stage represents the interpretation layer of the framework. Using the prepared swing data, the Story Engine identifies the prevailing market structure, determines whether the latest completed movement was an impulse or a correction, measures recent movement strength, and generates a concise description of the latest market condition.
The evaluation begins by determining the prevailing market structure. Rather than analyzing every historical swing equally, the analyzer focuses on the most recent confirmed structural sequence. A structure ending with a Higher High (HH) or Higher Low (HL) is interpreted as bullish, while a Lower High (LH) or Lower Low (LL) indicates bearish conditions. The classifier reserves a Transition state for cases where no directional label can be assigned; with the current detection logic this state is not reached, since every confirmed swing receives one of the four labels.
Once the broader structure has been established, each completed movement is evaluated according to its role within that context. In bullish conditions, upward movements are treated as impulses while downward movements represent pullbacks. The opposite interpretation applies during bearish conditions, allowing the same price movements to be analyzed relative to the evaluated market structure rather than simply their direction.
The Story Engine then determines the latest market phase using the latest completed movement. This allows the analyzer to describe whether the latest completed movement expanded with the prevailing structure or retraced against it. Based on this phase, the framework also defines the next structural point implied by the current sequence — a structural description, not a price forecast.
Finally, it applies a simple heuristic limited to corrective phases: if the latest completed pullback retraces more than 80% of the preceding move, the structure is Threatened; otherwise, it is Intact. During impulse phases the status is always Intact. This assessment does not predict future price movement; it simply describes the latest state of the market based on the available information.
By combining these observations, the Story Engine transforms a collection of enriched swing points into a structured description of market behavior that can be displayed to the trader or used by other components of the framework.
//+------------------------------------------------------------------+
//| LAYER 2 IMPLEMENTATION: STORY ENGINE (CONTEXT & PHASES)          |
//+------------------------------------------------------------------+
void EvaluateMarketStory()
  {
   int count = ArraySize(g_swings);
   if(count < 2)
      return;

   int last = count - 1;
   SwingPt latest_swing = g_swings[last];
   SwingPt prev_swing   = g_swings[last - 1];

//--- 1. Determine Confirmed Structure based on the latest swing
   if(latest_swing.label == "HH" || latest_swing.label == "HL")
     {
      g_story.structure = "Bullish";
     }
   else
      if(latest_swing.label == "LH" || latest_swing.label == "LL")
        {
         g_story.structure = "Bearish";
        }
      else
        {
         g_story.structure = "Transition";
        }

//--- 2. Classify Move Types (Impulse vs Pullback contextualized to Structure)
   for(int s = 1; s < count; s++)
     {
      bool rising = (g_swings[s - 1].price < g_swings[s].price);
      if(g_story.structure == "Bullish")
         g_swings[s].move_type = rising ? "Impulse" : "Pullback";
      else
         if(g_story.structure == "Bearish")
            g_swings[s].move_type = !rising ? "Impulse" : "Pullback";
         else
            g_swings[s].move_type = rising ? "Impulse" : "Pullback";
     }

//--- 3. Latest Confirmed Phase & Structural Expectation
   g_story.current_phase      = g_swings[last].move_type;
   g_story.latest_swing_label = g_swings[last].label;

   if(g_story.structure == "Bullish")
     {
      g_story.next_expectation = (g_story.current_phase == "Impulse") ? "Higher Low" : "Higher High";
     }
   else
      if(g_story.structure == "Bearish")
        {
         g_story.next_expectation = (g_story.current_phase == "Impulse") ? "Lower High" : "Lower Low";
        }
      else
        {
         g_story.next_expectation = "Consolidation";
        }

//--- 4. Calculate Impulse, Pullback & Retracement Metrics Phase-by-Phase
   if(g_story.current_phase == "Pullback")
     {
      g_story.current_pullback_pips = g_swings[last].move_length_pips;
      g_story.retracement_pct      = g_swings[last].retracement_pct;

      if(last >= 1)
         g_story.last_impulse_pips  = g_swings[last - 1].move_length_pips;
      else
         g_story.last_impulse_pips  = 0.0;

      //--- Structure threat check applies to the latest confirmed pullback
      if(g_story.retracement_pct > 80.0)
         g_story.structure_status = "Threatened";
      else
         g_story.structure_status = "Intact";
     }

//--- Latest Phase == "Impulse"
   else
     {
      g_story.last_impulse_pips     = g_swings[last].move_length_pips;
      g_story.current_pullback_pips = 0.0;
      g_story.retracement_pct      = 0.0;
      g_story.structure_status     = "Intact"; // Active impulse expanding into structural territory is healthy
     }
  }
At this stage, the analyzer has completed the process of converting price data into a structured market interpretation. The remaining task is presenting this information in a clear and interactive way through chart visualization components.
Building the Market Story Dashboard
The analysis performed by the Story Engine produces a collection of values describing the latest market condition. However, raw calculations alone are not enough. For the information to become useful, it must be presented in a format that allows the trader to quickly understand the market's structural state. The Market Story Dashboard serves as the main summary layer of the analyzer. Instead of requiring the trader to manually interpret individual swing points, the dashboard combines the calculated structural information into a compact overview of the latest market behavior.
The dashboard is generated from the MarketStoryState structure created during the evaluation stage. Because the interpretation has already been completed before rendering begins, the visualization layer does not perform any additional market analysis. Its responsibility is simply to present the conclusions produced by the Story Engine.
The dashboard is split into key sections. The Structure field represents the directional read derived from the latest confirmed swing label. This provides the broader context required to interpret the movements currently taking place.
The Latest Phase identifies whether the latest confirmed movement was an impulse or a corrective pullback. This distinction allows the trader to understand whether the latest movement supports or opposes the prevailing structure. The Latest Swing and Next Expectation fields provide a view of the structural sequence.
The latest swing shows the current position in the sequence. The next expectation describes which structural point would typically follow. The movement measurements provide additional context by comparing recent price behavior. The dashboard displays the size of the previous impulse, the most recently completed pullback (the analyzer does not measure an unfinished pullback in real time), and the retracement percentage between them. These values allow the trader to evaluate the strength of the correction without relying purely on visual estimation.Finally, the Structure Status field provides a simplified assessment of whether the structure remains intact or whether the latest completed pullback retraced more than 80% of the preceding impulse, flagging the structure as Threatened.
//+------------------------------------------------------------------+
//| MARKET STORY PANEL VISUALIZATION ENGINE                          |
//+------------------------------------------------------------------+
void RenderMarketStoryPanel()
  {
   string p = Prefix + "MS_";
   int x = 15;
   int y = 20;
   int width = 210;
   int row_h = 18;

//--- Draw background card
   CreateOrUpdateRect(p + "BG", x, y, width, 185, InpPanelBackground, InpPanelBorder);

//--- Title Header
   CreateOrUpdateLabel(p + "Title", x + 10, y + 8, "MARKET STORY", InpPanelTitle, 9, true);

//--- Dynamic Color Formatting
   color struct_clr = (g_story.structure == "Bullish") ? InpBullishColor :
                      (g_story.structure == "Bearish") ? InpBearishColor : InpNeutralColor;
   color status_clr = (g_story.structure_status == "Intact") ? InpBullishColor : InpBearishColor;

   int curr_y = y + 28;
   DrawPanelRow(p, "Structure",        g_story.structure,                        x + 10, curr_y, struct_clr);
   curr_y += row_h;
   DrawPanelRow(p, "Latest Phase",    g_story.current_phase,                    x + 10, curr_y, InpValueColor);
   curr_y += row_h;
   DrawPanelRow(p, "Latest Swing",     g_story.latest_swing_label,               x + 10, curr_y, InpValueColor);
   curr_y += row_h;
   DrawPanelRow(p, "Next Expectation", g_story.next_expectation,                 x + 10, curr_y, InpNeutralColor);
   curr_y += row_h;
   DrawPanelRow(p, "Last Impulse",     StringFormat("%.1f pips", g_story.last_impulse_pips), x + 10, curr_y, InpValueColor);
   curr_y += row_h;
   DrawPanelRow(p, "Latest Pullback", StringFormat("%.1f pips", g_story.current_pullback_pips), x + 10, curr_y, InpValueColor);
   curr_y += row_h;
   DrawPanelRow(p, "Retracement",      StringFormat("%.1f%%", g_story.retracement_pct),      x + 10, curr_y, InpValueColor);
   curr_y += row_h;
   DrawPanelRow(p, "Structure Status", g_story.structure_status,                 x + 10, curr_y, status_clr);
  }
The important aspect of the dashboard is that it does not create a separate interpretation system. It is only a visual representation of decisions already made by the analyzer. This separation keeps the architecture clean, allowing the analysis logic to evolve independently from the way information is displayed.
Architectural Note: Regime Context
The current implementation derives the market regime from confirmed swing structure, making the Structure field a representation of the latest HH, HL, LH, and LL relationships. More advanced implementations could extend this context with independent regime sources such as moving-average alignment, volatility conditions, or higher-timeframe structure. This would allow broader market conditions to be considered without changing the underlying swing-analysis layer. The same extension point could later add dedicated consolidation detection, enforce alternation between swing highs and swing lows, or measure pullbacks in real time instead of only after a leg completes. The framework intentionally reports only local, confirmed swing-structure evidence and does not claim to capture the full market regime.
With the overall market behavior now summarized, the next step is adding a way to explore the individual swing points that created this interpretation through the Swing Inspector.
Adding Interactive Swing Inspection
While the Market Story Dashboard provides a summary of the confirmed market condition, understanding how that conclusion was formed requires looking closer at the individual swing points that make up the structure.
The Swing Inspector adds this capability by allowing the trader to select any detected swing directly from the chart and examine the information stored by the analyzer. Instead of displaying only the final interpretation, the indicator also provides access to the underlying data used to generate that interpretation.
When a swing point is selected, the indicator matches the swing by timestamp and swing type (a bar can theoretically contain both a high and a low) from the internal swing collection and displays its stored properties through a dedicated inspection panel. This allows the trader to explore the relationship between individual structural points and the broader market behavior being displayed by the dashboard.
The inspector displays information such as:
- The structural classification of the selected swing.
- The time and price level where it occurred.
- Whether the movement was identified as an impulse or pullback.
- The move length from the previous swing (in pips).
- The number of bars required for that movement to develop.
- The neighboring swing relationships within the sequence.
//+------------------------------------------------------------------+
//| ChartEvent Handler for Interactive Swing Inspector               |
//+------------------------------------------------------------------+
void OnChartEvent(const int id,
                  const long &lparam,
                  const double &dparam,
                  const string &sparam)
  {
   if(!InpEnableSwingInspector)
      return;

//--- 1. Handle Object Click (User selects a swing arrow or text label)
   if(id == CHARTEVENT_OBJECT_CLICK)
     {
      if(StringFind(sparam, Prefix + "PT_") == 0)
        {
         //--- Record time of object click to prevent immediate trigger of CHARTEVENT_CLICK
         g_lastObjectClickTime = GetTickCount();

         //--- Parse swing timestamp and type from object name
         string parts[];
         if(StringSplit(sparam, '_', parts) >= 4)
           {
            datetime target_time = (datetime)StringToInteger(parts[2]);
            int target_type = (int)StringToInteger(parts[3]);
            int total_swings = ArraySize(g_swings);

            for(int i = 0; i < total_swings; i++)
              {
               if(g_swings[i].t == target_time && g_swings[i].type == target_type)
                 {
                  g_selectedSwingIdx = i;
                  RenderSwingInspectorPanel(g_swings[i]);
                  ChartRedraw(0);
                  return;
                 }
              }
           }
        }
     }

//--- 2. Handle Empty Chart Click (User clicks on open space to close panel)
   if(id == CHARTEVENT_CLICK)
     {
      //--- Ignore click if it was triggered as part of an object click sequence (< 200ms)
      if(GetTickCount() - g_lastObjectClickTime < 200)
         return;

      if(g_selectedSwingIdx != -1)
        {
         g_selectedSwingIdx = -1;
         DeletePanelObjects(Prefix + "SI_");
         ChartRedraw(0);
        }
     }
  }
The interaction is handled through the chart event system. When the user clicks a swing marker or label, the analyzer identifies the selected point, stores its index, and updates the inspection panel. Clicking on an empty area of the chart removes the active selection and returns the interface to its normal state.
The Swing Inspector demonstrates one of the advantages of storing enriched swing objects internally. Because every swing already contains its calculated information, the indicator does not need to perform additional analysis when the user requests details. It simply retrieves the existing data and presents it.
//+------------------------------------------------------------------+
//| SWING INSPECTOR PANEL VISUALIZATION ENGINE                       |
//+------------------------------------------------------------------+
void RenderSwingInspectorPanel(const SwingPt &sw)
  {
   string p = Prefix + "SI_";
   int x = 240; // Offset relative to Market Story panel
   int y = 20;
   int width = 210;
   int row_h = 18;

   CreateOrUpdateRect(p + "BG", x, y, width, 185, InpPanelBackground, InpPanelBorder);
   CreateOrUpdateLabel(p + "Title", x + 10, y + 8, "SWING INSPECTOR", InpPanelTitle, 9, true);

   string prev_label = (sw.prev_index >= 0) ? g_swings[sw.prev_index].label : "None";
   string next_label = (sw.next_index >= 0) ? g_swings[sw.next_index].label : "Pending";

   int curr_y = y + 28;
   DrawPanelRow(p, "Structure",      sw.label,                               x + 10, curr_y, InpPanelTitle);
   curr_y += row_h;
   DrawPanelRow(p, "Time",           TimeToString(sw.t, TIME_DATE|TIME_MINUTES), x + 10, curr_y, InpValueColor);
   curr_y += row_h;
   DrawPanelRow(p, "Price",          DoubleToString(sw.price, _Digits),     x + 10, curr_y, InpValueColor);
   curr_y += row_h;
   DrawPanelRow(p, "Move Type",      sw.move_type,                           x + 10, curr_y, (sw.move_type == "Impulse") ? InpImpulseColor : InpPullbackColor);
   curr_y += row_h;
   DrawPanelRow(p, "Move Length",    StringFormat("%.1f pips", sw.move_length_pips), x + 10, curr_y, InpValueColor);
   curr_y += row_h;
   DrawPanelRow(p, "Bars Required",  IntegerToString(sw.bars_required),     x + 10, curr_y, InpValueColor);
   curr_y += row_h;
   DrawPanelRow(p, "Previous Swing", prev_label,                             x + 10, curr_y, InpLabelColor);
   curr_y += row_h;
   DrawPanelRow(p, "Next Swing",     next_label,                             x + 10, curr_y, InpLabelColor);
  }
By combining the Market Story Dashboard with the Swing Inspector, the analyzer provides two different levels of market interpretation. The dashboard explains the latest confirmed market condition, while the inspector allows the trader to investigate the individual structural events responsible for that condition.
Operational Walkthrough: Analyzing Market Behavior
After implementing the individual components, the final step is observing the completed analyzer in operation.
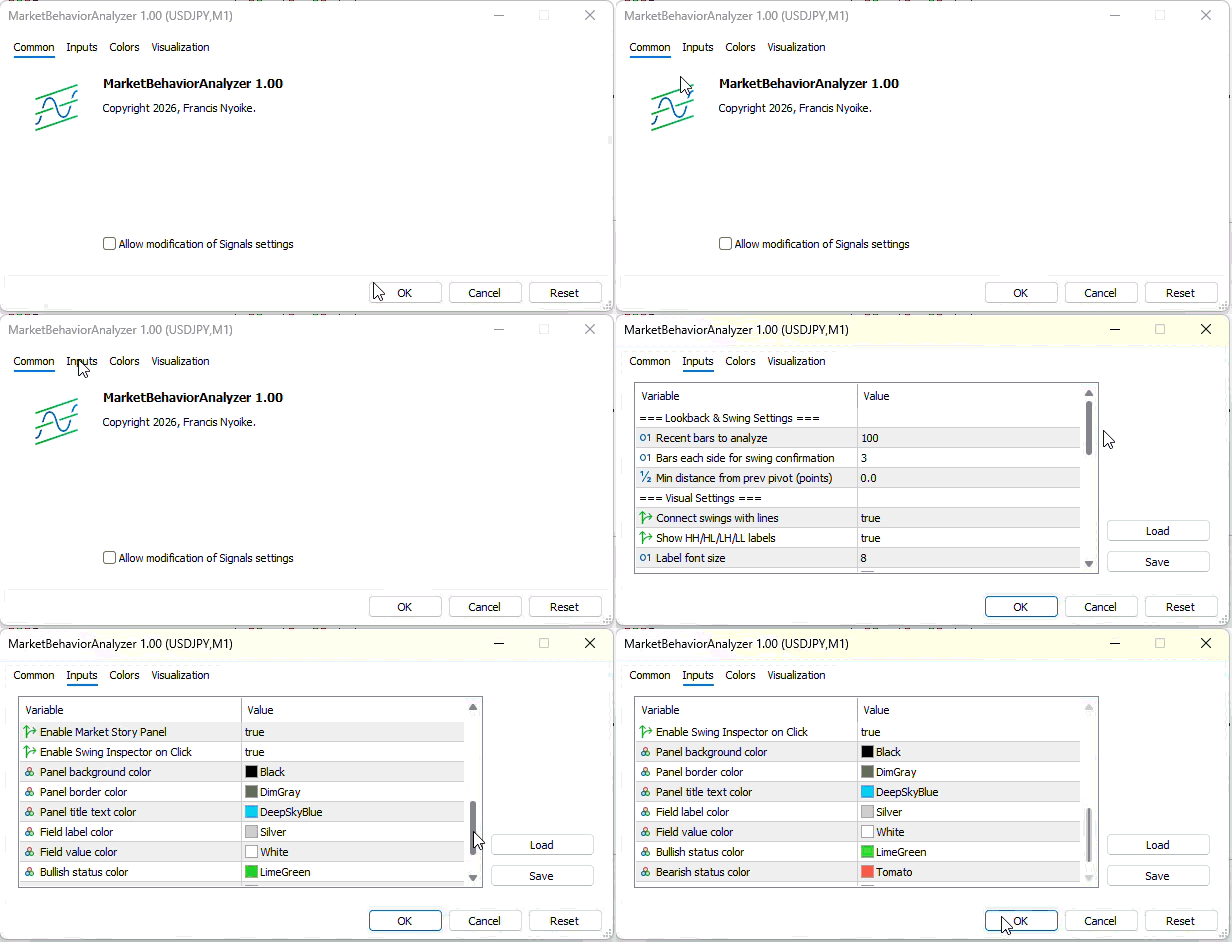
The indicator is attached to the chart with the required parameters configured.
Fig. 2. Attaching the Market Behavior Analyzer to the chart
Once loaded, the analyzer processes the available price data and generates the latest confirmed market interpretation. The completed output combines swing detection, structural classification, movement analysis, the Market Story Dashboard, and the Swing Inspector into a single chart-based interface.
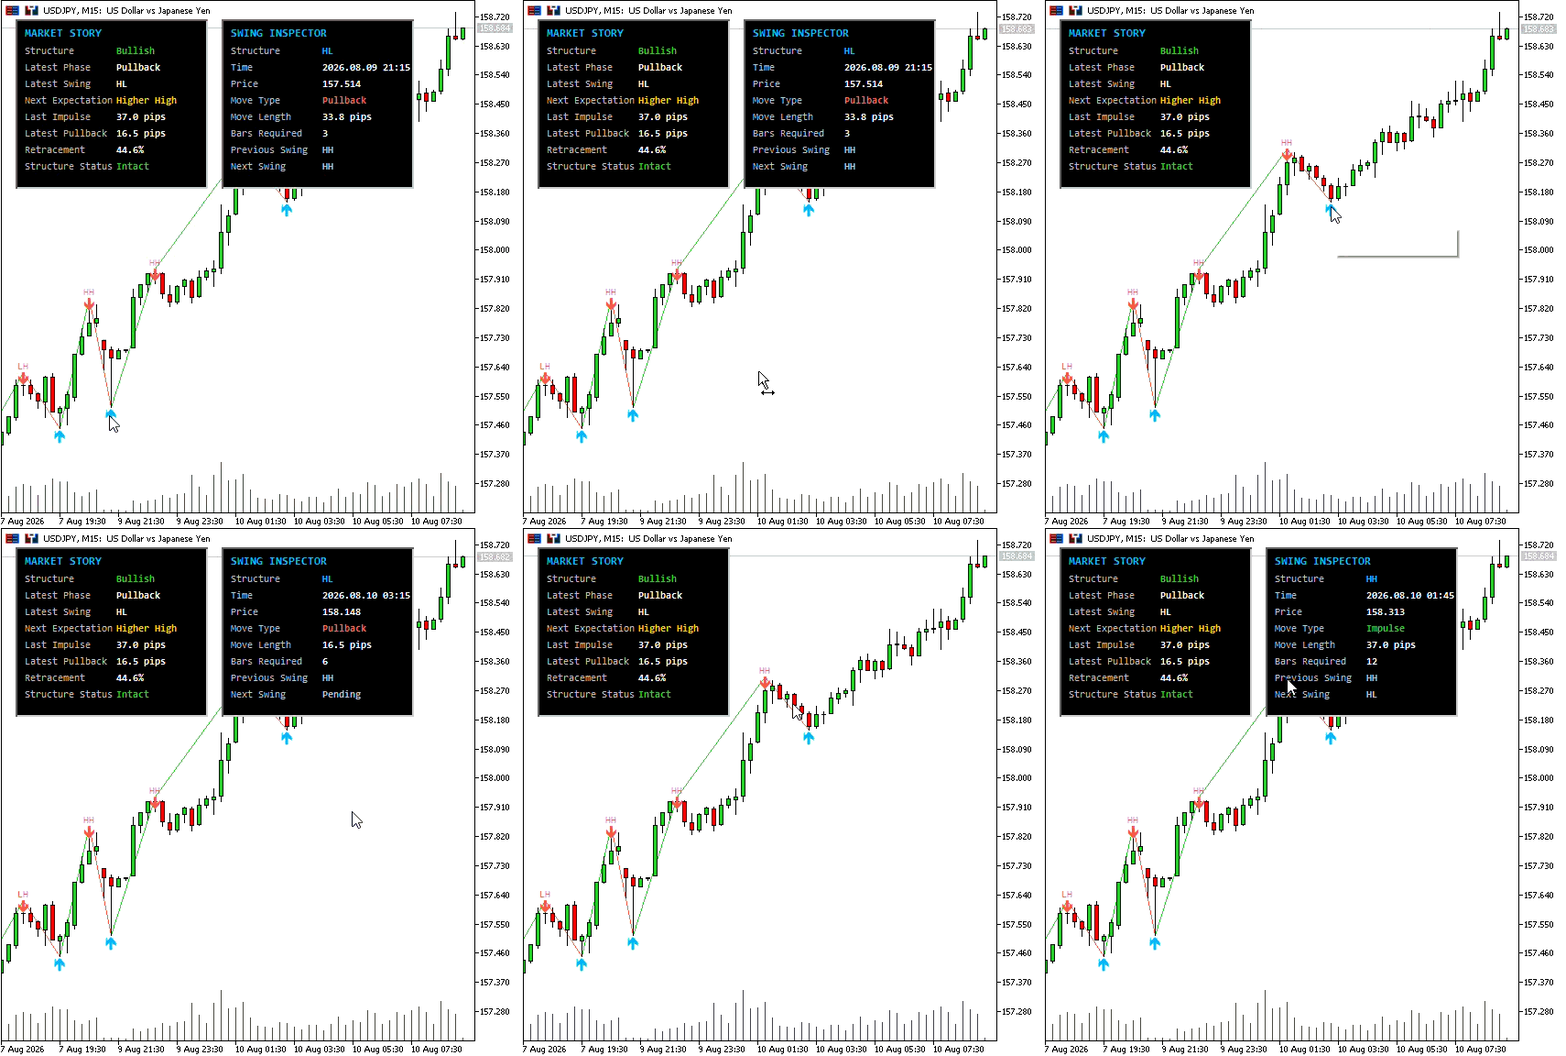
Fig. 3. Indicator Usage on Chart
The final result demonstrates the objective of the framework: transforming raw price movement into a structured representation of the latest market behavior. Instead of manually interpreting individual highs and lows, the trader can inspect the detected structure, latest phase, and supporting measurements directly from the chart. Through this workflow, the analyzer provides a complete path from price data to market interpretation while maintaining a clear separation between analysis and visual presentation.
Conclusion
In this article, we built a Market Behavior Analyzer framework for MetaTrader 5 that transforms raw price data into a structured representation of the latest market conditions. Instead of treating swing points as isolated highs and lows, the framework establishes relationships between them and uses this information to evaluate market structure, movement phases, and price behavior.
The implementation introduced a complete analysis pipeline consisting of swing detection, structural enrichment, market interpretation, and interactive visualization. Each stage has a defined responsibility, allowing the analyzer to remain organized and extendable as additional analytical features are introduced.
The completed framework does not attempt to predict future price movement. Its purpose is to provide a consistent method for describing the most recently confirmed market behavior and making that information accessible through a programmatic structure.
By converting visual chart interpretation into structured data, the Market Behavior Analyzer provides a foundation that can be extended into more advanced tools, including context-aware trading systems, decision-support components, or additional market analysis modules.
Warning: All rights to these materials are reserved by MetaQuotes Ltd. Copying or reprinting of these materials in whole or in part is prohibited.
This article was written by a user of the site and reflects their personal views. MetaQuotes Ltd is not responsible for the accuracy of the information presented, nor for any consequences resulting from the use of the solutions, strategies or recommendations described.

 Neural Networks in Trading: Robust Trading Signals in Any Market Regime (ST-Expert)
 From Novice to Expert: Trading Multi-Symbol Basket
 Features of Experts Advisors
 Market Microstructure in MQL5 (Part 9): Pullback Quality

- Free trading apps
- Over 8,000 signals for copying
- Economic news for exploring financial markets
You agree to website policy and terms of use