

Developing a Quantitative Session Analysis Tool (Part 1): Building a Data-Driven View of Market Sessions
 190
190
 0
0

Introduction
Market sessions provide a natural way to divide the trading day into distinct periods, yet their behavior is often reduced to simple visual markers on a chart. A session may have a defined opening and closing time, but its range, direction, and the order in which its high and low develop can vary considerably from one occurrence to another.
This raises a more useful question: can a trading session be represented as structured data rather than simply a box on the chart?
In this article, we begin developing a quantitative session analysis tool in MQL5. The goal is not to predict session behavior, but to establish a foundation for measuring it consistently. Each session will be converted into a structured record containing its price characteristics and selected measurements of how its range develops over time.
The resulting data can then be presented through chart markers, a comparison panel, and an interactive session inspector, allowing the same information to be viewed from both a broader and a more detailed perspective.
What We Will Build
Throughout this article, we will develop the foundation in several stages:
- Define a structured representation for session configuration and session data.
- Identify the price bars belonging to each session.
- Calculate the session's open, close, high, low, range, and net movement.
- Record the order in which the session high and low occurred.
- Measure range development at 25%, 50%, 75%, and 100% of the session duration.
- Present the resulting measurements on the chart.
- Add an interactive inspector for examining individual sessions.
Defining the Session Data Model
Before calculating anything, the tool needs a consistent representation of what a session is and what information should be retained.
Two structures are used for this purpose. SessionConfig stores the definition of each session, while SessionData stores the measurements produced from its price data.
SessionConfig contains the session name, starting time, and display color.
struct SessionConfig
  {
   string            name;                      // Identifier name for the trading session
   int               start_hour;                // Opening hour in 24-hour server time (0-23)
   int               start_min;                 // Opening minute (0-59)
   color             clr;                       // Visual display/highlight color for the session
  };
SessionData represents an individual occurrence of a session. Alongside its boundaries and OHLC values, it stores the session range, net movement, timestamps of the high and low, their order of occurrence, and four measurements describing range development.
struct SessionData
  {
   //--- Identification & Display
   string            name;                       // Session identifier (e.g., "Asian", "London", "NY")
   datetime          start_time;                 // Session opening timestamp
   datetime          end_time;                   // Session closing timestamp
   color             clr;                        // Visual display color for charts/boxes

   //--- OHLC Price Levels
   double            open;                       // Opening price of the session
   double            close;                      // Closing (or current latest) price of the session
   double            high;                       // Highest price reached during the session
   double            low;                        // Lowest price reached during the session

   //--- Extremum Timestamps
   datetime          high_time;                  // Bar timestamp containing the session high
   datetime          low_time;                   // Bar timestamp containing the session low

   //--- Volatility & Directional Metrics
   double            range;                      // Total amplitude (High - Low)
   double            net_move;                   // Net directional displacement (Close - Open)

   //--- Sequence & Price Action Order
   int               high_first;                 // 1 = high first, 0 = low first, -1 = same-bar order unknown

   //--- Cumulative Range Development
   double            range_25;                   // Cumulative range at 25% of configured session duration
   double            range_50;                   // Cumulative range at 50% of configured session duration
   double            range_75;                   // Cumulative range at 75% of configured session duration
   double            range_100;                  // Cumulative range across available session bars

   //--- State Tracking
   bool              completed;                  // Flag indicating whether the session has finalized
  };
This separation keeps the session definition independent from the observations collected from each occurrence. The configuration tells the analyzer when and where a session exists, while the data structure records what happened during it.
Global Engine State
The data structures define the session metrics. The indicator also needs persistent state to maintain runtime context. Event handlers like OnCalculate and OnChartEvent run independently. A centralized global state preserves configuration, stores session history, debounces chart clicks, and tracks the UI inspection state. The global state acts as the central memory across execution cycles.
//--- Global Engine State
SessionConfig g_configs[3];                       // Fixed definitions for the 3 active market sessions
int           g_end_hour               = 17;      // Final session close hour in server time (24h format)
int           g_end_min                = 0;       // Final session close minute
SessionData   g_sessions[];                       // Dynamic history storage for all identified session records
int           g_selectedSessionIdx     = -1;      // Array index of the currently clicked/inspected session (-1 = none)
ulong         g_lastObjectClickTime    = 0;       // Millisecond timestamp of the last chart click to prevent event spam
bool          g_isInspectingHistory    = false;   // State flag indicating if historical review mode is active
datetime      g_lastProcessedBarTime   = 0;       // Open time of the latest bar used to throttle visual marker updates
datetime      g_selectedSessionTime     = 0;      // Stable start time of the currently inspected session
These variables serve specific roles across the lifecycle of the engine:
- Session Definitions(g_configs, g_end_hour, g_end_min): Store the timing boundaries and display attributes for the three core sessions alongside the terminal daily closing time.
- Persistent History(g_sessions[]): Stores the session metrics reconstructed for the configured history window, feeding the dashboard and the session inspector.
- Interactive UI State(g_selectedSessionIdx, g_lastObjectClickTime, g_isInspectingHistory): Preserves user chart selections, debounces click events to eliminate double-triggering, and tracks whether the chart has been scrolled into history so that auto-follow can be restored at the live edge.
- Visual Update Throttling ( g_lastProcessedBarTime ): Tracks the arrival of new bars so that session marker updates are not repeated on every incoming tick.
Preparing Session Time Boundaries
The analyzer receives session times as strings such as "00:00" and "08:00". Before they can be used to locate price data, these values must be converted into separate hours and minutes components.
The ParseTimeString() helper performs this conversion and provides the resulting values to the session configuration.
//+------------------------------------------------------------------+
//| Parse Time String Helper (HH:MM)                                 |
//+------------------------------------------------------------------+
bool ParseTimeString(string time_str, int &hour, int &min)
  {
   string parts[];
   if(StringSplit(time_str, ':', parts) >= 2)
     {
      hour = (int)StringToInteger(parts[0]);
      min  = (int)StringToInteger(parts[1]);
      if(hour < 0 || hour > 23 || min < 0 || min > 59)
         return(false);
      return(true);
     }
   hour = 0;
   min  = 0;
   return(false);
  }
During initialization, the three configured sessions and the common session end time are parsed and stored in the global configuration arrays.
//+------------------------------------------------------------------+
//| Custom Indicator Initialization Function                         |
//+------------------------------------------------------------------+
int OnInit()
  {
//--- Initialize Session Configurations
   g_configs[0].name = InpSession1Name;
   g_configs[0].clr  = InpSession1Color;
   if(!ParseTimeString(InpSession1Start, g_configs[0].start_hour, g_configs[0].start_min))
      return(INIT_PARAMETERS_INCORRECT);
   g_configs[1].name = InpSession2Name;
   g_configs[1].clr  = InpSession2Color;
   if(!ParseTimeString(InpSession2Start, g_configs[1].start_hour, g_configs[1].start_min))
      return(INIT_PARAMETERS_INCORRECT);

   g_configs[2].name = InpSession3Name;
   g_configs[2].clr  = InpSession3Color;
   if(!ParseTimeString(InpSession3Start, g_configs[2].start_hour, g_configs[2].start_min))
      return(INIT_PARAMETERS_INCORRECT);

   if(!ParseTimeString(InpSessionEnd, g_end_hour, g_end_min))
      return(INIT_PARAMETERS_INCORRECT);

   int t1 = g_configs[0].start_hour * 60 + g_configs[0].start_min;
   int t2 = g_configs[1].start_hour * 60 + g_configs[1].start_min;
   int t3 = g_configs[2].start_hour * 60 + g_configs[2].start_min;
   int te = g_end_hour * 60 + g_end_min;
   if(!(t1 < t2 && t2 < t3 && t3 < te))
     {

      Print("Invalid session configuration. Part 1 requires ordered same-day session times.");
      return(INIT_PARAMETERS_INCORRECT);
     }

   g_selectedSessionIdx   = -1;
   g_selectedSessionTime  = 0;
   g_isInspectingHistory  = false;
   g_lastProcessedBarTime = 0;

//--- Enable chart event handling
   ChartSetInteger(0, CHART_EVENT_OBJECT_CREATE, true);
   ChartSetInteger(0, CHART_EVENT_MOUSE_MOVE, false);

   return(INIT_SUCCEEDED);
  }
Once initialized, the analyzer can construct concrete datetime boundaries for each trading day. This gives the data engine fixed intervals against which the available price bars can be evaluated.
Building the Session Dataset
With the session boundaries defined, the next step is to locate the corresponding price bars and turn them into session records.
BuildSessionData() rebuilds the dataset for the configured history window: it clears the previous array, iterates days, builds boundaries, collects bars, and creates SessionData records. For each session, the collected bar indices are stored temporarily. The oldest bar within the interval provides the opening price, while the newest available bar provides the current or final close value. These values are therefore bar-based measurements from the selected chart timeframe rather than reconstructed tick-level prices at the exact session boundaries. Bars are included by their opening timestamps, so on higher timeframes a boundary bar may contain price movement extending beyond the configured session interval. A new SessionData record is then created and populated with the session's basic configuration and state.
The completed field is determined by comparing the current trade server time (TimeCurrent()) with the session's end time. This allows the same data structure to represent both completed historical sessions and sessions that are still developing.
//+------------------------------------------------------------------+
//| Session Builder and Quantitative Range Development Engine        |
//+------------------------------------------------------------------+
void BuildSessionData(const datetime &time[], const double &open[], const double &high[], const double &low[], const double &close[], const int total_rates)
  {
   ArrayFree(g_sessions);

   datetime current_time = TimeCurrent();
   datetime oldest_time  = current_time - (InpHistoryDays * 86400);

   SessionData temp_sessions[];
   int count = 0;

//--- Scan days within history window
   for(int d = InpHistoryDays; d >= 0; d--)
     {
      datetime day_base = current_time - (d * 86400);
      MqlDateTime dt;
      TimeToStruct(day_base, dt);
      dt.hour = 0;
      dt.min  = 0;
      dt.sec  = 0;
      datetime day_start = StructToTime(dt);

      //--- Build day's defined boundary times
      datetime s1_start = day_start + (g_configs[0].start_hour * 3600) + (g_configs[0].start_min * 60);
      datetime s2_start = day_start + (g_configs[1].start_hour * 3600) + (g_configs[1].start_min * 60);
      datetime s3_start = day_start + (g_configs[2].start_hour * 3600) + (g_configs[2].start_min * 60);
      datetime s_end    = day_start + (g_end_hour * 3600) + (g_end_min * 60);

      datetime starts[3] = {s1_start, s2_start, s3_start};
      datetime ends[3]   = {s2_start, s3_start, s_end};

      for(int s = 0; s < 3; s++)
        {
         datetime s_st = starts[s];
         datetime s_et = ends[s];

         if(s_st < oldest_time || s_st > current_time)
            continue;

         //--- Collect all bar indices within this specific session
         int bar_indices[];
         int bar_count = 0;

         for(int b = total_rates - 1; b >= 0; b--)
           {
            if(time[b] >= s_st && time[b] < s_et)
              {
               ArrayResize(bar_indices, bar_count + 1);
               bar_indices[bar_count] = b;
               bar_count++;
              }
           }

         if(bar_count == 0)
            continue;

         //--- Oldest bar inside session represents the opening bar
         int open_bar  = bar_indices[0];
         //--- Newest bar inside session represents current/final close bar
         int close_bar = bar_indices[bar_count - 1];

         ArrayResize(temp_sessions, count + 1);
         temp_sessions[count].name       = g_configs[s].name;
         temp_sessions[count].start_time = s_st;
         temp_sessions[count].end_time   = s_et;
         temp_sessions[count].clr        = g_configs[s].clr;
         temp_sessions[count].open       = open[open_bar];
         temp_sessions[count].close      = close[close_bar];
         temp_sessions[count].completed  = (current_time >= s_et);
At this stage, each detected session has been converted from a time interval into a structured record. The remaining calculations can now operate on these records to describe the price behavior that occurred within each session.
Calculating Session Price Characteristics
Once the bars belonging to a session have been identified, the analyzer can derive its main price characteristics.
The highest and lowest prices are found by scanning the collected bars. Their bar timestamps are stored as well, allowing the tool to determine which extreme appeared first when they occur in different bars.//--- High / Low and High/Low time derivation double s_high = -DBL_MAX; double s_low = DBL_MAX; datetime s_high_t = 0; datetime s_low_t = 0; for(int k = 0; k < bar_count; k++) { int b = bar_indices[k]; if(high[b] > s_high) { s_high = high[b]; s_high_t = time[b]; } if(low[b] < s_low) { s_low = low[b]; s_low_t = time[b]; } } temp_sessions[count].high = s_high; temp_sessions[count].low = s_low; temp_sessions[count].high_time = s_high_t; temp_sessions[count].low_time = s_low_t; temp_sessions[count].range = (s_high - s_low) / GetPipSize(); temp_sessions[count].net_move = (temp_sessions[count].close - temp_sessions[count].open) / GetPipSize(); if(s_high_t < s_low_t) temp_sessions[count].high_first = 1; else if(s_low_t < s_high_t) temp_sessions[count].high_first = 0; else temp_sessions[count].high_first = -1;
The session range is calculated as the distance between the high and low, while net movement measures the difference between the closing and opening prices. Both values are converted to pips through the GetPipSize() helper using the conventional Forex pricing convention for 2/4-digit and 3/5-digit symbols.
//+------------------------------------------------------------------+
//| Pip Size Helper for Conventional FX Pricing                      |
//+------------------------------------------------------------------+
double GetPipSize()
  {
//--- 3-digit (JPY pairs) and 5-digit standard Forex pairs
   if(_Digits == 3 || _Digits == 5)
      return(_Point * 10.0);

//--- 2-digit or 4-digit pricing
   return(_Point);
  }
The resulting fields give each session a compact description of its overall price development:
- Range — total distance between the session high and low.
- Net Move — directional change from session open to close.
- High Time / Low Time — the bar timestamps containing the session extremes.
- Extreme Order — whether the high or low appeared first or remains unknown when both occur within the same bar.
These measurements form the basic quantitative description of each session.
Measuring Range Development
The total session range describes where the session ended, but it does not show how that range developed along the way. To capture this progression, the analyzer measures the cumulative range at four points in the session: 25%, 50%, 75%, and 100% of its duration.
The configured session duration defines the temporal checkpoints. At each reached checkpoint, the analyzer uses the available session bars up to that time to calculate the high-to-low distance reached so far. For a developing session, only checkpoints that have already been reached display their accumulated ranges. Unreached checkpoints remain unavailable, while Current Range shows the range measured from the session start through the latest available bar. Once the session is completed, this final value is displayed as 100% Duration.//--- Range Development (25%, 50%, 75%, 100% of duration) datetime checkpoints[4]; checkpoints[0] = s_st + (datetime)((s_et - s_st) * 0.25); checkpoints[1] = s_st + (datetime)((s_et - s_st) * 0.50); checkpoints[2] = s_st + (datetime)((s_et - s_st) * 0.75); checkpoints[3] = s_et; int q1 = -1; int q2 = -1; int q3 = -1; int q4 = bar_count - 1; for(int q = 0; q < bar_count; q++) { datetime bar_time = time[bar_indices[q]]; if(bar_time < checkpoints[0]) q1 = q; if(bar_time < checkpoints[1]) q2 = q; if(bar_time < checkpoints[2]) q3 = q; } temp_sessions[count].range_25 = (current_time >= checkpoints[0] && q1 >= 0) ? CalculateSegmentRange(q1, bar_count, bar_indices, high, low) : 0.0; temp_sessions[count].range_50 = (current_time >= checkpoints[1] && q2 >= 0) ? CalculateSegmentRange(q2, bar_count, bar_indices, high, low) : 0.0; temp_sessions[count].range_75 = (current_time >= checkpoints[2] && q3 >= 0) ? CalculateSegmentRange(q3, bar_count, bar_indices, high, low) : 0.0; temp_sessions[count].range_100 = CalculateSegmentRange(q4, bar_count, bar_indices, high, low);The calculation itself is handled by CalculateSegmentRange() , which receives the resolved bar index for a checkpoint and determines the highest high and lowest low reached up to that point.
//+------------------------------------------------------------------+
//| Calculates cumulative range up to a specific bar index in session|
//+------------------------------------------------------------------+
double CalculateSegmentRange(const int limit_idx, const int bar_count, const int &bar_indices[], const double &high[], const double &low[])
  {
   double q_h = -DBL_MAX;
   double q_l = DBL_MAX;
   for(int q = 0; q <= limit_idx && q < bar_count; q++)
     {
      int b = bar_indices[q];
      if(high[b] > q_h)
         q_h = high[b];
      if(low[b] < q_l)
         q_l = low[b];
     }
   return (q_h > q_l) ? (q_h - q_l) / GetPipSize() : 0.0;
  }
The result is stored in range_25, range_50, range_75, and range_100. This gives us more than the final session range. We can now observe how the session's range expanded as the session progressed.
Architectural Note: Session Boundaries
This version assumes sequential, same-day session boundaries. Each session starts when the previous one ends, and the last session ends at the common input-defined boundary. Overnight sessions, overlapping intervals, and timezone or DST-aware session conversion are intentionally reserved for future development. The current structure keeps session identification and comparison straightforward while establishing the foundation for those extensions.
Connecting the Data Engine to the Indicator
The session dataset must be refreshed as new market data arrives. The indicator's OnCalculate() function provides the main execution point for this process.
On each calculation, the price arrays are treated as series so that index 0 represents the current bar. The analyzer then rebuilds the session dataset using the latest available data.
//+------------------------------------------------------------------+
//| Custom Indicator Iteration Function                              |
//+------------------------------------------------------------------+
int OnCalculate(const int rates_total,
                const int prev_calculated,
                const datetime &time[],
                const double &open[],
                const double &high[],
                const double &low[],
                const double &close[],
                const long &tick_volume[],
                const long &volume[],
                const int &spread[])
  {
   if(rates_total < 10)
      return(rates_total);

//--- Enforce series indexing: 0 = current live bar, moving backward into history
   ArraySetAsSeries(time, true);
   ArraySetAsSeries(open, true);
   ArraySetAsSeries(high, true);
   ArraySetAsSeries(low, true);
   ArraySetAsSeries(close, true);

   bool is_new_bar = (time[0] != g_lastProcessedBarTime);

//--- LAYER 1 & 2: ENGINE PROCESSING — PARSE & CALCULATE SESSIONS (TICK-DRIVEN)
   BuildSessionData(time, open, high, low, close, rates_total);

//--- Revalidate selected session after dataset rebuild
   if(g_selectedSessionTime > 0)
     {
      g_selectedSessionIdx = -1;

      for(int i = 0; i < ArraySize(g_sessions); i++)
        {
         if(g_sessions[i].start_time == g_selectedSessionTime)
           {
            g_selectedSessionIdx = i;
            break;
           }
        }

      if(g_selectedSessionIdx == -1)
        {
         g_selectedSessionTime = 0;
         DeletePanelObjects(Prefix + "SI_");
         SetSessionMarkersVisible(true);
        }
     }

//--- LAYER 3: USER INTERFACE — RECONCILE SESSION MARKERS ON NEW BAR OR INITIAL LOAD
   if(is_new_bar || prev_calculated == 0)
     {
      if(InpShowSessionMarkers || InpShowSessionLabels)
         RenderSessionMarkers();

      g_lastProcessedBarTime = time[0];
     }

//--- Maintain correct marker occlusion according to Inspector open/close state
   SetSessionMarkersVisible(g_selectedSessionIdx == -1);

   if(InpShowDashboard)
      RenderMasterComparisonPanel();

   if(InpEnableInspector && g_selectedSessionIdx >= 0 && g_selectedSessionIdx < ArraySize(g_sessions))
      RenderSessionInspectorPanel(g_sessions[g_selectedSessionIdx]);
   else
      DeletePanelObjects(Prefix + "SI_");

   ChartRedraw(0);
   return(rates_total);
  }
Session markers are only reconciled when a new bar appears or when the indicator is loaded for the first time. The session dataset itself, however, is rebuilt on each calculation using the latest available bar data.
This separates the continuous data processing from the more expensive chart-object updates and keeps the visual layer from being unnecessarily recreated on every tick.
Visualizing the Session Data
The calculated session records now need a visual representation on the chart. Rather than drawing the entire session range, the tool places an interactive marker and label at each session's opening point.
RenderSessionMarkers() creates these objects from the session records already stored in g_sessions.
//+------------------------------------------------------------------+
//| Rendering and Reconciling Session Markers and Interactive Arrows |
//+------------------------------------------------------------------+
void RenderSessionMarkers()
  {
   int total = ArraySize(g_sessions);

   for(int o = ObjectsTotal(0, 0, -1) - 1; o >= 0; o--)
     {

      string object_name = ObjectName(0, o, 0, -1);
      if(StringFind(object_name, Prefix + "PT_") != 0 && StringFind(object_name, Prefix + "TXT_") != 0)
         continue;

      bool keep_object = false;
      for(int j = 0; j < total; j++)
        {

         string identity = g_sessions[j].name + "_" + IntegerToString((long)g_sessions[j].start_time);
         if(object_name == Prefix + "PT_" + identity || object_name == Prefix + "TXT_" + identity)
           {

            keep_object = true;
            break;
           }
        }

      if(!keep_object)
         ObjectDelete(0, object_name);
     }

   for(int i = 0; i < total; i++)
     {
      datetime t = g_sessions[i].start_time;
      double   p = g_sessions[i].open;
      string   time_id = g_sessions[i].name + "_" + IntegerToString((long)t);

      //--- Interactive arrow at session open
      if(InpShowSessionMarkers)
        {
         string arrow_name = Prefix + "PT_" + time_id;
         if(ObjectFind(0, arrow_name) < 0)
           {
            ObjectCreate(0, arrow_name, OBJ_ARROW, 0, t, p);
            ObjectSetInteger(0, arrow_name, OBJPROP_ARROWCODE, 234); // Downward pointing arrow
            ObjectSetInteger(0, arrow_name, OBJPROP_COLOR, g_sessions[i].clr);
            ObjectSetInteger(0, arrow_name, OBJPROP_WIDTH, 2);
            ObjectSetInteger(0, arrow_name, OBJPROP_SELECTABLE, false);
            ObjectSetInteger(0, arrow_name, OBJPROP_BACK, false);
            ObjectSetInteger(0, arrow_name, OBJPROP_ZORDER, 0);
           }
         else
           {
            ObjectMove(0, arrow_name, 0, t, p);
            ObjectSetInteger(0, arrow_name, OBJPROP_COLOR, g_sessions[i].clr);
           }
        }

      //--- Session text label
      if(InpShowSessionLabels)
        {
         string label_name = Prefix + "TXT_" + time_id;
         if(ObjectFind(0, label_name) < 0)
           {
            ObjectCreate(0, label_name, OBJ_TEXT, 0, t, p);
            ObjectSetString(0, label_name, OBJPROP_TEXT, " " + ToUpperSafe(g_sessions[i].name));
            ObjectSetInteger(0, label_name, OBJPROP_COLOR, g_sessions[i].clr);
            ObjectSetInteger(0, label_name, OBJPROP_FONTSIZE, InpFontSize);
            ObjectSetString(0, label_name, OBJPROP_FONT, "Consolas Bold");
            ObjectSetInteger(0, label_name, OBJPROP_ANCHOR, ANCHOR_LOWER);
            ObjectSetInteger(0, label_name, OBJPROP_SELECTABLE, false);
            ObjectSetInteger(0, label_name, OBJPROP_ZORDER, 0);
           }
         else
           {
            ObjectMove(0, label_name, 0, t, p);
            ObjectSetString(0, label_name, OBJPROP_TEXT, " " + ToUpperSafe(g_sessions[i].name));
            ObjectSetInteger(0, label_name, OBJPROP_COLOR, g_sessions[i].clr);
           }
        }
     }
  }
The objects use the session's start time and opening price, so the visual layer remains directly tied to the underlying data. The session name and configured color are also taken from the corresponding record. The marker objects are given unique names using the common Prefix (e.g., "PT_" / "TXT_"), session name, and start time. This makes them easy to identify and manage separately from other chart objects.
Building the Session Comparison Panel
While the markers provide a way to locate sessions, a comparison view is more useful for quickly reviewing their measurements.
The master panel compares the available configured sessions from the latest common trading day together with their range and net movement.
//+------------------------------------------------------------------+
//| Master Comparison Panel                                          |
//+------------------------------------------------------------------+
void RenderMasterComparisonPanel()
  {
   string p = Prefix + "MC_";
   int x = 15;
   int y = 25;
   int width = 230;
   int height = 115;
   int row_h = 18;

   CreateOrUpdateRect(p + "BG", x, y, width, height, InpPanelBackground, InpPanelBorder);
   CreateOrUpdateLabel(p + "Title", x + 10, y + 8, "SESSION COMPARISON", InpPanelTitle, 9, true);

//--- Sub-headers
   CreateOrUpdateLabel(p + "HDR_SESS",  x + 10,  y + 28, "SESSION",  InpLabelColor, 8, true);
   CreateOrUpdateLabel(p + "HDR_RANGE", x + 110, y + 28, "RANGE",    InpLabelColor, 8, true);
   CreateOrUpdateLabel(p + "HDR_NET",   x + 175, y + 28, "NET",      InpLabelColor, 8, true);

   string session_names[3] = {InpSession1Name, InpSession2Name, InpSession3Name};
   int total = ArraySize(g_sessions);
   int curr_y = y + 48;

   datetime comparison_day = 0;
   if(total > 0)
     {

      MqlDateTime comparison_dt;
      TimeToStruct(g_sessions[total - 1].start_time, comparison_dt);
      comparison_dt.hour = 0;
      comparison_dt.min  = 0;
      comparison_dt.sec  = 0;
      comparison_day = StructToTime(comparison_dt);
     }

   for(int s = 0; s < 3; s++)
     {
      //--- Find occurrence of this session from the common comparison day
      int found_idx = -1;
      for(int i = total - 1; i >= 0; i--)
        {
         if(g_sessions[i].name == session_names[s] && g_sessions[i].start_time >= comparison_day && g_sessions[i].start_time < comparison_day + 86400)
           {
            found_idx = i;
            break;
           }
        }

      string r_str = "-";
      string n_str = "-";
      color net_clr = InpValueColor;

      if(found_idx >= 0)
        {
         r_str = StringFormat("%.1f", g_sessions[found_idx].range);
         double net = g_sessions[found_idx].net_move;
         n_str = StringFormat("%+.1f", net);
         net_clr = (net > 0) ? InpPositiveColor : (net < 0) ? InpNegativeColor : InpNeutralColor;
        }

      CreateOrUpdateLabel(p + "ROW_N_" + IntegerToString(s), x + 10, curr_y, session_names[s], InpValueColor, 8, false);
      CreateOrUpdateLabel(p + "ROW_R_" + IntegerToString(s), x + 110, curr_y, r_str, InpValueColor, 8, false);
      CreateOrUpdateLabel(p + "ROW_M_" + IntegerToString(s), x + 175, curr_y, n_str, net_clr, 8, true);

      curr_y += row_h;
     }
  }
The panel does not perform new calculations. It reads the values already produced by the session engine and presents them in a compact format. Net movement is also given a directional color, making positive and negative sessions immediately distinguishable.
This establishes the first level of interaction: compare the latest sessions without leaving the chart.
Adding an Interactive Session Inspector
A comparison is useful for an overview, but individual sessions contain more information than the summary panel can display. The session inspector provides access to the complete SessionData record for a selected session.
When a session marker or label is clicked, OnChartEvent() identifies the corresponding session using its name and start time and assigns its index to g_selectedSessionIdx. The same event handler also manages closing the inspector when the user clicks an empty area of the chart.
//+------------------------------------------------------------------+
//| Chart Event Handling Object Selection and Navigation             |
//+------------------------------------------------------------------+
void OnChartEvent(const int id,
                  const long &lparam,
                  const double &dparam,
                  const string &sparam)
  {
//--- 1. Handle Viewport / Scroll Changes for Auto Navigation
   if(id == CHARTEVENT_CHART_CHANGE)
     {
      CheckLiveEdgeState();
      return;
     }

//--- 2. Handle Object Click (User selects a session arrow or label)
   if(id == CHARTEVENT_OBJECT_CLICK)
     {
      if(!InpEnableInspector)
         return;

      if(StringFind(sparam, Prefix + "PT_") == 0 || StringFind(sparam, Prefix + "TXT_") == 0)
        {
         //--- Record time of object click to prevent immediate trigger of CHARTEVENT_CLICK
         g_lastObjectClickTime = GetTickCount();

         string object_prefix = (StringFind(sparam, Prefix + "PT_") == 0) ? Prefix + "PT_" : Prefix + "TXT_";
         string identity = StringSubstr(sparam, StringLen(object_prefix));

         int separator = -1;
         for(int p = StringLen(identity) - 1; p >= 0; p--)
           {
            if(StringSubstr(identity, p, 1) == "_")
              {
               separator = p;
               break;
              }
           }

         if(separator > 0)
           {
            datetime target_time = (datetime)StringToInteger(StringSubstr(identity, separator + 1));
            string target_name = StringSubstr(identity, 0, separator);
            int total_sessions = ArraySize(g_sessions);

            for(int i = 0; i < total_sessions; i++)
              {
               if(g_sessions[i].start_time == target_time && g_sessions[i].name == target_name)
                 {
                  g_selectedSessionIdx = i;
                  g_selectedSessionTime = g_sessions[i].start_time;
                  SetSessionMarkersVisible(false);
                  RenderSessionInspectorPanel(g_sessions[i]);
                  ChartRedraw(0);
                  return;
                 }
              }
           }
        }
     }

//--- 3. Handle Empty Chart Click (User clicks on open space to close panel)
   if(id == CHARTEVENT_CLICK)
     {
      //--- Ignore click if it was triggered as part of an object click sequence (< 200ms)
      if(GetTickCount() - g_lastObjectClickTime < 200)
         return;

      if(g_selectedSessionIdx != -1)
        {
         g_selectedSessionIdx = -1;
         g_selectedSessionTime = 0;
         DeletePanelObjects(Prefix + "SI_");
         SetSessionMarkersVisible(true);
         ChartRedraw(0);
        }
     }
  }
Once a session has been selected, RenderSessionInspectorPanel() displays its price characteristics, high/low order, and range development measurements.
//+------------------------------------------------------------------+
//| Session Inspector Panel                                          |
//+------------------------------------------------------------------+
void RenderSessionInspectorPanel(const SessionData &sess)
  {
   string p = Prefix + "SI_";
   int x = 255;
   int y = 25;
   int width = 230;
   int height = 285;
   int row_h = 17;

   CreateOrUpdateRect(p + "BG", x, y, width, height, InpPanelBackground, InpPanelBorder);
   CreateOrUpdateLabel(p + "Title", x + 10, y + 8, ToUpperSafe(sess.name) + " INSPECTOR", sess.clr, 9, true);

   color net_clr = (sess.net_move > 0) ? InpPositiveColor : (sess.net_move < 0) ? InpNegativeColor : InpNeutralColor;
   string order_str = "UNKNOWN";
   if(sess.high_first == 1)
      order_str = "HIGH -> LOW";
   else
      if(sess.high_first == 0)
         order_str = "LOW -> HIGH";

   int curr_y = y + 28;
   DrawPanelRow(p, "Open",        DoubleToString(sess.open, _Digits), x + 10, curr_y, InpValueColor);
   curr_y += row_h;
   DrawPanelRow(p, "Close",       DoubleToString(sess.close, _Digits), x + 10, curr_y, InpValueColor);
   curr_y += row_h;
   DrawPanelRow(p, "Range",       StringFormat("%.1f pips", sess.range), x + 10, curr_y, InpValueColor);
   curr_y += row_h;
   DrawPanelRow(p, "Net Move",    StringFormat("%+.1f pips", sess.net_move), x + 10, curr_y, net_clr);
   curr_y += row_h;
   DrawPanelRow(p, "High",        DoubleToString(sess.high, _Digits), x + 10, curr_y, InpHighColor);
   curr_y += row_h;
   DrawPanelRow(p, "High Time",   TimeToString(sess.high_time, TIME_MINUTES), x + 10, curr_y, InpLabelColor);
   curr_y += row_h;
   DrawPanelRow(p, "Low",         DoubleToString(sess.low, _Digits), x + 10, curr_y, InpLowColor);
   curr_y += row_h;
   DrawPanelRow(p, "Low Time",    TimeToString(sess.low_time, TIME_MINUTES), x + 10, curr_y, InpLabelColor);
   curr_y += row_h;
   DrawPanelRow(p, "H/L Order",   order_str, x + 10, curr_y, InpNeutralColor);

   curr_y += (row_h + 4);
   CreateOrUpdateLabel(p + "DEV_TITLE", x + 10, curr_y, "RANGE DEVELOPMENT", InpPanelTitle, 8, true);
   curr_y += row_h;

   datetime inspect_time = TimeCurrent();
   datetime duration = sess.end_time - sess.start_time;
   bool reached_25 = inspect_time >= sess.start_time + (datetime)(duration * 0.25);
   bool reached_50 = inspect_time >= sess.start_time + (datetime)(duration * 0.50);
   bool reached_75 = inspect_time >= sess.start_time + (datetime)(duration * 0.75);

   DrawPanelRow(p, "25% Duration",  reached_25 ? StringFormat("%.1f pips", sess.range_25) : "-",  x + 10, curr_y, InpValueColor);
   curr_y += row_h;
   DrawPanelRow(p, "50% Duration",  reached_50 ? StringFormat("%.1f pips", sess.range_50) : "-",  x + 10, curr_y, InpValueColor);
   curr_y += row_h;
   DrawPanelRow(p, "75% Duration",  reached_75 ? StringFormat("%.1f pips", sess.range_75) : "-",  x + 10, curr_y, InpValueColor);
   curr_y += row_h;
   DrawPanelRow(p, sess.completed ? "100% Duration" : "Current Range", StringFormat("%.1f pips", sess.range_100), x + 10, curr_y, InpValueColor);
  }
This allows the analyzer to follow live data during normal use while still allowing historical sessions to be explored without losing the selected view.
Operating the Session Analysis Tool
With the main components in place, the indicator can now be attached to a chart to inspect the configured market sessions. The session definitions and display options can be adjusted through the input parameters.
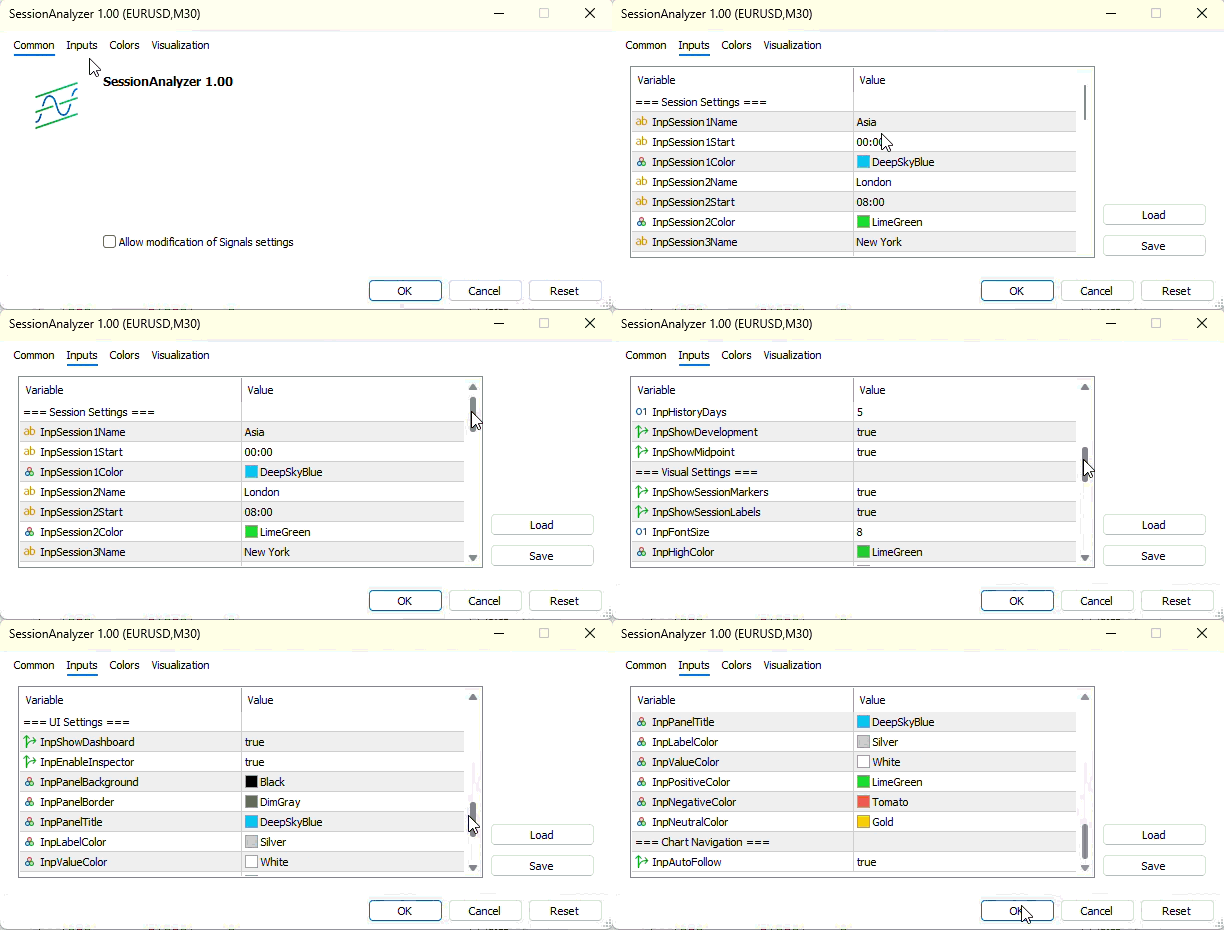
Fig. 1. Inserting the Indicator on the chart
Once attached, the analyzer identifies the configured sessions within the selected history and displays their markers on the chart. The comparison panel provides a quick view of the available sessions from the latest common trading day, including their range and net movement.
Clicking a session marker opens the inspector, where the selected session's price characteristics, high/low order, and range development can be examined. Clicking an empty area of the chart closes the inspector.
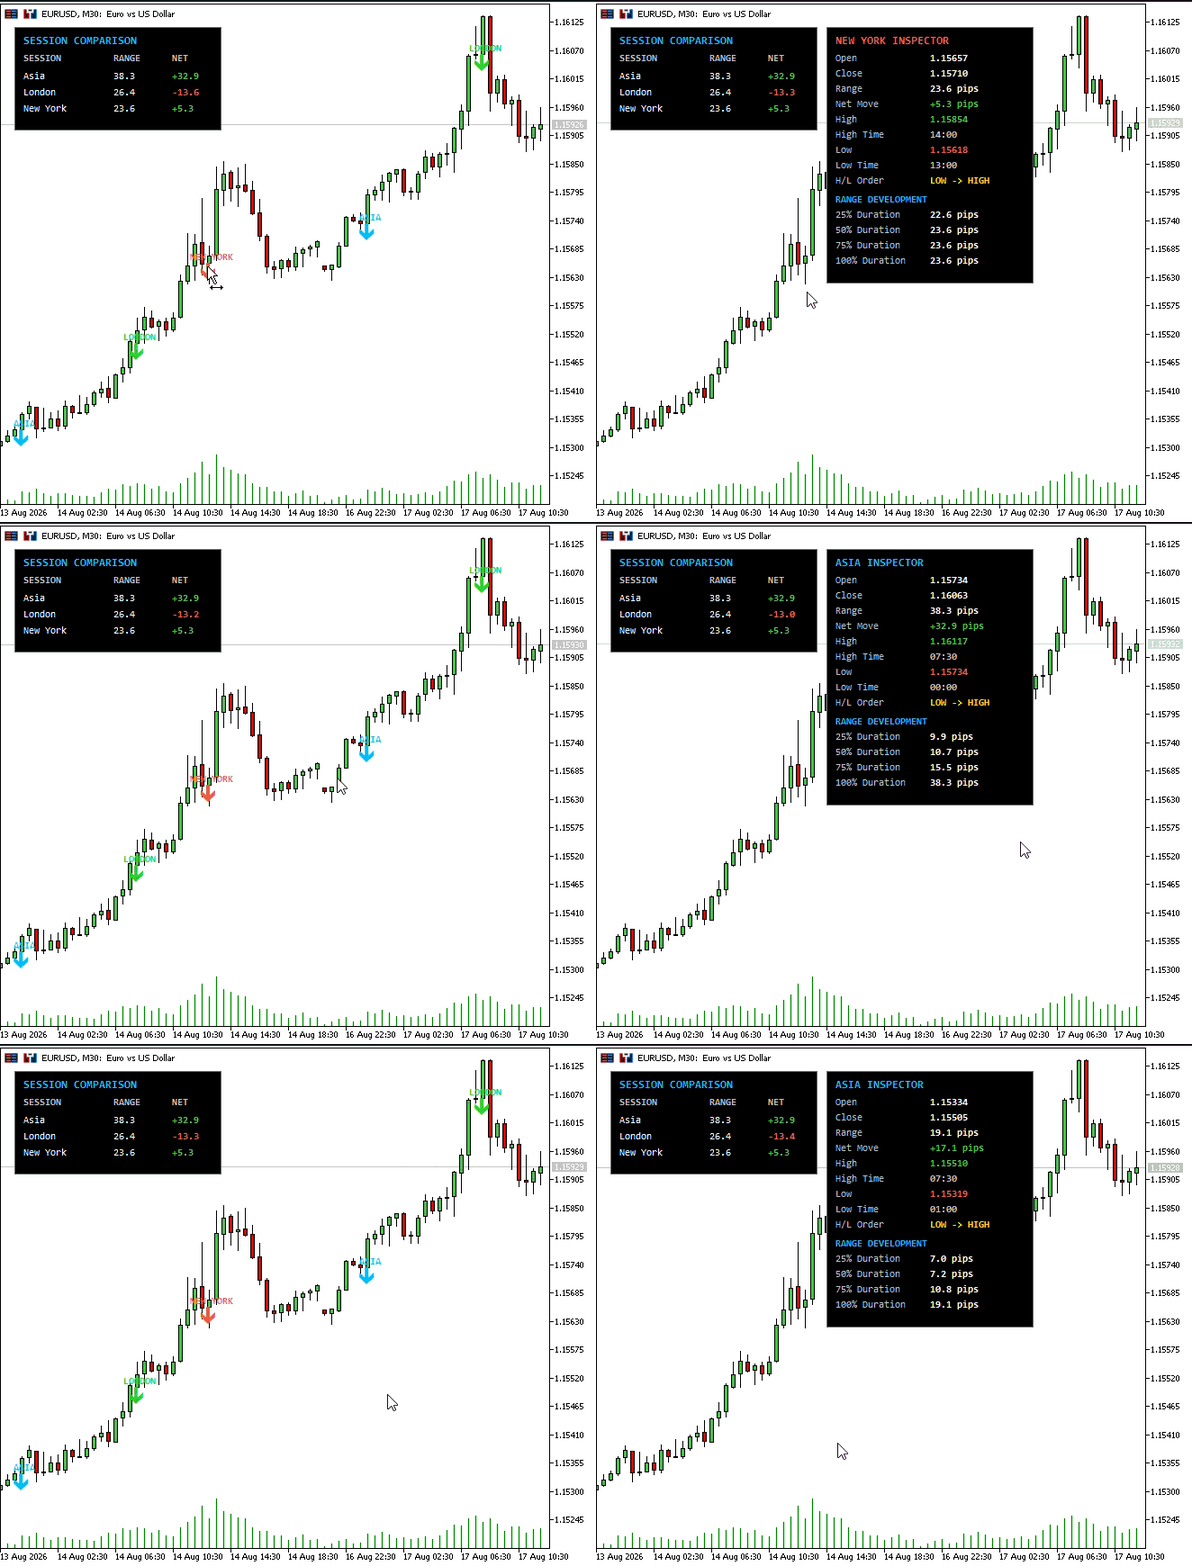
Fig. 2. Using the Indicator on the chart
The chart can also be moved into historical data for inspection. When automatic following is enabled, the analyzer resumes following the live edge when the chart is returned to the current market area.
Conclusion
In this first part, we established the foundation of a quantitative session analysis tool. Instead of treating a trading session as a visual time range alone, the analyzer converts each session into structured data containing its price characteristics and development measurements.
The tool can now identify sessions, measure their behavior, compare sessions from a common trading day, and provide an interactive view of individual occurrences directly on the chart. In future parts, we will build on this foundation by expanding the measurements collected from each session and introducing more ways to analyze the resulting data. We will examine session behavior across larger historical samples, add statistical comparisons, and develop additional metrics that can help reveal recurring characteristics.The goal is to evolve the tool from a measurement utility into a research framework for market-session analysis.
Warning: All rights to these materials are reserved by MetaQuotes Ltd. Copying or reprinting of these materials in whole or in part is prohibited.
This article was written by a user of the site and reflects their personal views. MetaQuotes Ltd is not responsible for the accuracy of the information presented, nor for any consequences resulting from the use of the solutions, strategies or recommendations described.

 How MQL5 Lite MCP AI Assistant Changed My Debugging Approach on Generated MQL5 Codes
 Creating and Testing a Council of 15 Models in MetaTrader 5
 Neural Networks in Trading: Robust Trading Signals in Any Market Regime (Conclusion)
 Overcoming Accessibility Problems in MQL5 Trading Tools (Part VII): MetaTrader 5 Model Context Protocol (MCP) the Grand Solution

- Free trading apps
- Over 8,000 signals for copying
- Economic news for exploring financial markets
You agree to website policy and terms of use