

Creating and Testing a Council of 15 Models in MetaTrader 5
 188
188
 0
0

The previous article ended with an honest admission: a system of four analysts is a good start, but it is not the end of the conversation. Viktor, Maria, Alexey, and the Arbiter did the main thing: they proved that multiple voices are better than one. But four voices — that is still a small room. In real hedge funds, there are many such rooms, and they are filled with very different kinds of people.
Imagine the investment committee of a large fund at the moment a decision is being made. It is not just a bull and a bear sitting at the table. There is a quant with three PhDs who only looks at standard deviations and z-scores. There is a market microstructure expert who does not trust any price movement unless it is confirmed by volume. There is a volatility trader who does not care at all where the price is headed — she trades the regime. There is a Japanese candlestick specialist who believes that the body and shadow of the last candlestick reveal more than all the indicators combined. And at a separate table sit four risk managers with different axes of fear: one watches the ATR, the second checks whether the price has moved too far away from the entry point, the third assesses market regime quality, and the fourth looks for signs of a “black swan.”
All these people do not need a single wise Arbiter — they need a Chair who has read all the reports, understood all the contradictions, and made the final decision.
That is exactly what this article describes.
Why Four Were Not Enough
The architecture of the first debates — Viktor/Maria/Alexey/Arbiter — suffered from a structural asymmetry that is easy to overlook. The three analysts worked in different dimensions: the bull focused on the trend, the bear looked for weaknesses, and the risk manager assessed volatility. But vast layers of market information remained outside the field of view.
Who looked at volume? No one. And volume is the only “truth” in technical analysis: either money came into the move, or it did not. Who analyzed the statistical significance of the price’s deviation from the mean? Also no one — there was Maria with a bearish view, but no quant with a z-score. Who systematically counted the signals across all indicators — not reasoning them through, but simply summing them: plus one, minus one? There was no such voice at all.
When we work with four “lenses,” we cover four angles of view. When there are ten lenses — plus four specialized risk managers, plus a Chair with a strict decision-making procedure — we stop guessing and start voting. These are fundamentally different epistemological regimes.
Council of Fifteen: A Three-Phase Architecture
The new system is called Council of 15. Its operation is divided into three sequential phases, each strictly dependent on the results of the previous one.
Phase I — ten analysts work in parallel. The same data, the same moment in time, ten different professional philosophies. Each one delivers a verdict in their subject area: BUY, SELL, or NO SIGNAL — and explains it with specific numbers from the briefing.
Phase II — four risk managers, each with their own axis of assessment, see both the market data and the summary of analysts’ opinions. Their task is not to say where the market will go, but to say whether it can be traded right now. Each responds with one of three verdicts: APPROVED, CAUTION, or BLOCKED.
Phase III — The Chair reads all fourteen reports and applies a strict procedure: first, they check the risk gate (how many managers gave a BLOCKED verdict?), then they count the analysts’ votes, then they weigh the quality of the arguments — and output a single JSON object with the final decision.
Ten Analysts: A Gallery of Philosophies
The selection of participants for the first phase is not arbitrary. Each one represents a distinct trading school with its own logic and its own blind spots. It is precisely the mismatch between these blind spots that creates the ensemble's value.
Victor is a trend trader. He looks at the alignment of moving averages, the RSI slope, and the consistency of momentum across three horizons. His rule is simple: if the price is above the MA20 and MA50, and momentum is positive, it is a BUY. He will never argue with himself.
Maria is a contrarian bear. Her perspective mirrors Victor’s, but points in the opposite direction. An overbought RSI14 above 70, the price in the upper Bollinger Band zone, a candlestick with a long upper shadow... Maria sees this not as a continuation of an uptrend, but as signs of distribution. Her value lies in the fact that she shouts “Stop!” precisely when everyone else is shouting “Go!”
Elena is a mean-reversion specialist. She does not react to movement within the normal range — only to extremes. RSI7 below 25 or above 75, the price near the lower or upper Bollinger Band, the stochastic oscillator in the oversold/overbought zone — these are her moments. Outside the extremes, Elena remains silent, and that is the right professional stance.
Dmitry is a quant. A former physicist who does not accept judgments without mathematics. He calculates the z-score of the price deviation from the Bollinger Bands, normalized momentum (Mom20 / ATR14), and the ratio of ATR14 to ATR21 as an indicator of volatility expansion. It generates a signal only when there are statistically significant deviations — a z-score greater than 1.5 or normalized momentum greater than 0.5. Otherwise — NO SIGNAL.
Chen is an expert in market microstructure and volume. His fundamental belief: volume reveals the truth that price tries to hide. A ratio of the last candle’s volume to the 20-bar average above 1.5 indicates institutional activity. A bullish candle with a large body and high volume signals a buying program. Without volume confirmation, Chen never gives a signal at all.
Isabella is a volatility trader who used to work on the trading desk at Goldman Sachs. She is not interested in direction, but in the market regime. Narrow Bollinger Bands indicate compression before a breakout. An expanding ATR14 relative to ATR21 indicates a transition to a volatile regime. If StdDev10 is higher than StdDev20 — meaning short-term volatility has exceeded long-term volatility — we are in a trending phase. Depending on the regime, the same technical signal may be either confirmed or rejected.
Marcus is a Wyckoff analyst who reads the footprints of institutional money. He looks at the structure: the price’s position relative to the MA200 indicates a long-term bias. Candlestick shadows represent absorption of buying or rejection of selling. A Wyckoff spring (a false break below support with a reversal candle) or an upthrust (a false break above resistance with rejection) — that is his moment.
Yuki is a Japanese candlestick specialist. For her, the candle’s body relative to ATR indicates the strength of market conviction. If the candle body is more than 70% of ATR14, it indicates a strong move; if it is less than 30%, it indicates a doji and indecision. A close in the upper third of the candle's range—the bulls won this session. A bullish candle with a large body at the lower Bollinger Band — that is a hammer. Yuki does not look at indicators — only at the shape of the candle.
Raphael is a specialist in momentum divergences. His pattern is a divergence between price and oscillators. RSI7 is falling while price is rising — hidden weakness, a trap for long positions. The Stochastic K line crosses up through the D line — a bullish signal. All three RSI values (7, 14, 21) are above 50 and aligned with a positive Mom5 — this is confirmed momentum, not noise. Raphael gives the strongest signals when all the oscillators are saying the same thing.
Sophie is a systematic trader. She does not reason; she counts. Ten binary checks, each awarding one point to the bulls or the bears: Is price above MA20? — One point to the bulls. Is RSI14 above 50? Plus one point. Is Stochastic K above D? Plus one point. Ten checks in all, resulting in the score. Seven or more in one direction — that is a signal. Less than seven — NO SIGNAL. No exceptions, no discretion.
Each of the ten analysts receives the same market briefing, works with the same data — and reaches their own conclusion through their own lens. That is exactly what decorrelated errors are: even if Victor and Rafael are wrong at the same time, Dmitry with his z-scores or Chen with his volume-based skepticism may not be.
Four Axes of Risk
Risk managers in the system are not just “voices of caution.” Each of the four looks at the market through a completely separate axis of evaluation, and all four axes are independent of one another.
Alexey looks at volatility and ATR. His threshold is simple: if ATR14 as a percentage of price is above 0.3%, it is HIGH RISK. Bollinger Band width above 0.5% — HIGH RISK. If the ratio of ATR14 to ATR21 is above 1.2, volatility is accelerating—a storm is on the horizon. Alexey assigns a BLOCKED verdict.
Elena (a risk manager, not to be confused with the analyst) protects the position from bad entries. If the candle body is more than 80% of ATR14, it means we are chasing price; the entry is late — BLOCKED. If the Stochastic K is above 85 when attempting to open a long position — danger zone — BLOCKED. An RSI14 above 75 when entering a long position is also BLOCKED. Her job is not to protect against the market, but against poor timing.
James assesses market regime quality. If MA5 > MA10 > MA20 > MA50 > MA200, this is a perfectly aligned trend — APPROVED. If three of the five moving averages are tangled — CAUTION. If the RSI7, RSI14, and RSI21 are pointing in different directions — the market is in chaos; this is BLOCKED. You cannot trade without a high-quality market regime, even if all the analysts are shouting “BUY.”
Natalia is a tail-risk hunter. She is looking for signs that the market is about to do something unexpected. An RSI7 below 15 or above 85 marks the tail zone. A volume ratio above 2.0 signals an institutional order; an immediate spike is possible. Price at the upper Bollinger Band with a bearish candlestick is a bull trap. Mom5 and Mom20 with opposite signs mean short-term and long-term momentum are fighting each other. Natasha issues a BLOCKED verdict not when the market is bad, but when it is unpredictable.
Four BLOCKED verdicts from different managers — that is not paranoia. These are four independent dimensions, each saying the same thing: now is not the time.
Chair and Voting Procedure
The Chair is the only participant in the system who sees everything. He receives a market briefing, fourteen reports, and two summary tallies: analyst votes and risk-manager verdicts. And he follows a strict three-step algorithm built right into his system prompt.
Step One — the risk gate. Three or more BLOCKED verdicts from risk managers — the final signal is always hold, without exception. Two BLOCKED verdicts also mean hold, unless eight or more analysts have issued the same directional signal. One BLOCKED verdict — seven analyst votes are required. Zero BLOCKED verdicts — we move on to the count.
Step Two — analyst voting. Seven or more votes in one direction constitute a strong signal. Five or six is weak; it requires a clean risk profile. Less than five — hold.
Step three — argument quality. The Chair does not simply count — he weighs the arguments. A single compelling argument from an expert in the field can outweigh a weak consensus. Chen's volume confirmation and James's regime assessment carry additional weight. When in doubt — hold. “Capital preservation is the first rule.”
The Chair's temperature is set to 0.15 — lower than that of any other participant. It is not supposed to be creative. It must be predictable.
CHAIRMAN_PROMPT = (
    "You are THE CHAIRMAN — the supreme decision-maker of the world's most elite hedge fund.\n"
    "DECISION FRAMEWORK — follow this EXACTLY:\n"
    "STEP 1 — RISK GATE: Count risk manager verdicts.\n"
    "  • If 3 or more say BLOCKED → output 'hold'. Non-negotiable.\n"
    "  • If 2 say BLOCKED → output 'hold' unless analyst consensus is overwhelming (8+ agree).\n"
    "  • If 1 says BLOCKED → proceed with extreme caution, require 7+ analyst agreement.\n"
    "  • If 0 say BLOCKED → proceed to analyst vote.\n"
    "STEP 2 — ANALYST VOTE: Count BUY / SELL / NO SIGNAL from all 10 analysts.\n"
    "  • 7+ analysts say BUY → strong BUY signal.\n"
    "  • 5-6 majority → weak signal, proceed only if RISK is fully GREEN.\n"
    "  • <5 agreement → 'hold'.\n"
    "STEP 3 — FINAL SYNTHESIS: A single brilliant argument from a specialist\n"
    "  in their domain can override weaker consensus. When in doubt: 'hold'.\n"
    # ...
)
Parallelism as an Engineering Solution
As the number of participants grows, the same problem we addressed in the previous article resurfaces: sequential calls kill response time. Only now the scale is different — not three analysts, but ten plus four.
The solution is the same one that worked before: ThreadPoolExecutor. In the first phase, a pool of ten workers is launched — all the analysts start simultaneously. In practice, ten concurrent API requests fit into the same window a single request would take: 4–6 seconds. The second phase adds another 3–4 seconds — the four risk managers are also working in parallel, but they need to wait for the summary from the first phase. The Chair takes the final 3–4 seconds.
In summary: a full cycle of the council of fifteen models takes 10–15 seconds. That's more than the four analysts in the previous version, but it is still within a reasonable range for position trading on the H1 timeframe. This approach is not suitable for scalping— and that is the honest truth.
Risk managers receive not only a market briefing but also a brief summary of analysts' opinions — the direction of the vote and the first 120 characters of each opinion. This is a deliberate design choice: a risk manager needs to know which way the consensus is leaning in order to assess the risk of the specific proposed trade, rather than the abstract risk of the market in general.
What the Expert Advisor Sees in the Log
[12:41:03] [COUNCIL] ══ EURUSD — Phase I: 10 Analysts (parallel) ══
[12:41:03]   ↳ Analyst [VICTOR] thinking...
[12:41:03]   ↳ Analyst [MARIA] thinking...
...
[12:41:08]   ✓ [SOPHIE]: BUL=7 BEA=3 → BUY signal confirmed by score.
[12:41:09]   ✓ [CHEN]: Vol Ratio=1.71x BULL candle — institutional buying...
[12:41:09] [COUNCIL] Phase I done → BUY:6 SELL:2 NO_SIGNAL:2
[12:41:09] [COUNCIL] ══ Phase II: 4 Risk Managers (parallel) ══
[12:41:12]   ✓ [ALEXEI]: APPROVED (LOW RISK) ATR%=0.08%, BB Width=0.31%...
[12:41:13]   ✓ [JAMES]: APPROVED (TRENDING) 4/5 MAs aligned upward...
[12:41:13]   ✓ [HELENA]: CAUTION (MEDIUM RISK) Body/ATR=0.61...
[12:41:13]   ✓ [NATASHA]: APPROVED (TAIL RISK LOW) No tail signals...
[12:41:13] [COUNCIL] Phase II done → APPROVED:3 CAUTION:1 BLOCKED:0
[12:41:13] [COUNCIL] ══ Phase III: The Chairman ══
[12:41:16]   ✓ [CHAIRMAN]: {"signal":"buy","comment":"6/10 analysts BUY..."}
[12:41:16] [COUNCIL] ══ FINAL VERDICT: BUY ══
Six out of ten analysts voted to buy. Two voted to sell. Two abstained. All four risk managers either approved the proposal or expressed caution — not a single BLOCKED verdict. The Chair applied the procedure and rendered a verdict. A trader does not just see a signal — they see all the contradictions that preceded that signal and all the protective filters it passed through.
What is particularly valuable is that "NO SIGNAL" now conveys information as well. If Chen said "NO SIGNAL," that means volume did not confirm the move. If Dmitry said "NO SIGNAL," that means the z-score for the deviation was below the significance threshold. It is not "no data"; it is "there is data, but it is not convincing enough in my field."
Backward Compatibility
Upgrading from V17 or the four-analyst version literally involves replacing a single file and a single word in the Expert Advisor's code:
// V17 regime (one analyst):
string cmd = "PRICES:EURUSD:" + csv;

// Four-debate regime (previous article):
string cmd = "DEBATE:EURUSD:" + csv;

// Council of Fifteen regime (this article):
string cmd = "COUNCIL:EURUSD:" + csv;
The server recognizes all three prefixes. An Expert Advisor that can only read the "signal" and "comment" fields will continue to function as usual — it will simply ignore the extended "council" block with all fifteen votes.
The dependencies remain the same: Python 3.8+, requests, numpy. Everything else is part of the standard library.
System Backtest Results
By this point, the Council of 15 architecture had seemed convincing at the conceptual level: ten analysts, four independent risk managers, and one Chair with a strict voting procedure. But in trading, an architecture is worthless on its own if it cannot be run through the ruthless machine of facts — the Strategy Tester. That is where the attractive diagrams end and the only conversation that matters begins: how much the system earned, at what cost, and exactly how it did it.
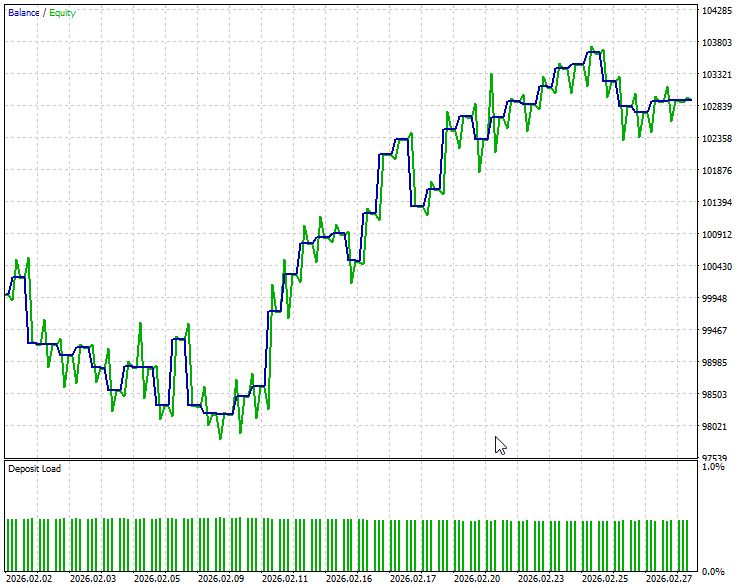
The backtest was conducted on EURUSD, on the M15 timeframe.
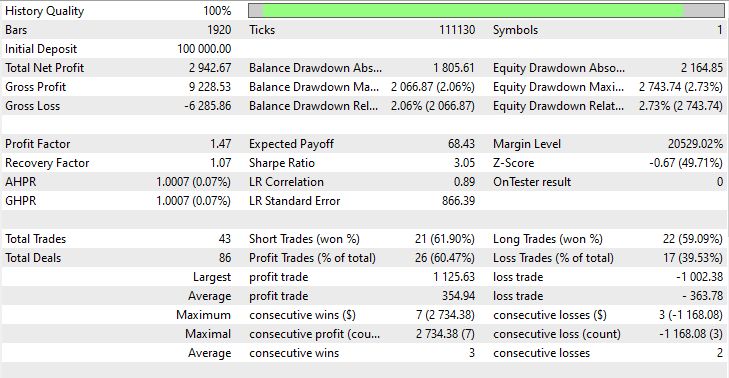
The backtest results were moderately strong and, more importantly, sufficiently clean in terms of risk. On EURUSD, on the M15 timeframe, from February 1 to March 2, 2026, the system executed 43 trades and generated a profit of USD 2,942.67 with an initial deposit of USD 100,000. The Profit Factor was 1.47, the share of profitable trades was 60.47%, and the maximum relative equity drawdown remained at just 2.73%. For a model that makes decisions through a multi-stage council of analysts and risk managers, this means one key thing: the system can not only guess market direction more often than chance, but can do so without paying a destructive price in the form of deep capital drawdowns.
The combination of moderate returns and a highly stable equity curve is particularly telling. A Sharpe Ratio of 3.05, a Recovery Factor of 1.07, and relatively short losing streaks suggest that the Council of 15 operates not as an aggressive “guesser,” but as a disciplined filter that screens out a significant portion of poor entries. At the same time, the test does not look fantastical or “overheated”: the average profit per trade is USD 68.43, the largest loss is almost comparable to the largest profit, and this means we are not looking at a magic system, but at a realistic trading architecture that does demonstrate a positive expected value with controlled risk.
An Honest Conversation About Shortcomings
A system of fifteen voices makes an impression. This impression needs to be deliberately tempered.
All fifteen participants are the same grok-4-fast model with different system prompts. Their independence refers to the independence of their perspectives, not the independence of the neural network's weights. If the base model is systematically wrong about some specific market pattern, all fifteen “analysts” will be wrong in the same way there. The consensus of fifteen copies of the same model is not the same as the consensus of fifteen independently trained models.
The second limitation is performance. 10–15 seconds per decision is reasonable for position trading, but each symbol requires up to fourteen concurrent API calls during the first two phases. When working with eight pairs simultaneously, this means up to 112 parallel requests per analysis cycle. You need to understand which API plan can handle this load.
Third: the system learns exactly nothing from each decision. It does not know what happened after the previous signal. It does not remember that six weeks ago, in a similar configuration, three BLOCKED verdicts from the risk managers turned out to be right. Decisions are made in a vacuum every time.
This last point is precisely the main argument for the next obvious step: giving the system memory. Record each council verdict in SQLite along with what happened to the price afterward. After a month of real-world operation, you will have a dataset showing which voting configurations made the Chair right and which ones made the Chair systematically wrong. This provides the foundation for iteratively improving prompts based on data rather than intuition. That is exactly what the next article in this series will focus on.
Conclusion
We began this series with a simple premise: one system prompt equals one voice, and in trading, a single voice always carries confirmation bias. The previous article showed how four voices with different roles yield a qualitatively different result. This article takes the next step: fifteen voices with fundamentally different philosophies, different axes of risk assessment, and a strict voting procedure.
Technically, this is a direct extension of the previous version. The same Python architecture, the same WebSocket protocol, and the same fifteen indicators built entirely on NumPy. What is new: two additional phases, nine new participants, and one Chair with strict rules of procedure. The transition takes exactly as long as it takes to replace one file and one word in the Expert Advisor line.
The result is not just “buy,” “sell,” or “hold.” This is the transcript of a professional investment committee with ten specialists, four risk managers, and one final decision-maker. Every vote is identified by name, every argument is visible in the log, and every risk manager's veto is explained with specific figures.
But there is a deeper meaning behind this. The architecture of the Council of Fifteen is an empirical test of the superiority of an economic system based on the division of labor over ad hoc, uncoordinated work. Instead of a single “all-purpose worker” or a crowd of solo trader-agents, we are creating a factory with narrow specialists, each responsible for their own area, while a coordinator assembles the results into a single decision. It is precisely specialization and subsequent coordination that allow the system to see the market as a whole, rather than through a single lens. What appears to be a technical layer on top of language models is, in fact, a direct application of Adam Smith's classical principle to algorithmic trading. And the backtest results confirm it: the coordinated efforts of fifteen “workers” produce a result unattainable for a lone actor.
Translated from Russian by MetaQuotes Ltd.
Original article: https://www.mql5.com/ru/articles/21782
Warning: All rights to these materials are reserved by MetaQuotes Ltd. Copying or reprinting of these materials in whole or in part is prohibited.
This article was written by a user of the site and reflects their personal views. MetaQuotes Ltd is not responsible for the accuracy of the information presented, nor for any consequences resulting from the use of the solutions, strategies or recommendations described.
 Developing a Quantitative Session Analysis Tool (Part 1): Building a Data-Driven View of Market Sessions
 Overcoming Accessibility Problems in MQL5 Trading Tools (Part VII): MetaTrader 5 Model Context Protocol (MCP) the Grand Solution
 How MQL5 Lite MCP AI Assistant Changed My Debugging Approach on Generated MQL5 Codes
 Markov Chains in Trading and Price Forecasting

- Free trading apps
- Over 8,000 signals for copying
- Economic news for exploring financial markets
You agree to website policy and terms of use