

Interactive Supply and Demand Zone Manager in MQL5 (Part IV): Trading Supply and Demand Zones
 1 260
1 260
 0
0

Introduction
In Part III of this series, the supply and demand framework was extended beyond simple zone detection by introducing quantitative evaluation, lifecycle management, and structured interaction monitoring. Zones were no longer treated as static chart objects, but as dynamic market structures capable of gaining, losing, and changing relevance over time. However, identifying a high-quality zone is only one part of the trading process; a strong supply or demand area does not automatically represent an executable opportunity. Market context determines whether price rejects the zone, breaks through it, or retests it from the opposite direction.
This introduces a new challenge: transforming structural information into a controlled decision process. In this phase, the framework is extended with a dedicated strategy layer that acts as a bridge between zone analysis and trade execution. Instead of triggering an entry on a zone touch, the strategy evaluates the full interaction sequence. The strategy combines zone quality, approach behavior, higher-timeframe alignment, and price action confirmation into a validation pipeline. Only then does it generate a trade request.The objective is not to assume that every zone behaves identically. Instead, the goal is a modular architecture with configurable rules. Execution logic remains isolated and replaceable.
The final component of this architecture is a dedicated trade manager responsible for handling order execution. By separating decision-making from trade operations, the system becomes easier to maintain, test, and extend with additional entry models, risk controls, or future analytical components.
Architectural Focus in This Phase
This phase marks the transition from market analysis to decision architecture. While previous stages focused on identifying and monitoring meaningful supply and demand structures, this phase defines how those structures are evaluated before becoming trading actions.
The architecture is divided into three independent responsibilities:
- Zone Analysis Layer: The existing zone engine remains responsible for detecting, scoring, and managing market structures. It provides the strategy layer with data such as zone location, boundaries, structural quality scores, lifecycle states, breakout/pending statuses, and interaction history. The strategy module consumes this information without modifying it, evaluating whether current conditions justify an entry.
- Strategy Decision Layer: The strategy module introduces a sequential evaluation process that validates zone qualifications, confirms price interaction, classifies approach behavior, verifies higher-timeframe conditions, and confirms price action confirmation patterns. Each stage acts as a filter, reducing trade entries based on incomplete information.
- Execution Layer: Once a valid signal passes the decision pipeline, execution is delegated to the trade manager module. This separation prevents order-handling logic from becoming tightly coupled with analytical logic.
This design allows the framework to evolve beyond a single trading approach. New analytical filters, alternative entry models, or advanced risk-management systems can be introduced without requiring major changes to the underlying supply and demand framework.
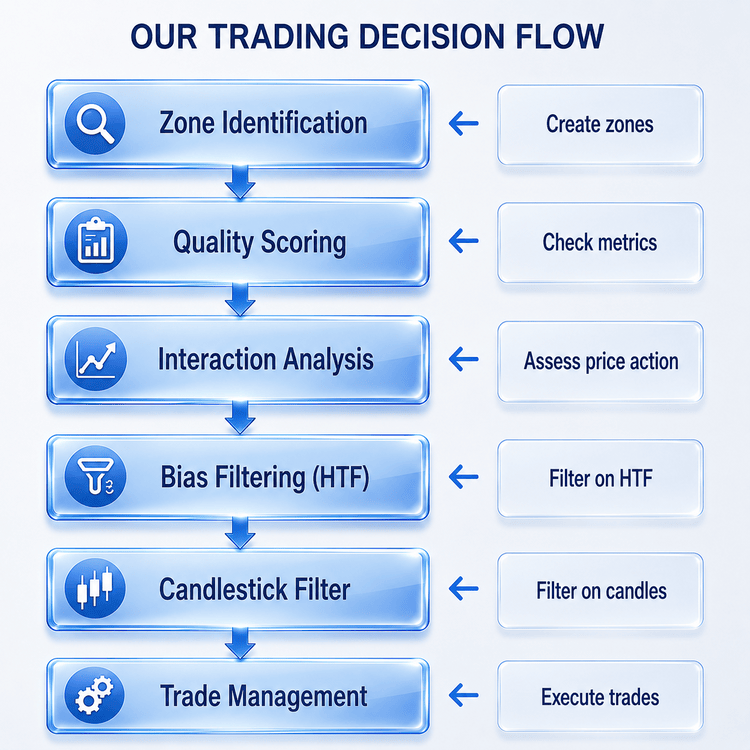
Fig 1. Strategy decision flow
Why Zone Detection Alone Is Insufficient
A supply and demand zone represents an area where significant market activity previously occurred. Detecting these areas provides valuable structural information, but structure alone does not define a complete trading decision. Treating a zone touch as a binary entry condition ignores the crucial context surrounding the interaction.
The same zone can produce different outcomes depending on how price approaches it. For example, a resistance zone approached by a slow and controlled bullish movement may produce a rejection as sellers defend the level. However, the same resistance zone approached through strong directional expansion may result in a breakout, as aggressive buying pressure absorbs available supply.
To distinguish between these scenarios, the strategy evaluates several factors before considering a structure a valid trading opportunity:
- Zone Quality: A recently detected structure with strong scoring characteristics carries different significance compared to a weak or degraded zone.
- Interaction State: A first approach, a tested zone, and a broken structure represent entirely different market conditions.
- Approach Behavior: Price momentum and directional pressure before reaching the zone indicate whether the market is showing strength, exhaustion, or potential continuation.
- Higher-Timeframe Context: A lower-timeframe reaction may have limited significance if it conflicts with the broader market direction.
- Price Action Confirmation: The immediate response inside the zone provides evidence that buyers or sellers are actively defending the area.
Separating identification from decision-making prevents the system from reacting mechanically to every zone interaction, establishing a more controlled execution process.
Architectural Perspective
This implementation focuses on the architecture of a modular trading pipeline rather than on defining a complete trading methodology. Instead of presenting a production-ready strategy, it illustrates how independent validation stages can be composed into a structured decision process. Although the framework supports both automatically generated and user-defined zones, the trading pipeline evaluates only automatically qualified zones. User-defined zones remain managed by the framework. However, the pipeline excludes them from automated decisions until they pass a separate qualification process. Each module intentionally relies on lightweight deterministic logic, making it straightforward to refine, replace, or extend individual components while preserving the overall architecture.
Strategy Architecture
The strategy module provides the decision layer that bridges the existing supply and demand framework with automated trade execution. Rather than generating trades directly from every zone interaction, it evaluates each qualified candidate through a sequence of independent validation stages before producing an execution request. The module receives structural information from the zone management framework but does not create zones, modify their lifecycle state, or manage order execution. This separation of responsibilities allows each component of the framework to remain modular, maintainable, and independently extensible.
Before examining the decision pipeline, we introduce the configuration parameters added in this part of the series. These inputs control the behavior of the strategy layer, allowing higher-timeframe confirmation, market approach classification, risk management, and trade execution settings to be adjusted without modifying the implementation. Since the previous parts already established the underlying zone management framework, only the additional parameters required by the trading strategy are presented here.
input group "--- Part IV Automation Framework Switches ---"
input bool     CheckTradingSignals   = true;        // Enable automated execution signals
input ulong    MagicNumber           = 123456;      // EA Magic Number
input double   LotSize               = 0.10;        // Lot size

input group "--- Risk & Spread Protection ---"
input int      MaxSpreadPoints       = 30;          // Maximum tolerated spread (points)
input double   RiskRewardRatio       = 2.0;         // Strategy mathematical target multiplier
input double   ATRBufferMultiplier   = 1.5;         // Structural volatility invalidation cushion

input group "--- Trailing Stop Settings ---"
input bool     UseTrailingStop       = true;        // Enable Trailing Stops
input double   TrailingStartPips     = 15.0;        // Minimum pips gained to activate trailing layer
input double   TrailingStepPips      = 5.0;         // Trailing step distance adjustments

input group "--- HTF Trend Filter Parameters ---"
input bool            InpUseHTFFilter       = true;       // Enable Higher Timeframe Trend Filter
input ENUM_TIMEFRAMES InpHtfTimeframe       = PERIOD_H1;  // HTF Trend Timeframe
input int             InpHtfMaPeriod        = 50;         // HTF Trend EMA Period
input bool            InpUseHTFRsiFilter    = true;       // Enable HTF RSI Exhaustion Filter
input int             InpHtfRsiPeriod       = 14;         // HTF RSI Period
input double          InpHtfRsiOverbought   = 70.0;       // HTF RSI Overbought Threshold
input double          InpHtfRsiOversold     = 30.0;       // HTF RSI Oversold Threshold

input group "--- Approach Context Parameters"
input int             InpApproachBars     = 3;           // Bars Evaluated Before Touch (1-5)
input double          InpApproachThreshold = 1.5;        // Aggressive Sprint Threshold (ATR Mult)
With the strategy configuration in place, we can now examine how these parameters are used throughout the evaluation process. Every qualified zone progresses through a deterministic sequence of validation stages, with each stage answering a specific question before allowing the evaluation to continue. If a candidate fails any validation step, processing terminates immediately, ensuring that subsequent analysis is performed only on candidates that satisfy the required conditions.
The evaluation pipeline consists of the following progressive stages:
- Zone qualification gate
- Interaction validation
- Market approach classification
- Higher-timeframe confirmation
- Price action confirmation
- Trade delegation
Only after all validation stages have been successfully completed is control passed to the trade manager, which assumes responsibility for order execution and subsequent trade management.
Strategy Class Overview
Following the zone monitoring and lifecycle framework introduced earlier, the strategy evaluation stage is handled through the CZoneStrategy class. This component provides the link between an already identified zone interaction and the decision pipeline responsible for evaluating trade conditions.
The CZoneStrategy class encapsulates the strategy logic, maintaining its own configuration parameters, exposing a single public evaluation interface, and delegating supporting analytical tasks to private helper functions. Rather than controlling zone discovery or lifecycle management, the strategy module focuses only on evaluation. The surrounding framework remains responsible for maintaining zone state, while CZoneStrategy processes eligible candidates through a structured sequence of validation, contextual analysis, and trade qualification steps.
This organisation keeps the decision pipeline self-contained while allowing the main framework to interact with the strategy through a single controlled entry point.
//+------------------------------------------------------------------+ //| Analytical Filter Strategy Module | //+------------------------------------------------------------------+ class CZoneStrategy { private: double min_zone_score; int bounce_closes; double risk_reward; double atr_buffer_mult; //--- HTF Trend Filter Configuration bool use_htf_filter; ENUM_TIMEFRAMES htf_timeframe; int htf_ma_period; //--- HTF RSI Exhaustion Filter Configuration bool use_htf_rsi_filter; int htf_rsi_period; double htf_rsi_overbought; double htf_rsi_oversold; //--- Context Analysis Parameter Configurations int approach_lookback_bars; // Number of bars to evaluate before zone touch double approach_velocity_threshold; // ATR multiplier threshold for momentum sprint //--- Internal Private Verification Paths bool VerifyBullishRejection(const MqlRates &bar, double zone_bottom); bool VerifyBearishRejection(const MqlRates &bar, double zone_top); //--- Proximity Gate Check bool ValidateZoneInteraction(double z_top, double z_bottom, double cached_atr, const MqlRates ¤t_bar); //--- Context Analyzer: Deciphers aggressive momentum sprint vs. casual exhaust ENUM_APPROACH_CONTEXT EvaluateApproachContext(const MqlRates &rates[], const double cached_atr); //--- HTF Bias & Exhaustion Checker bool CheckHTFBias(bool bullish); //--- Price Action Mathematical Core bool IsPinBarBullish(const MqlRates &b); bool IsPinBarBearish(const MqlRates &b); bool IsBullishEngulfing(const MqlRates &p, const MqlRates &c); bool IsBearishEngulfing(const MqlRates &p, const MqlRates &c); public: CZoneStrategy(const double min_score, const int confirm_closes, const double rr, const double atr_mult, const bool use_htf, const ENUM_TIMEFRAMES htf_tf, const int htf_ma, const bool use_htf_rsi, const int htf_rsi_len, const double htf_rsi_ob, const double htf_rsi_os, const int approach_bars, const double approach_threshold); ~CZoneStrategy(void); bool EvaluateSingleZoneSignal(CTradeManager *trade_manager, const double cached_atr, string z_name, int z_type, double z_top, double z_bottom, bool z_is_broken, bool z_is_pending, double z_current_score, bool z_buy_triggered, bool z_sell_triggered); };
The constructor receives the configuration parameters introduced earlier and stores them within the strategy instance, allowing the evaluation pipeline to operate using the user-defined settings throughout its lifetime.
//+------------------------------------------------------------------+
//| Constructor                                                      |
//+------------------------------------------------------------------+
CZoneStrategy::CZoneStrategy(const double min_score,
                             const int confirm_closes,
                             const double rr,
                             const double atr_mult,
                             const bool use_htf,
                             const ENUM_TIMEFRAMES htf_tf,
                             const int htf_ma,
                             const bool use_htf_rsi,
                             const int htf_rsi_len,
                             const double htf_rsi_ob,
                             const double htf_rsi_os,
                             const int approach_bars,
                             const double approach_threshold)
   :
   min_zone_score(min_score),
   bounce_closes(confirm_closes),
   risk_reward(rr),
   atr_buffer_mult(atr_mult),

//--- HTF FILTER SETTINGS
   use_htf_filter(use_htf),
   htf_timeframe(htf_tf),
   htf_ma_period(htf_ma),

//--- HTF RSI FILTER SETTINGS
   use_htf_rsi_filter(use_htf_rsi),
   htf_rsi_period(htf_rsi_len),
   htf_rsi_overbought(htf_rsi_ob),
   htf_rsi_oversold(htf_rsi_os),

//--- CONTEXT ANALYSIS SETTINGS
   approach_lookback_bars(approach_bars),
   approach_velocity_threshold(approach_threshold)
  {

  }
Zone Qualification Gate
Before evaluating market behavior, the strategy determines whether the zone itself is still eligible for consideration. Not every zone remain equally relevant throughout its lifecycle. A zone that has lost structural quality, completed its interaction cycle, or no longer satisfied framework requirements is filtered out immediately.
The initial validation layer is performed at the beginning of EvaluateSingleZoneSignal(). Before any market context analysis, price action validation, or higher-timeframe filtering occurs, the strategy confirms that the required execution dependencies exist and that the zone remains valid for evaluation.
The qualification stage checks two primary conditions:
- Trade Manager & Volatility Validation: The strategy requires a valid trade manager instance before continuing. Additionally, Average True Range (ATR) validation is performed because later calculations depend on volatility-adjusted measurements, including interaction tolerance, stop-loss distance, and risk calculations. Without valid volatility data, the strategy cannot reliably evaluate the environment.
- Pending State & Score Validation: A zone becomes eligible for strategy evaluation only after entering the pending state established by the monitoring framework introduced in Part III. This creates a controlled handoff between zone lifecycle management and trade evaluation. The strategy also evaluates the current operational score rather than only the original creation score, allowing lifecycle changes such as time decay, repeated interactions, and weakening market responses to influence eligibility.
//+------------------------------------------------------------------+
//| Main Strategy Pipeline                                           |
//+------------------------------------------------------------------+
bool CZoneStrategy::EvaluateSingleZoneSignal(CTradeManager *trade_manager,
      const double cached_atr,
      string z_name,
      int z_type,
      double z_top,
      double z_bottom,
      bool z_is_broken,
      bool z_is_pending,
      double z_current_score,
      bool z_buy_triggered,
      bool z_sell_triggered)

  {
//--- 1. TRADEMANAGER VALIDATION
   if(trade_manager==NULL || cached_atr<=0)
      return false;

//--- 2. ZONE HEALTH VALIDATION
   if(!z_is_pending || z_current_score < min_zone_score)
      return false;

//--- 3. COPY RATES
   MqlRates rates[];
   ArraySetAsSeries(rates,true);

   if(CopyRates(_Symbol,_Period,0,approach_lookback_bars+2,rates)<(approach_lookback_bars+2))
      return false;

//--- 4. VALIDATE ZONE INTERACTION GATE (Exit early if price is nowhere near)
   if(!ValidateZoneInteraction(z_top, z_bottom, cached_atr, rates[0]))
      return false;

//--- 5. EVALUATE APPROACH CONTEXT
   ENUM_APPROACH_CONTEXT approach_context = EvaluateApproachContext(rates, cached_atr);


//+------------------------------------------------------------------+
//| CASE 1: SUPPORT ZONE PROCESSING                                  |
//+------------------------------------------------------------------+
   if(z_type==0)
     {
      //--- SCENARIO A: CASUAL / CONSERVATIVE APPROACH (Expect Reversal Bounce)
      if(approach_context == APPROACH_BEARISH_CONSERVATIVE || approach_context == APPROACH_NEUTRAL)
        {
         if(z_is_broken || z_buy_triggered)
            return false;

         if(!CheckHTFBias(true))
            return false;

         if(VerifyBullishRejection(rates[1], z_bottom))
           {
            double entry_price=SymbolInfoDouble(_Symbol,SYMBOL_ASK);
            double sl_distance=(z_top-z_bottom)+(cached_atr*atr_buffer_mult);
            double sl=entry_price-sl_distance;
            double tp=entry_price+(sl_distance*risk_reward);

            string comment=StringFormat("SR4_REVERSAL_BUY_%s",z_name);

            if(trade_manager.ExecuteBuy(_Symbol,entry_price,sl,tp,comment))
              {
               PrintFormat(">>> [REVERSAL BOUNCE BUY] Zone: %s",z_name);
               return true;
              }
           }
        }
      //--- SCENARIO B: AGGRESSIVE SPRINT (Expect Breakout Pullback Sell)
      else
         if(approach_context == APPROACH_BEARISH_AGGRESSIVE)
           {
            if(!z_is_broken || z_sell_triggered)
               return false;

            if(!CheckHTFBias(false))
               return false;

            if(VerifyBearishRejection(rates[1], z_top))
              {
               double entry_price=SymbolInfoDouble(_Symbol,SYMBOL_BID);
               double sl_distance=(z_top-z_bottom)+(cached_atr*atr_buffer_mult);
               double sl=entry_price+sl_distance;
               double tp=entry_price-(sl_distance*risk_reward);

               string comment=StringFormat("SR4_BREAKOUT_SELL_%s",z_name);

               if(trade_manager.ExecuteSell(_Symbol,entry_price,sl,tp,comment))
                 {
                  PrintFormat(">>> [BREAKOUT PULLBACK SELL] Zone: %s",z_name);
                  return true;
                 }
              }
           }
     }

//+------------------------------------------------------------------+
//| CASE 2: RESISTANCE ZONE PROCESSING                               |
//+------------------------------------------------------------------+
   else
      if(z_type==1)
        {
         //--- SCENARIO A: CASUAL / CONSERVATIVE APPROACH (Expect Reversal Bounce)
         if(approach_context == APPROACH_BULLISH_CONSERVATIVE || approach_context == APPROACH_NEUTRAL)
           {
            if(z_is_broken || z_sell_triggered)
               return false;

            if(!CheckHTFBias(false))
               return false;

            if(VerifyBearishRejection(rates[1], z_top))
              {
               double entry_price=SymbolInfoDouble(_Symbol,SYMBOL_BID);
               double sl_distance=(z_top-z_bottom)+(cached_atr*atr_buffer_mult);
               double sl=entry_price+sl_distance;
               double tp=entry_price-(sl_distance*risk_reward);

               string comment=StringFormat("SR4_REVERSAL_SELL_%s",z_name);

               if(trade_manager.ExecuteSell(_Symbol,entry_price,sl,tp,comment))
                 {
                  PrintFormat(">>> [REVERSAL BOUNCE SELL] Zone: %s",z_name);
                  return true;
                 }
              }
           }
         //--- SCENARIO B: AGGRESSIVE SPRINT (Expect Breakout Pullback Buy)
         else
            if(approach_context == APPROACH_BULLISH_AGGRESSIVE)
              {
               if(!z_is_broken || z_buy_triggered)
                  return false;

               if(!CheckHTFBias(true))
                  return false;

               if(VerifyBullishRejection(rates[1], z_bottom))
                 {
                  double entry_price=SymbolInfoDouble(_Symbol,SYMBOL_ASK);
                  double sl_distance=(z_top-z_bottom)+(cached_atr*atr_buffer_mult);
                  double sl=entry_price-sl_distance;
                  double tp=entry_price+(sl_distance*risk_reward);

                  string comment=StringFormat("SR4_BREAKOUT_BUY_%s",z_name);

                  if(trade_manager.ExecuteBuy(_Symbol,entry_price,sl,tp,comment))
                    {
                     PrintFormat(">>> [BREAKOUT PULLBACK BUY] Zone: %s",z_name);
                     return true;
                    }
                 }
              }
        }

   return false;
  }
This early filtering stage reduces unnecessary processing by ensuring that later analytical stages operate only on active and sufficiently qualified zone candidates.
Interaction Validation
Price does not always respect exact boundaries; market volatility, spread conditions, and temporary fluctuations can cause interactions to occur slightly outside the original zone limits. For this reason, the strategy introduces a dedicated interaction validation layer using a volatility-adjusted proximity cushion.
- Current Price Location: The strategy utilizes the candle close rather than an isolated tick movement because the decision pipeline is based on completed market information. This reduces the possibility of reacting to temporary price fluctuations that disappear before the candle completes.
- ATR-Based Interaction Buffer: Instead of requiring price to enter exact zone boundaries, the strategy expands the interaction region by half of the current ATR value. During periods of low volatility, the interaction tolerance remains smaller, while higher volatility expands the allowed approach distance accordingly.
If price is either inside the zone or within the calculated tolerance, the validation succeeds and allows the pipeline to continue. If it fails, the zone is ignored for the current cycle, preventing unnecessary processing.
Architectural Note
ValidateZoneInteraction() represents the boundary between zone availability and active market participation. The current implementation provides a lightweight, deterministic interaction model using ATR-normalized proximity. This keeps the strategy efficient while allowing the interaction threshold to adapt to changing volatility conditions. A production implementation could extend this layer. For example: spread-adjusted distance, multi-stage approach detection, tick-level tracking, separate entry/confirmation zones, and instrument-specific volatility behavior.
The current design intentionally keeps interaction validation independent from trade logic, allowing more advanced interaction models to be introduced without changing the rest of the strategy pipeline.
//+------------------------------------------------------------------+ //| Zone Interaction Gate Check | //+------------------------------------------------------------------+ bool CZoneStrategy::ValidateZoneInteraction(double z_top, double z_bottom, double cached_atr, const MqlRates ¤t_bar) { double current_price = current_bar.close; double buffer = cached_atr * 0.5; // 0.5 ATR execution tolerance cushion //--- Is the current price inside the zone boundaries or within the ATR-based proximity tolerance? if(current_price >= (z_bottom - buffer) && current_price <= (z_top + buffer)) { return true; } return false; }
Market Approach Classification
The market approach classification system determines what forces are present during a zone interaction. The purpose is to categorize incoming market behavior into bullish aggressive, bullish conservative, bearish aggressive, bearish conservative, or neutral conditions before deciding how the zone should be treated.
The framework measures directional pressure using several observations:
- Directional candle closes
- Consecutive movement sequences
- Overall displacement
- Volatility-normalized movement strength
By normalizing total price displacement against the ATR, the system avoids treating all market movements equally. A conservative approach represents controlled movement with smaller candles and reduced momentum, making it suitable for reversal opportunities. An aggressive approach represents stronger market participation with large consecutive directional closes, allowing the strategy to consider continuation or breakout scenarios instead.
Architectural Note
EvaluateApproachContext() introduces behavioral classification into the decision pipeline. The current implementation provides a deterministic method for separating different approach profiles using price structure and volatility normalization. This creates a more flexible framework than a simple zone-touch model because market conditions are considered before execution. For a production-level implementation, this component would likely require further development, including adaptive thresholds based on historical behavior, instrument-specific calibration, statistical evaluation of approach patterns, and additional market regime classification. The current architecture provides the foundation for contextual decision-making while maintaining a clear separation between structural zone analysis and trading execution logic.
//+------------------------------------------------------------------+
//| Deciphers structure-based market context and directional flow    |
//+------------------------------------------------------------------+
ENUM_APPROACH_CONTEXT CZoneStrategy::EvaluateApproachContext(const MqlRates &rates[], const double cached_atr)
  {
//--- Safeguard array size bounds check
   if(ArraySize(rates) < (approach_lookback_bars + 1))
      return APPROACH_NEUTRAL;

   int bullish_closes = 0;
   int bearish_closes = 0;
   double total_displacement = rates[1].close - rates[approach_lookback_bars].open;

//--- Measure structural direction and candle overlap metrics
   for(int i = 1; i <= approach_lookback_bars; i++)
     {
      //--- Bullish pressure check
      if(rates[i].close > rates[i].open && rates[i].close > rates[i+1].close)
         bullish_closes++;

      //--- Bearish pressure check
      else
         if(rates[i].close < rates[i].open && rates[i].close < rates[i+1].close)
            bearish_closes++;
     }

//--- Normalize structural displacement value by volatility
   double normalized_displacement = MathAbs(total_displacement) / (cached_atr > 0 ? cached_atr : 1.0);

//--- Evaluate direction bias and calculate the approach profiles
   if(bullish_closes > bearish_closes)
     {
      //--- Strong displacement with consecutive control confirms aggression
      if(normalized_displacement > approach_velocity_threshold)
         return APPROACH_BULLISH_AGGRESSIVE;

      return APPROACH_BULLISH_CONSERVATIVE;
     }
   else
      if(bearish_closes > bullish_closes)
        {
         if(normalized_displacement > approach_velocity_threshold)
            return APPROACH_BEARISH_AGGRESSIVE;

         return APPROACH_BEARISH_CONSERVATIVE;
        }

   return APPROACH_NEUTRAL;
  }
Higher-Timeframe Confirmation
The higher-timeframe confirmation filter prevents lower-timeframe setups from being executed when they are strongly misaligned with the larger market context. It utilizes two optional confirmation methods:
- Higher-Timeframe EMA Alignment: Evaluates whether price position agrees with the intended trade direction. A buy setup requires the higher-timeframe price to remain above the selected moving average, while a sell setup requires it to remain below it.
- RSI Exhaustion Filtering: Provides additional protection by identifying overstretched conditions. It helps prevent opening new positions when the macro movement may already be exhausted.
Architectural Note
CheckHTFBias() introduces broader market context into the decision pipeline while remaining independent from the zone framework and execution layer. The current implementation provides a configurable higher-timeframe filter that can approve or reject lower-timeframe opportunities without changing the underlying zone logic. For production-level development, this component could be extended with additional regime analysis, multi-timeframe agreement, or adaptive trend evaluation. The current design keeps higher-timeframe validation modular, allowing additional confirmation methods to be introduced without restructuring the strategy architecture.
//+------------------------------------------------------------------+
//| HTF Moving Average Direction & RSI Exhaustion Filter             |
//+------------------------------------------------------------------+
bool CZoneStrategy::CheckHTFBias(bool bullish)
  {
//--- Bypass evaluation completely if user has deactivated HTF Trend Filtering
   if(!use_htf_filter)
      return true;

//--- 1. TREND DIRECTIONAL FILTER (EMA CHECK)
   int ma_handle=iMA(_Symbol,
                     htf_timeframe,
                     htf_ma_period,
                     0,
                     MODE_EMA,
                     PRICE_CLOSE);

   if(ma_handle==INVALID_HANDLE)
     {
      PrintFormat("[HTF WARNING] Failed to obtain EMA handle for %s. Bypassing filter.", EnumToString(htf_timeframe));
      return true;
     }

   double ma_buffer[];
   ArraySetAsSeries(ma_buffer,true);

   if(CopyBuffer(ma_handle,0,0,2,ma_buffer)<2)
     {
      IndicatorRelease(ma_handle);
      return true;
     }

   double htf_price=iClose(_Symbol,htf_timeframe,0);
   IndicatorRelease(ma_handle);

//--- Evaluate simple trend orientation
   bool trend_aligned = bullish ? (htf_price > ma_buffer[0]) : (htf_price < ma_buffer[0]);
   if(!trend_aligned)
      return false;

//--- 2. TREND EXHAUSTION FILTER (RSI CHECK)
   if(use_htf_rsi_filter)
     {
      int rsi_handle = iRSI(_Symbol, htf_timeframe, htf_rsi_period, PRICE_CLOSE);
      if(rsi_handle != INVALID_HANDLE)
        {
         double rsi_buffer[];
         ArraySetAsSeries(rsi_buffer, true);

         if(CopyBuffer(rsi_handle, 0, 0, 1, rsi_buffer) > 0)
           {
            double current_rsi = rsi_buffer[0];
            IndicatorRelease(rsi_handle);

            //--- If we want to BUY, ensure HTF is not overbought (Exhausted at the top)
            if(bullish && current_rsi >= htf_rsi_overbought)
              {
               PrintFormat("[RSI EXHAUSTION] Blocked BUY. HTF RSI Overbought (%.2f >= %.2f)", current_rsi, htf_rsi_overbought);
               return false;
              }

            //--- If we want to SELL, ensure HTF is not oversold (Exhausted at the bottom)
            if(!bullish && current_rsi <= htf_rsi_oversold)
              {
               PrintFormat("[RSI EXHAUSTION] Blocked SELL. HTF RSI Oversold (%.2f <= %.2f)", current_rsi, htf_rsi_oversold);
               return false;
              }
           }
         else
           {
            IndicatorRelease(rsi_handle);
           }
        }
     }

   return true;
  }
Price Action Confirmation Engine
We finally reach our analytical stage, confirming the actual price response inside the zone, verifying evidence of rejection or continuation before trade generation. The strategy currently looks for two explicit confirmation patterns:
- Pin Bar Rejection: Focuses on rejection characteristics, including wick dominance, a compact candle body, and limited opposite-side rejection. This identifies situations where price temporarily moved beyond an area but was rejected before the candle completed.
- Engulfing Candle Patterns: Focuses on a shift in short-term control. The engulfing candle demonstrates a strong opposing response that overwhelms the existing pressure of the previous candle.
These candle structures are never evaluated in isolation; they only trigger a signal if they form inside a qualified zone that has successfully passed every previous filter in the decision pipeline. Use of this deterministic confirmation layer keeps the system transparent and easily testable.
Architectural Note
The current price action engine provides a deterministic confirmation layer using predefined candle structures, keeping the implementation transparent and easy to analyze. For production-level development, this component could be expanded with additional validation methods such as candle quality scoring, volume-based confirmation, volatility-adjusted pattern requirements, and statistical evaluation of pattern reliability. The current design keeps price action confirmation separate from the rest of the strategy pipeline, allowing additional confirmation models to be added without modifying the underlying zone evaluation system.
//+------------------------------------------------------------------+
//|Candlestick Bullish Pin Bar Ratio Check                           |
//+------------------------------------------------------------------+
bool CZoneStrategy::IsPinBarBullish(const MqlRates &b)
  {
   double range = b.high - b.low;
   if(range <= 0)
      return false;

   double body = MathAbs(b.open - b.close);
   double lower_tail = MathMin(b.open, b.close) - b.low;
   double upper_tail = b.high - MathMax(b.open, b.close);

   bool rejectionOK = (lower_tail >= body * 2.0); // Strict PinBarRatio of 2.0
   bool cleanTop    = (upper_tail <= range * 0.15);
   bool compactBody = (body <= range * 0.30);

   return (rejectionOK && cleanTop && compactBody);
  }

//+------------------------------------------------------------------+
//| Candlestick Bearish Pin Bar Ratio Check                          |
//+------------------------------------------------------------------+
bool CZoneStrategy::IsPinBarBearish(const MqlRates &b)
  {
   double range = b.high - b.low;
   if(range <= 0)
      return false;

   double body = MathAbs(b.open - b.close);
   double upper_tail = b.high - MathMax(b.open, b.close);
   double lower_tail = MathMin(b.open, b.close) - b.low;

   bool rejectionOK = (upper_tail >= body * 2.0); // Strict PinBarRatio of 2.0
   bool cleanBottom = (lower_tail <= range * 0.15);
   bool compactBody = (body <= range * 0.30);

   return (rejectionOK && cleanBottom && compactBody);
  }

//+------------------------------------------------------------------+
//|Candlestick Bullish Engulfing Check                                |
//+------------------------------------------------------------------+
bool CZoneStrategy::IsBullishEngulfing(const MqlRates &p, const MqlRates &c)
  {
   double pRange = p.high - p.low;
   double cRange = c.high - c.low;
   if(pRange <= 0 || cRange <= 0)
      return false;

   double pBody = MathAbs(p.close - p.open);
   double cBody = MathAbs(c.close - c.open);

   if(pBody / pRange < 0.30)
      return false;
   if(cBody / cRange < 0.55)
      return false;

   if(!(p.close < p.open && c.close > c.open))
      return false;

   if(!(c.open <= p.close && c.close >= p.open))
      return false;

   if(cBody < pBody * 1.2)
      return false;

   return true;
  }

//+------------------------------------------------------------------+
//|Candlestick Bearish Engulfing Bar Check                           |
//+------------------------------------------------------------------+
bool CZoneStrategy::IsBearishEngulfing(const MqlRates &p, const MqlRates &c)
  {
   double pRange = p.high - p.low;
   double cRange = c.high - c.low;
   if(pRange <= 0 || cRange <= 0)
      return false;

   double pBody = MathAbs(p.close - p.open);
   double cBody = MathAbs(c.close - c.open);

   if(pBody / pRange < 0.30)
      return false;
   if(cBody / cRange < 0.55)
      return false;

   if(!(p.close > p.open && c.close < c.open))
      return false;

   if(!(c.open >= p.close && c.close <= p.open))
      return false;

   if(cBody < pBody * 1.2)
      return false;

   return true;
  }
Operational Walkthrough and Initial Evaluation
After completing the strategy integration, the framework was tested on USDJPY using the 15-minute timeframe to observe how its components interacted during execution.
The objective of this evaluation was not to prove profitability, but to verify that the complete decision pipeline behaved as designed:
- Zones were created and maintained through the lifecycle engine.
- Only eligible zones progressed into strategy evaluation.
- Market interaction was validated before any decision was considered.
- Approach context, higher-timeframe alignment, and price action confirmation were applied before execution.
- Trade management remained separated from the analytical decision layer.
During testing, the strategy produced the following results:

Fig 2. Tester results for USDJPY from Jan 1, 2026, to Jul 17, 2026.
The test produced a positive net result with controlled drawdown, demonstrating that the decision pipeline could generate and manage trades from qualified zone interactions.
Entries and the equtiy curve were distributed across the testing phase as follows.


Fig 3. Trade distribution
However, these results should be interpreted as a technical validation of the framework rather than a final performance evaluation. The sample size remains limited, and further validation is required before the system can be considered production-ready.
Further development areas include:
- Expanding validation across different market conditions and symbols.
- Improving user-defined zone integration into the trading pipeline.
- Refining contextual filters and execution criteria.
- Conducting broader optimization and robustness testing.
The primary objective of this development phase was achieved: transforming supply and demand zones from static chart objects into structured trading decision points.
The current implementation establishes a foundation for further refinement, allowing additional validation layers and improvements to be introduced without changing the underlying architecture.
Conclusion
Part IV extends the zone management framework by introducing a structured decision-making layer around zone interaction. Instead of treating zones as passive areas of interest, the system now evaluates when price reaches a meaningful area, analyzes the surrounding market context, and applies additional validation before allowing a trading decision to occur.
The execution pipeline introduced in this phase connects zone lifecycle monitoring with contextual analysis, higher-timeframe filtering, price action confirmation, and trade management. This creates a workflow where zones become active decision points rather than isolated chart objects.
The operational tests demonstrate that the framework can link structural detection, zone tracking, interaction handling, and automated execution into a single process. Although the implementation remains a research platform rather than a production system, it provides a solid foundation for future development. The next phase will focus on day-to-day usability:
- manual zones will be evaluated and executed like automatic zones;
- persistent storage will preserve zones across restarts and crashes.
This removes the need to rebuild the framework after every restart.
The implementation is provided as a modular MQL5 codebase consisting of the following source files and an accompanying archive for direct installation into the MetaTrader terminal directory.
| File Name | Description |
|---|---|
| MasterLog1.mqh | A reusable logging module used by the Expert Advisor. It provides the logging functionality required by the project. |
| DynamicSR4.mq5 | The main Expert Advisor. It demonstrates the Dynamic Support and Resistance interaction engine presented in this article and serves as the entry point for the accompanying source code. |
| TradeManager.mqh | Implements the trade execution and position management layer. It is responsible for submitting, monitoring, and managing orders generated by the strategy while remaining independent of the decision-making process. |
| ZoneStrategy.mqh | Implements the trading decision engine. It evaluates qualified supply and demand zones through a sequence of validation filters before generating trade requests that are delegated to the trade manager for execution. |
| MQL5.zip | An archive with the MQL5 folder as its root, holding all files listed above. Unpack it into the terminal installation directory, and each file will be placed in its correct location: DynamicSR4.mq5 in MQL5\Experts\DynamicSR4\ and MasterLog1.mqh, TradeManager.mqh, and ZoneStrategy.mqh in MQL5\Include\DynamicSR4\ |
Warning: All rights to these materials are reserved by MetaQuotes Ltd. Copying or reprinting of these materials in whole or in part is prohibited.
This article was written by a user of the site and reflects their personal views. MetaQuotes Ltd is not responsible for the accuracy of the information presented, nor for any consequences resulting from the use of the solutions, strategies or recommendations described.

 Building a Future Swing Projection Indicator in MQL5
 Neural Networks in Trading: An Intelligent Forecast Pipeline (Sparse Mixture of Experts)
 From Novice to Expert: Weekend Gap Size Effect Research Using MQL5 and Python
 Elite Crystal Evolution Algorithm (CEO-inspired): Theory

- Free trading apps
- Over 8,000 signals for copying
- Economic news for exploring financial markets
You agree to website policy and terms of use