

Building a Visual Position Planning Tool for MetaTrader 5
 1 940
1 940
 0
0

Introduction
When you plan a trade, Entry, Stop‑Loss and Take‑Profit rarely remain fixed: you drag levels on the chart, tweak them for structure, and then must recompute the same metrics each time — stop distance, monetary risk, permissible lot size (respecting symbol min/max/step), potential reward and the risk‑to‑reward ratio. Doing this manually is repetitive and error-prone, especially across different order types (market/limit/stop) where Bid/Ask and execution side matter.
This article builds a compact Position Planning Tool in MQL5 that directly ties those calculations to chart objects: interactive Entry/SL/TP lines (Entry follows Bid/Ask for market orders), ATR‑based initial spacing, structural validation for BUY/SELL, and an on‑chart dashboard. Changes to the lines or incoming ticks immediately update stop distance, risk (percentage of balance), normalized lot size (using tick size/value and symbol volume rules), reward and RR — without sending or modifying any real orders.
Designing the Position Planning Tool
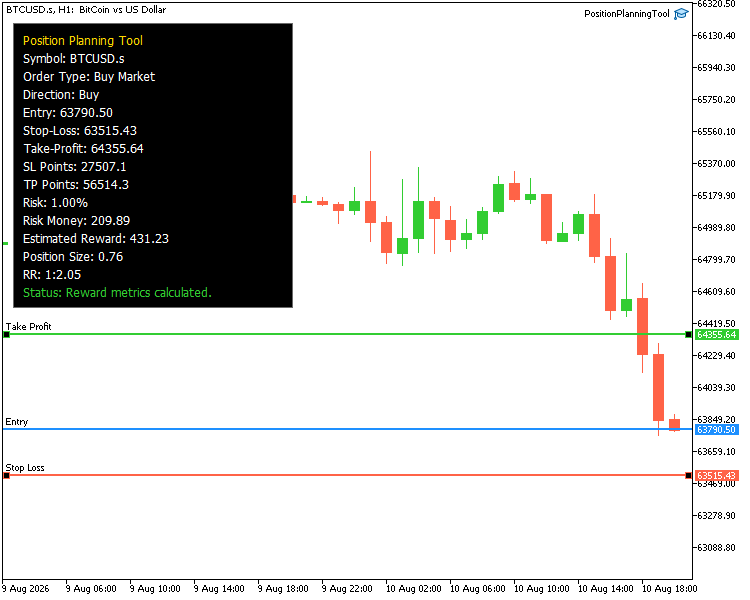
The Position Planning Tool follows a compact workflow. The trader selects the intended order type, the tool establishes initial Entry, Stop-Loss, and Take-Profit levels, validates the planned structure, calculates the main risk and reward metrics, and displays the result on the chart.
The tool supports six planning scenarios: Buy Market, Sell Market, Buy Limit, Sell Limit, Buy Stop, and Sell Stop. Although these represent different order types, they ultimately belong to either a BUY or SELL setup. This distinction becomes important when validating the relative positions of the three planning levels.
The chart uses three horizontal levels:
- Entry defines the planned entry price.
- Stop-Loss defines the price at which the planned loss would be limited.
- Take-Profit defines the intended profit target.
For market scenarios, the Entry level follows the current market price. For pending scenarios, the Entry level can be positioned manually together with the Stop-Loss and Take-Profit levels.
Initial placement is based on the Average True Range (ATR). Instead of starting with arbitrary fixed distances, the tool uses current market volatility to establish practical initial spacing between the three levels. The trader can then adjust them directly on the chart.
The configured risk percentage is combined with the account balance and stop-loss distance to estimate the monetary risk and position size. The same price levels are also used to calculate the potential reward and risk-to-reward ratio.
A dashboard consolidates the results in one place: order type, direction, Entry/Stop-Loss/Take-Profit, stop and target distances, monetary risk, estimated position size, potential reward, risk-to-reward ratio, and setup status.
Creating the Project Foundation and Initializing the Trade Plan
The first implementation stage establishes the Expert Advisor and calculates the prices from which the visual trade plan will later be drawn. At this point, no lines or dashboard objects are created. The objective is only to prepare the configuration and determine suitable initial values for Entry, Stop-Loss, and Take-Profit.
Creating the Expert Advisor
Create a new Expert Advisor in MetaEditor and save it as "PositionPlanningTool.mq5". Replace the generated template with the following foundation:
//+------------------------------------------------------------------+
//|                                         PositionPlanningTool.mq5 |
//|                                  Copyright 2026, MetaQuotes Ltd. |
//|                          https://www.mql5.com/en/users/chachaian |
//+------------------------------------------------------------------+
#property copyright "Copyright 2026, MetaQuotes Ltd."
#property link      "https://www.mql5.com/en/users/ririeh"
#property version   "1.00"

//+------------------------------------------------------------------+
//| Position line object names                                       |
//+------------------------------------------------------------------+
//--- Use unique names so each planning line can be created, found, and updated.
#define ENTRY_LINE_NAME "PPT_Entry_Line"
#define SL_LINE_NAME    "PPT_StopLoss_Line"
#define TP_LINE_NAME    "PPT_TakeProfit_Line"

//+------------------------------------------------------------------+
//| Supported planning order types                                   |
//+------------------------------------------------------------------+
enum ENUM_POSITION_TOOL_ORDER_TYPE
  {
   PTO_BUY_MARKET = 0,    // Buy Market
   PTO_SELL_MARKET,       // Sell Market
   PTO_BUY_LIMIT,         // Buy Limit
   PTO_SELL_LIMIT,        // Sell Limit
   PTO_BUY_STOP,          // Buy Stop
   PTO_SELL_STOP          // Sell Stop
  };

//+------------------------------------------------------------------+
//| Input parameters                                                 |
//+------------------------------------------------------------------+
input ENUM_POSITION_TOOL_ORDER_TYPE InpOrderType       = PTO_BUY_MARKET;
input double                        InpRiskPercent      = 1.0;
input color                         InpEntryLineColor   = clrDodgerBlue;
input color                         InpSLLineColor      = clrTomato;
input color                         InpTPLineColor      = clrLimeGreen;

input ENUM_TIMEFRAMES InpATRTimeframe = PERIOD_H1;
input int             InpATRPeriod    = 14;
input double          InpSLATRFactor  = 1.0;
input double          InpTPATRFactor  = 2.0;

//+------------------------------------------------------------------+
//| Current planning prices                                          |
//+------------------------------------------------------------------+
//--- Store the active Entry, Stop-Loss, and Take-Profit values used by the tool.
double EntryPrice      = 0.0;
double StopLossPrice   = 0.0;
double TakeProfitPrice = 0.0;

//+------------------------------------------------------------------+
//| Expert initialization function                                   |
//+------------------------------------------------------------------+
int OnInit()
  {
   return INIT_SUCCEEDED;
  }

//+------------------------------------------------------------------+
//| Expert deinitialization function                                 |
//+------------------------------------------------------------------+
void OnDeinit(const int reason)
  {
  }

//+------------------------------------------------------------------+
//| Tick event handler                                               |
//+------------------------------------------------------------------+
void OnTick()
  {
  }

//+------------------------------------------------------------------+
//| Chart event handler                                              |
//+------------------------------------------------------------------+
void OnChartEvent(const int id,
                  const long &lparam,
                  const double &dparam,
                  const string &sparam)
  {
  }
The order-type enumeration gives the tool six explicit planning modes rather than relying on numeric values whose meaning would be unclear later in the code. The inputs also define the risk configuration, chart-line colors, and ATR settings required by subsequent stages.
EntryPrice, StopLossPrice, and TakeProfitPrice hold the current planned prices. They begin as ordinary runtime values; later, the chart lines will become their visual representation.
The event handlers are intentionally minimal. Their behavior is added only when the corresponding functionality is implemented.
Reading the ATR Value
The tool needs practical starting distances for Stop-Loss and Take-Profit. Instead of applying the same fixed number of points to every symbol, the initial spacing is derived from the Average True Range (ATR).
Before retrieving ATR data, add the following error-reporting helper below OnChartEvent(). It provides a consistent message when a standard MQL5 API call fails:
//+------------------------------------------------------------------+
//| Prints a standard API error message                              |
//+------------------------------------------------------------------+
void PrintApiError(const string functionName,const string context)
  {
//--- Combine the failed function, operation context, and terminal error
//--- code so API failures can be traced consistently from the log.
   Print(functionName," failed while ",context,". Error: ",GetLastError());
  }
Immediately below PrintApiError(), add the following GetATRValue() function:
//+------------------------------------------------------------------+
//| Returns current ATR value                                        |
//+------------------------------------------------------------------+
bool GetATRValue(double &atr)
  {
//--- Reset the output value before attempting to read the indicator.
   atr = 0.0;

   ResetLastError();

//--- Create the ATR indicator handle using the configured timeframe and period.
   int handle = iATR(_Symbol,InpATRTimeframe,InpATRPeriod);

   if(handle == INVALID_HANDLE)
     {
      //--- Stop immediately if the indicator handle could not be created.
      PrintApiError("iATR()","creating the ATR indicator handle");
      return false;
     }

   double buffer[];

   ResetLastError();

//--- Copy the latest ATR value from the indicator buffer.
   int copied = CopyBuffer(handle,0,0,1,buffer);

   if(copied < 1)
     {
      //--- Report the read failure and release the handle before returning.
      PrintApiError("CopyBuffer()","reading the ATR value");

      ResetLastError();

      if(!IndicatorRelease(handle))
         PrintApiError("IndicatorRelease()",
                       "releasing the ATR handle after CopyBuffer() failure");

      return false;
     }

//--- Store the successfully copied ATR value.
   atr = buffer[0];

   ResetLastError();

//--- Release the temporary indicator handle after the value is obtained.
   if(!IndicatorRelease(handle))
     {
      PrintApiError("IndicatorRelease()",
                    "releasing the ATR indicator handle");
      return false;
     }

   return true;
  }
The function creates an ATR handle for the current symbol and the timeframe selected through InpATRTimeframe. Only one value is requested because the tool needs the latest ATR reading to establish the initial plan.
CopyBuffer() is validated using the number of elements actually copied. The returned value is not used unless at least one ATR value is available. The indicator handle is also released on both the successful path and the data-retrieval failure path. Returning bool allows the calling function to distinguish between a valid ATR result and a failed data request.
Establishing Initial Entry, Stop-Loss, and Take-Profit Prices
The next step combines the current market price with the ATR value. Entry placement depends on the selected order type, while ATR determines the initial distances to Stop-Loss and Take-Profit.
The current Bid and Ask prices are read through the boolean overload of SymbolInfoDouble(). Add the following helper immediately below GetATRValue():
//+------------------------------------------------------------------+
//| Reads a symbol double property                                   |
//+------------------------------------------------------------------+
bool GetSymbolDoubleProperty(const ENUM_SYMBOL_INFO_DOUBLE property,
                             double &value)
  {
   ResetLastError();

//--- Read the requested double property for the current chart symbol.
   if(!SymbolInfoDouble(_Symbol,property,value))
     {
      //--- Report the failure so missing or unavailable symbol data is visible.
      PrintApiError("SymbolInfoDouble()",
                    "reading symbol data for " + _Symbol);
      return false;
     }

   return true;
  }
Now add InitializeLinePrices() below GetSymbolDoubleProperty():
//+------------------------------------------------------------------+
//| Initializes default line prices                                  |
//+------------------------------------------------------------------+
bool InitializeLinePrices()
  {
   double bid = 0.0;
   double ask = 0.0;

//--- Read the current Bid and Ask prices used to anchor the initial setup.
   if(!GetSymbolDoubleProperty(SYMBOL_BID,bid))
      return false;

   if(!GetSymbolDoubleProperty(SYMBOL_ASK,ask))
      return false;

   double atr = 0.0;

//--- Use ATR to scale the initial line spacing to current market volatility.
   if(!GetATRValue(atr) || atr <= 0.0)
     {
      //--- Fall back to a fixed 100-point distance if ATR cannot be obtained.
      atr = 100 * _Point;
      Print("ATR unavailable. Using a fallback distance of 100 points.");
     }

//--- Convert the ATR value into the initial Stop-Loss and Take-Profit distances.
   double slDistance = atr * InpSLATRFactor;
   double tpDistance = atr * InpTPATRFactor;

//--- Position the three planning levels according to the selected order type.
   switch(InpOrderType)
     {
      case PTO_BUY_MARKET:
         //--- A BUY market plan starts from the current Ask price.
         EntryPrice      = ask;
         StopLossPrice   = EntryPrice - slDistance;
         TakeProfitPrice = EntryPrice + tpDistance;
         break;

      case PTO_SELL_MARKET:
         //--- A SELL market plan starts from the current Bid price.
         EntryPrice      = bid;
         StopLossPrice   = EntryPrice + slDistance;
         TakeProfitPrice = EntryPrice - tpDistance;
         break;

      case PTO_BUY_LIMIT:
         //--- Place a BUY limit entry below the current Bid price.
         EntryPrice      = bid - slDistance;
         StopLossPrice   = EntryPrice - slDistance;
         TakeProfitPrice = EntryPrice + tpDistance;
         break;

      case PTO_SELL_LIMIT:
         //--- Place a SELL limit entry above the current Ask price.
         EntryPrice      = ask + slDistance;
         StopLossPrice   = EntryPrice + slDistance;
         TakeProfitPrice = EntryPrice - tpDistance;
         break;

      case PTO_BUY_STOP:
         //--- Place a BUY stop entry above the current Ask price.
         EntryPrice      = ask + slDistance;
         StopLossPrice   = EntryPrice - slDistance;
         TakeProfitPrice = EntryPrice + tpDistance;
         break;

      case PTO_SELL_STOP:
         //--- Place a SELL stop entry below the current Bid price.
         EntryPrice      = bid - slDistance;
         StopLossPrice   = EntryPrice + slDistance;
         TakeProfitPrice = EntryPrice - tpDistance;
         break;
     }

   return true;
  }
With the default multipliers, the initial Stop-Loss distance is one ATR and the Take-Profit distance is two ATRs. These values only provide a volatility-based starting point; they do not prescribe where the trader should ultimately place either level.
For market plans, Buy Market uses the current Ask as Entry while Sell Market uses the current Bid. Pending orders require Entry to start away from the current market. Buy Limit is initialized below the market and Sell Limit above it. Buy Stop is initialized above the market, while Sell Stop is initialized below it.
The Stop-Loss and Take-Profit relationship remains consistent across these order categories. A BUY plan starts with Stop-Loss below Entry and Take-Profit above Entry. A SELL plan uses the opposite arrangement. This shared relationship becomes useful later when the tool validates manually adjusted levels.
If ATR cannot be obtained, the function uses a fallback distance of 100 points. This allows the visual planning tool to initialize while reporting that the volatility value was unavailable.
The initialization routine must now run when the EA starts. Replace the existing OnInit() function near the beginning of the file with the following version:
//+------------------------------------------------------------------+
//| Expert initialization function                                   |
//+------------------------------------------------------------------+
int OnInit()
  {
//--- Initialize the starting Entry, Stop-Loss, and Take-Profit prices.
   if(!InitializeLinePrices())
      return INIT_FAILED;

//--- Complete initialization only after the planning prices are available.
   return INIT_SUCCEEDED;
  }
The EA now has valid initial planning prices before any visual objects are created.
Testing the Initial Price Logic
Apply the MetaQuotes Styler and compile "PositionPlanningTool.mq5". The current implementation should compile with zero errors and zero warnings.
Attach the EA using several InpOrderType values. Market plans should initialize Entry from the corresponding Ask or Bid price. A Buy Limit should start below the market and a Sell Limit above it, while Buy Stop and Sell Stop should use the opposite placement.
At this stage, the calculated levels are not yet visible because the chart objects have not been implemented. The purpose of this checkpoint is only to confirm that the initialization logic runs without errors. The next section converts these prices into interactive Entry, Stop-Loss, and Take-Profit lines.
Building the Interactive Planning Lines
The initialization stage provides the three prices required by the trade plan, but they are still stored only as program variables. The next step is to represent them directly on the chart as horizontal price levels.
The chart objects serve two purposes. They make the planned Entry, Stop-Loss, and Take-Profit levels visible, and they allow the trader to modify the plan by dragging the appropriate lines.
Creating the Price Lines
The tool uses OBJ_HLINE objects because each planning level represents a price that extends across the chart. Before creating the lines, we need a few small helpers for deleting existing objects and setting object properties while checking the corresponding MQL5 API return values.
Add the following functions below InitializeLinePrices():
//+------------------------------------------------------------------+
//| Deletes a chart object if it exists                              |
//+------------------------------------------------------------------+
bool DeleteObjectIfExists(const string name)
  {
//--- Skip the deletion call when the requested object is not present.
   if(ObjectFind(0,name) < 0)
      return true;

   ResetLastError();

//--- Delete the existing object and report any failure to the terminal log.
   if(!ObjectDelete(0,name))
     {
      PrintApiError("ObjectDelete()","deleting object '" + name + "'");
      return false;
     }

   return true;
  }

//+------------------------------------------------------------------+
//| Sets an integer property on a chart object                       |
//+------------------------------------------------------------------+
bool SetObjectIntegerProperty(const string name,
                              const ENUM_OBJECT_PROPERTY_INTEGER property,
                              const long value)
  {
   ResetLastError();

//--- Apply the requested integer property to the specified chart object.
   if(!ObjectSetInteger(0,name,property,value))
     {
      //--- Report the object name so configuration failures are easy to trace.
      PrintApiError("ObjectSetInteger()",
                    "setting a property on '" + name + "'");
      return false;
     }

   return true;
  }

//+------------------------------------------------------------------+
//| Sets a string property on a chart object                         |
//+------------------------------------------------------------------+
bool SetObjectStringProperty(const string name,
                             const ENUM_OBJECT_PROPERTY_STRING property,
                             const string value)
  {
   ResetLastError();

//--- Apply the requested string property to the specified chart object.
   if(!ObjectSetString(0,name,property,value))
     {
      //--- Report the object name so text-property failures are easy to trace.
      PrintApiError("ObjectSetString()",
                    "setting a property on '" + name + "'");
      return false;
     }

   return true;
  }
These helpers keep the line-creation functions readable while ensuring that an unsuccessful object operation is not silently ignored.
The Entry line behaves differently for market and pending plans. A pending Entry represents a price selected by the trader and must therefore be draggable. A market Entry follows the current Bid or Ask and should not be manually repositioned.
Add IsMarketOrderType() immediately below the property helpers:
//+------------------------------------------------------------------+
//| Checks whether selected order type is market execution           |
//+------------------------------------------------------------------+
bool IsMarketOrderType()
  {
//--- Market plans are the only cases where Entry follows live Bid/Ask prices.
   return InpOrderType == PTO_BUY_MARKET ||
          InpOrderType == PTO_SELL_MARKET;
  }
We introduce this small helper here because line configuration already needs to distinguish market Entry from pending Entry. The same function will also be reused when market prices are synchronized later in this section.
Next, add CreatePriceLine() below IsMarketOrderType():
//+------------------------------------------------------------------+
//| Creates an adjustable horizontal price line                      |
//+------------------------------------------------------------------+
bool CreatePriceLine(const string name,
                     const double price,
                     const color lineColor,
                     const string text)
  {
//--- Remove any previous instance so the line can be recreated cleanly.
   if(!DeleteObjectIfExists(name))
      return false;

   ResetLastError();

//--- Create the horizontal line at the requested planning price.
   if(!ObjectCreate(0,name,OBJ_HLINE,0,0,price))
     {
      PrintApiError("ObjectCreate()","creating line '" + name + "'");
      return false;
     }

   bool draggable = true;

//--- Market Entry follows Bid or Ask and therefore remains fixed to live price.
   if(name == ENTRY_LINE_NAME && IsMarketOrderType())
      draggable = false;

   ResetLastError();

//--- Position the line explicitly at its initialized price.
   if(!ObjectMove(0,name,0,0,price))
     {
      PrintApiError("ObjectMove()","positioning line '" + name + "'");
      return false;
     }

//--- Apply the visual and interaction properties used by all planning lines.
   if(!SetObjectIntegerProperty(name,OBJPROP_COLOR,lineColor))
      return false;

   if(!SetObjectIntegerProperty(name,OBJPROP_WIDTH,2))
      return false;

   if(!SetObjectIntegerProperty(name,OBJPROP_STYLE,STYLE_SOLID))
      return false;

   if(!SetObjectIntegerProperty(name,OBJPROP_BACK,false))
      return false;

   if(!SetObjectIntegerProperty(name,OBJPROP_SELECTABLE,draggable))
      return false;

   if(!SetObjectIntegerProperty(name,OBJPROP_SELECTED,draggable))
      return false;

   if(!SetObjectIntegerProperty(name,OBJPROP_HIDDEN,false))
      return false;

//--- Assign a readable description to identify the line on the chart.
   if(!SetObjectStringProperty(name,OBJPROP_TEXT,text))
      return false;

   return true;
  }
CreatePriceLine() contains the common configuration shared by all three levels. The object name identifies the role of the line, while the supplied price, color, and description distinguish Entry, Stop-Loss, and Take-Profit visually. The property-setting calls are checked, but their individual syntax does not require separate explanation.
Now add CreatePositionLines() immediately below CreatePriceLine():
//+------------------------------------------------------------------+
//| Creates all position planning lines                              |
//+------------------------------------------------------------------+
bool CreatePositionLines()
  {
//--- Create the Entry line using the initialized planning price.
   if(!CreatePriceLine(ENTRY_LINE_NAME,EntryPrice,
                       InpEntryLineColor,"Entry"))
      return false;

//--- Create the Stop-Loss line used to define the planned risk distance.
   if(!CreatePriceLine(SL_LINE_NAME,StopLossPrice,
                       InpSLLineColor,"Stop Loss"))
      return false;

//--- Create the Take-Profit line used to define the planned reward target.
   if(!CreatePriceLine(TP_LINE_NAME,TakeProfitPrice,
                       InpTPLineColor,"Take Profit"))
      return false;

//--- Refresh the chart so all newly created planning lines are visible.
   ChartRedraw(0);

   return true;
  }
The function creates the three planning lines from the prices calculated during initialization. If any required line cannot be created, the failure is returned to the caller rather than leaving the tool in a partially initialized state. The lines must now be created when the EA starts. Replace the current OnInit() function with the following version:
//+------------------------------------------------------------------+
//| Expert initialization function                                   |
//+------------------------------------------------------------------+
int OnInit()
  {
//--- Initialize the starting Entry, Stop-Loss, and Take-Profit prices.
   if(!InitializeLinePrices())
      return INIT_FAILED;

//--- Create the interactive planning lines at the initialized prices.
   if(!CreatePositionLines())
      return INIT_FAILED;

//--- Redraw the chart so the newly created lines appear immediately.
   ChartRedraw(0);

   return INIT_SUCCEEDED;
  }
After compiling and attaching the EA, the initial Entry, Stop-Loss, and Take-Profit prices are now visible directly on the chart.
Reading Updated Line Prices
Once the trader can move the planning levels, the chart objects become the active source of the planned prices. The values calculated during initialization are only starting positions; subsequent calculations must use the current object positions.
Add GetLinePrice() immediately below CreatePositionLines():
//+------------------------------------------------------------------+
//| Returns the current price of a horizontal line                   |
//+------------------------------------------------------------------+
bool GetLinePrice(const string name,double &price)
  {
//--- Confirm that the requested planning line exists before reading it.
   if(ObjectFind(0,name) < 0)
     {
      Print("Object not found: ",name);
      return false;
     }

   ResetLastError();

//--- Read the current price stored in the horizontal line object.
   if(!ObjectGetDouble(0,name,OBJPROP_PRICE,0,price))
     {
      //--- Report the object name if its price cannot be retrieved.
      PrintApiError("ObjectGetDouble()",
                    "reading price from '" + name + "'");
      return false;
     }

   return true;
  }
Then add UpdateLinePrices() directly below GetLinePrice():
//+------------------------------------------------------------------+
//| Updates current line prices                                      |
//+------------------------------------------------------------------+
bool UpdateLinePrices()
  {
//--- Synchronize the stored Entry price with the current chart line.
   if(!GetLinePrice(ENTRY_LINE_NAME,EntryPrice))
      return false;

//--- Synchronize the stored Stop-Loss price with its chart line.
   if(!GetLinePrice(SL_LINE_NAME,StopLossPrice))
      return false;

//--- Synchronize the stored Take-Profit price with its chart line.
   if(!GetLinePrice(TP_LINE_NAME,TakeProfitPrice))
      return false;

   return true;
  }
GetLinePrice() reads the current OBJPROP_PRICE value of a specified horizontal line. UpdateLinePrices() then refreshes all three shared planning variables. From this point onward, calculations can use the latest positions selected on the chart rather than the original ATR-based values.
Responding to Line Movement
Reading the object prices is useful only when the program responds to chart interaction. MetaTrader sends CHARTEVENT_OBJECT_DRAG when the user finishes dragging an object. Replace the existing empty OnChartEvent() handler with the following version:
//+------------------------------------------------------------------+
//| Chart event handler                                              |
//+------------------------------------------------------------------+
void OnChartEvent(const int id,
                  const long &lparam,
                  const double &dparam,
                  const string &sparam)
  {
   if(id != CHARTEVENT_OBJECT_DRAG)
      return;

   //--- Ignore manual movement of a market Entry line
   if(IsMarketOrderType() && sparam == ENTRY_LINE_NAME)
      return;


   //--- Refresh the plan after one of its price levels changes
   if(sparam == ENTRY_LINE_NAME ||
      sparam == SL_LINE_NAME ||
      sparam == TP_LINE_NAME)
     {
      if(!UpdateLinePrices())
         Print("Failed to update planning prices after line movement.");
     }
  }
sparam identifies the object that generated the event, so unrelated chart objects are ignored. When one of the three planning levels is moved, the stored Entry, Stop-Loss, and Take-Profit values are refreshed. The event handler does not yet perform validation or risk calculations. Those stages are added after their corresponding functions exist.
Keeping Market Entry Synchronized
Pending plans use a manually positioned Entry line, but market plans require different behavior. Buy Market should follow the current Ask, while Sell Market should follow the current Bid.
Add UpdateMarketEntryPrice() below UpdateLinePrices():
//+------------------------------------------------------------------+
//| Updates market order entry line from Bid/Ask                     |
//+------------------------------------------------------------------+
bool UpdateMarketEntryPrice()
  {
//--- Pending-order plans keep a manually positioned Entry line.
   if(!IsMarketOrderType())
      return true;

//--- BUY market plans use the current Ask price as the live Entry.
   if(InpOrderType == PTO_BUY_MARKET)
     {
      if(!GetSymbolDoubleProperty(SYMBOL_ASK,EntryPrice))
         return false;
     }
   else
      //--- SELL market plans use the current Bid price as the live Entry.
      if(InpOrderType == PTO_SELL_MARKET)
        {
         if(!GetSymbolDoubleProperty(SYMBOL_BID,EntryPrice))
            return false;
        }

   ResetLastError();

//--- Move the Entry line so its chart position follows the latest market price.
   if(!ObjectMove(0,ENTRY_LINE_NAME,0,0,EntryPrice))
     {
      PrintApiError("ObjectMove()",
                    "updating the market Entry line");
      return false;
     }

   return true;
  }
The function exits immediately for pending plans, leaving their Entry line under manual control. For market plans, it obtains the appropriate live price and moves the Entry object accordingly. To perform this synchronization as prices change, replace the existing empty OnTick() handler with the following version:
//+------------------------------------------------------------------+
//| Tick event handler                                               |
//+------------------------------------------------------------------+
void OnTick()
  {
//--- Keep the market Entry line synchronized with the latest Bid or Ask price.
   if(!UpdateMarketEntryPrice())
      Print("Failed to update the market Entry price.");
  }
This keeps the market Entry line attached to the current execution side of the spread without affecting Stop-Loss or Take-Profit.
Testing the Interactive Planning Lines
Apply the MetaQuotes Styler and compile the current version of "PositionPlanningTool.mq5" with zero errors and zero warnings. The chart now provides the first useful visual test of the tool.
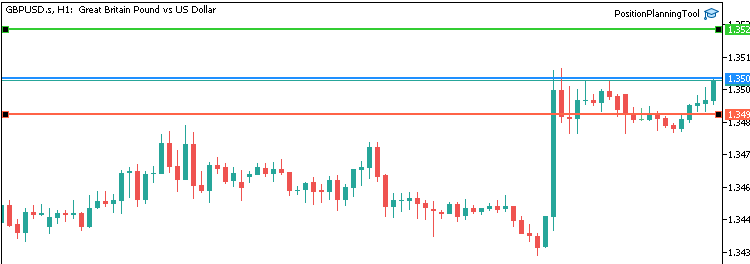
Start with a pending plan such as Buy Limit. Entry, Stop-Loss, and Take-Profit should appear as three horizontal lines, and all three should be adjustable. Drag each level and confirm that it remains at the new price after the movement is completed.
Next, attach the EA as Buy Market. Stop-Loss and Take-Profit should remain adjustable, but Entry should no longer behave as a manually positioned planning level. As new ticks arrive, it should follow the current Ask price. Sell Market should provide the corresponding behavior using Bid.
At this stage, the tool provides an interactive visual trade plan, but it still accepts any arrangement of the three levels. The next section adds the BUY and SELL validation rules required to distinguish a valid position plan from an invalid one.
Validating the Planned Position
The planning lines are now interactive, but the tool still needs to determine whether their arrangement represents a valid BUY or SELL setup. This requires a simple direction abstraction and one validation function.
Representing BUY and SELL Direction
Add the following enumeration below ENUM_POSITION_TOOL_ORDER_TYPE near the top of the file:
//+------------------------------------------------------------------+
//| Position planning direction                                      |
//+------------------------------------------------------------------+
enum ENUM_POSITION_TOOL_DIRECTION
  {
   PTD_BUY = 0,           // Buy setup
   PTD_SELL               // Sell setup
  };
Next, add GetSetupDirection() below the enumeration declarations and before the event handlers:
//+------------------------------------------------------------------+
//| Returns setup direction from selected order type                 |
//+------------------------------------------------------------------+
ENUM_POSITION_TOOL_DIRECTION GetSetupDirection()
  {
//--- All BUY order variants share the same planning direction.
   switch(InpOrderType)
     {
      case PTO_BUY_MARKET:
      case PTO_BUY_LIMIT:
      case PTO_BUY_STOP:
         return PTD_BUY;

      //--- All SELL order variants share the opposite planning direction.
      case PTO_SELL_MARKET:
      case PTO_SELL_LIMIT:
      case PTO_SELL_STOP:
         return PTD_SELL;
     }

//--- Use BUY as a safe fallback if the input value is unexpected.
   return PTD_BUY;
  }
The six planning modes are already defined, so there is no need to revisit them individually. This function simply reduces them to the two directions required by the validation logic.
Validating the Price Structure
A valid BUY plan requires Stop-Loss below Entry and Take-Profit above Entry:
Stop-Loss < Entry < Take-Profit
A valid SELL plan uses the opposite arrangement:
Take-Profit < Entry < Stop-Loss
Add ValidateLineStructure() below UpdateLinePrices():
//+------------------------------------------------------------------+
//| Validates Entry, Stop-Loss, and Take-Profit structure            |
//+------------------------------------------------------------------+
bool ValidateLineStructure(string &status)
  {
//--- Determine whether the selected order type represents a BUY or SELL plan.
   ENUM_POSITION_TOOL_DIRECTION direction = GetSetupDirection();

//--- Entry and Stop-Loss must define a measurable risk distance.
   if(EntryPrice == StopLossPrice)
     {
      status = "Invalid: Entry and Stop-Loss cannot be equal.";
      return false;
     }

//--- BUY setups require Stop-Loss below Entry and Take-Profit above Entry.
   if(direction == PTD_BUY)
     {
      if(StopLossPrice >= EntryPrice)
        {
         status = "Invalid: Buy setup requires Stop-Loss below Entry.";
         return false;
        }

      if(TakeProfitPrice <= EntryPrice)
        {
         status = "Invalid: Buy setup requires Take-Profit above Entry.";
         return false;
        }
     }

//--- SELL setups require Stop-Loss above Entry and Take-Profit below Entry.
   if(direction == PTD_SELL)
     {
      if(StopLossPrice <= EntryPrice)
        {
         status = "Invalid: Sell setup requires Stop-Loss above Entry.";
         return false;
        }

      if(TakeProfitPrice >= EntryPrice)
        {
         status = "Invalid: Sell setup requires Take-Profit below Entry.";
         return false;
        }
     }

//--- Reaching this point means the three levels form a valid setup.
   status = "Valid setup.";
   return true;
  }
The function checks only the relative price structure. It does not yet calculate risk, reward, or position size. Keeping validation separate allows later calculations to run only when the planned setup is structurally valid.
For now, the result can be verified from the Experts log. Replace the line-update block inside OnChartEvent() with the following version:
if(sparam == ENTRY_LINE_NAME ||
   sparam == SL_LINE_NAME ||
   sparam == TP_LINE_NAME)
  {
//--- Read the latest prices after one of the planning lines is moved.
   if(!UpdateLinePrices())
      return;

   string status = "";

//--- Validate the updated Entry, Stop-Loss, and Take-Profit structure.
   if(!ValidateLineStructure(status))
      Print(status);
   else
      Print(status);
  }
This temporary log output is enough to test validation before the dashboard is introduced later.
Testing the Price Structure
Compile the EA and attach it using either a BUY or SELL planning mode.
For a BUY setup, move Stop-Loss above Entry or move Take-Profit below Entry. The validation function should reject the arrangement and print the corresponding status message. Repeat the test with a SELL setup by placing Stop-Loss below Entry or Take-Profit above Entry.
Once the three levels return to the required arrangement, the status should report a valid setup. The tool can now distinguish between a visually defined trade plan and one that satisfies the structural rules required for further risk calculations.
Calculating Risk and Estimated Position Size
A valid price structure confirms that the planned setup is logically correct, but it does not yet show how much capital is exposed. The next stage uses the distance between Entry and Stop-Loss together with the configured risk percentage to estimate the monetary risk and position size.
Calculating Stop-Loss Distance
The first calculation measures the distance between Entry and Stop-Loss. The tool uses the absolute difference between the two prices so that the same function works for both BUY and SELL setups. The distance in points is obtained by dividing that price difference by _Point.
Add CalculateStopLossDistance() below ValidateLineStructure():
//+------------------------------------------------------------------+
//| Calculates Stop-Loss distance in price and points                |
//+------------------------------------------------------------------+
bool CalculateStopLossDistance(double &stopDistance,
                               double &stopPoints,
                               string &status)
  {
//--- Measure the absolute distance between Entry and Stop-Loss prices.
   stopDistance = MathAbs(EntryPrice - StopLossPrice);

//--- Convert the price distance into symbol points for display and RR use.
   stopPoints = stopDistance / _Point;

//--- Reject a setup that does not define a positive Stop-Loss distance.
   if(stopDistance <= 0.0)
     {
      status = "Invalid: Stop-Loss distance must be greater than zero.";
      return false;
     }

//--- Confirm that the Stop-Loss distance is suitable for further calculations.
   status = "Valid Stop-Loss distance.";
   return true;
  }
stopDistance keeps the difference in price units, while stopPoints expresses the same distance in points. Both values are needed later: the price distance is used for position-size estimation, while the point distance is useful for displaying and comparing the planned setup.
Calculating Monetary Risk
The monetary risk is based on the current account balance and InpRiskPercent. For example, if the account balance is 10,000 and the configured risk is 1%, the planned monetary risk is 100 account-currency units.
Add CalculateRiskAmount() immediately below CalculateStopLossDistance():
//+------------------------------------------------------------------+
//| Calculates risk amount from account balance                      |
//+------------------------------------------------------------------+
bool CalculateRiskAmount(double &riskMoney,string &status)
  {
//--- Read the current account balance as the base for percentage risk.
   double accountBalance = AccountInfoDouble(ACCOUNT_BALANCE);

//--- A positive account balance is required before monetary risk can be calculated.
   if(accountBalance <= 0.0)
     {
      status = "Invalid: Account balance must be greater than zero.";
      return false;
     }

//--- Reject zero or negative risk percentages from the input settings.
   if(InpRiskPercent <= 0.0)
     {
      status = "Invalid: Risk percentage must be greater than zero.";
      return false;
     }

//--- Convert the configured percentage of account balance into monetary risk.
   riskMoney = accountBalance * InpRiskPercent / 100.0;

//--- Confirm that the resulting risk amount is valid for later calculations.
   if(riskMoney <= 0.0)
     {
      status = "Invalid: Calculated risk amount must be greater than zero.";
      return false;
     }

   status = "Risk amount calculated.";
   return true;
  }
The function validates both the account balance and the configured percentage before calculating the amount. This prevents the next stage from working with an invalid or zero risk value.
Applying Symbol Volume Rules
The raw position-size calculation cannot be displayed directly because each symbol defines its own trading-volume rules. The relevant properties are the minimum volume, maximum volume, and volume step. For example, a calculated volume of 0.137 is not valid for a symbol whose volume step is 0.01. The result must first be aligned with the increments permitted by the symbol.
The number of decimal places used for the final volume also depends on the volume step. Add GetVolumeDigits() below CalculateRiskAmount():
//+------------------------------------------------------------------+
//| Returns decimal precision required by the volume step            |
//+------------------------------------------------------------------+
int GetVolumeDigits(const double volumeStep)
  {
   int digits = 0;
   double step = volumeStep;

//--- Increase decimal precision until the volume step becomes an integer.
   while(digits < 8 && MathAbs(step - MathRound(step)) > 1e-8)
     {
      step *= 10.0;
      digits++;
     }

//--- Return the number of decimal places required for valid volume values.
   return digits;
  }
Next, add NormalizeVolume() immediately below GetVolumeDigits():
//+------------------------------------------------------------------+
//| Normalizes volume according to symbol trading rules              |
//+------------------------------------------------------------------+
bool NormalizeVolume(const double volume,
                     double &normalizedVolume,
                     string &status)
  {
   double minVolume  = 0.0;
   double maxVolume  = 0.0;
   double volumeStep = 0.0;

//--- Read the broker-defined minimum, maximum, and step values for volume.
   if(!GetSymbolDoubleProperty(SYMBOL_VOLUME_MIN,minVolume))
     {
      status = "Invalid: Minimum volume is unavailable.";
      return false;
     }

   if(!GetSymbolDoubleProperty(SYMBOL_VOLUME_MAX,maxVolume))
     {
      status = "Invalid: Maximum volume is unavailable.";
      return false;
     }

   if(!GetSymbolDoubleProperty(SYMBOL_VOLUME_STEP,volumeStep))
     {
      status = "Invalid: Volume step is unavailable.";
      return false;
     }

//--- Reject incomplete or invalid symbol volume settings.
   if(minVolume <= 0.0 || maxVolume <= 0.0 || volumeStep <= 0.0)
     {
      status = "Invalid: Symbol volume settings are unavailable.";
      return false;
     }

//--- Start with the calculated volume before applying symbol constraints.
   normalizedVolume = volume;

//--- Clamp the volume to the allowed minimum and maximum range.
   if(normalizedVolume < minVolume)
      normalizedVolume = minVolume;

   if(normalizedVolume > maxVolume)
      normalizedVolume = maxVolume;

//--- Align the volume to the broker-defined increment.
   normalizedVolume =
      MathFloor(normalizedVolume / volumeStep) * volumeStep;

//--- Match the decimal precision required by the symbol volume step.
   int volumeDigits = GetVolumeDigits(volumeStep);

   normalizedVolume =
      NormalizeDouble(normalizedVolume,volumeDigits);

   status = "Volume normalized.";
   return true;
  }
NormalizeVolume() first keeps the result within the symbol's permitted minimum and maximum. It then rounds the value down to the nearest valid volume step and applies the required decimal precision. This step is important because the position-size calculation may produce a mathematically valid number that does not match the symbol's actual trading rules.
Estimating Position Size
Position-size estimation also requires the symbol's trade tick size and tick value. The tool first determines how many ticks exist between Entry and Stop-Loss by dividing the Stop-Loss price distance by the tick size. Multiplying that result by the tick value gives the estimated monetary loss for one lot if price moves from Entry to Stop-Loss. The requested monetary risk is then divided by this one-lot loss to obtain the raw position size.
Add CalculateLotSize() below NormalizeVolume():
//+------------------------------------------------------------------+
//| Calculates lot size from risk amount and Stop-Loss distance      |
//+------------------------------------------------------------------+
bool CalculateLotSize(const double stopDistance,
                      const double riskMoney,
                      double &lotSize,
                      string &status)
  {
   double tickValue = 0.0;
   double tickSize  = 0.0;

//--- Read the symbol values required to convert price movement into money.
   if(!GetSymbolDoubleProperty(SYMBOL_TRADE_TICK_VALUE,tickValue))
     {
      status = "Invalid: Tick value is unavailable.";
      return false;
     }

   if(!GetSymbolDoubleProperty(SYMBOL_TRADE_TICK_SIZE,tickSize))
     {
      status = "Invalid: Tick size is unavailable.";
      return false;
     }

//--- Reject invalid tick data before using it in the risk calculation.
   if(tickValue <= 0.0 || tickSize <= 0.0)
     {
      status = "Invalid: Tick value or tick size is unavailable.";
      return false;
     }

//--- A positive Stop-Loss distance is required to estimate position size.
   if(stopDistance <= 0.0)
     {
      status = "Invalid: Stop distance must be greater than zero.";
      return false;
     }

//--- Calculate how much one lot would lose over the planned Stop-Loss distance.
   double moneyPerLot = stopDistance / tickSize * tickValue;

   if(moneyPerLot <= 0.0)
     {
      status = "Invalid: Money risk per lot is zero.";
      return false;
     }

//--- Divide the allowed monetary risk by the risk carried by one lot.
   double rawLotSize = riskMoney / moneyPerLot;

//--- Adjust the result to the symbol's minimum, maximum, and volume step.
   if(!NormalizeVolume(rawLotSize,lotSize,status))
      return false;

   status = "Lot size calculated.";
   return true;
  }
The relationship between Stop-Loss distance and position size is inverse. If the trader moves Stop-Loss farther from Entry while keeping the same risk percentage, the estimated position size becomes smaller. Moving Stop-Loss closer allows a larger position size for the same planned monetary risk.
The raw result is always passed through NormalizeVolume() before it is used elsewhere in the tool. This keeps the estimate consistent with the volume range and step supported by the current symbol.
At this stage, the tool can determine Stop-Loss distance, monetary risk, and estimated position size from the planned Entry and Stop-Loss levels. The next section extends the same plan to the Take-Profit side by calculating potential reward and risk-to-reward ratio.
Calculating Potential Reward and Risk-to-Reward Ratio
The Stop-Loss side of the plan defines how much is at risk. The Take-Profit side completes the picture by showing the potential reward and the relationship between reward and risk.
Add CalculateRewardMetrics() below CalculateLotSize():
//+------------------------------------------------------------------+
//| Calculates reward distance, RR, and estimated reward             |
//+------------------------------------------------------------------+
bool CalculateRewardMetrics(const double stopPoints,
                            const double riskMoney,
                            double &rewardPoints,
                            double &rr,
                            double &rewardMoney,
                            string &status)
  {
//--- Measure the absolute distance between Entry and Take-Profit.
   double rewardDistance = MathAbs(TakeProfitPrice - EntryPrice);

//--- Convert the reward distance into symbol points.
   rewardPoints = rewardDistance / _Point;

//--- A positive Stop-Loss distance is required to calculate RR.
   if(stopPoints <= 0.0)
     {
      status = "Invalid: Stop points must be greater than zero.";
      return false;
     }

//--- Take-Profit must define a positive reward distance from Entry.
   if(rewardPoints <= 0.0)
     {
      status = "Invalid: Take-Profit distance must be greater than zero.";
      return false;
     }

//--- Compare potential reward with planned risk to obtain the RR value.
   rr = rewardPoints / stopPoints;

//--- Apply the RR value to monetary risk to estimate potential reward.
   rewardMoney = riskMoney * rr;

   status = "Reward metrics calculated.";
   return true;
  }
The function first measures the distance between Entry and Take-Profit and converts it to points. It then compares that distance with the Stop-Loss distance already calculated in the previous section.
If Take-Profit is twice as far from Entry as Stop-Loss, the resulting risk-to-reward ratio is 1:2. The estimated monetary reward is obtained by applying that ratio to the planned monetary risk. For example, if the trader risks 100 account-currency units and the setup has a risk-to-reward ratio of 1:2, the estimated reward is 200 units.
The relationship is dynamic: moving Take-Profit farther from Entry increases both reward distance and the risk-to-reward ratio. Moving it closer reduces both values. Moving Stop-Loss also affects the ratio because it changes the amount of price movement being accepted as risk. At the same time, the Stop-Loss distance influences the estimated position size calculated in the previous section.
The tool now has all of the calculations required to evaluate a planned position. The next section brings these values together on the chart through the dashboard.
Presenting the Position Plan on the Dashboard
The calculation functions now provide all the information required to evaluate a planned position. The dashboard brings these values together so that changes to Entry, Stop-Loss, or Take-Profit can be evaluated directly on the chart.
Creating the Dashboard
The dashboard uses a rectangular background and a set of text labels. Add the following constants below the existing position-line object names near the top of the file:
//+------------------------------------------------------------------+
//| Dashboard settings                                               |
//+------------------------------------------------------------------+
//--- Prefix all dashboard labels so they can be identified as one group.
#define PANEL_PREFIX    "PPT_Panel_"

//--- Use a dedicated object name for the dashboard background panel.
#define PANEL_BG_NAME   "PPT_Panel_Background"

//--- Define the dashboard position and dimensions on the chart.
#define PANEL_X         20
#define PANEL_Y         30
#define PANEL_WIDTH     280
#define PANEL_HEIGHT    285
#define PANEL_LINE_GAP  18

//--- Define the colors used for dashboard text, title, background, and border.
#define PANEL_TEXT      clrWhite
#define PANEL_TITLE     clrGold
#define PANEL_BG        clrBlack
#define PANEL_BORDER    clrDimGray
PANEL_PREFIX gives every dashboard label a predictable object name, while the remaining constants keep the layout and appearance in one place.
Add the following dashboard functions below CalculateRewardMetrics():
//+------------------------------------------------------------------+
//| Creates dashboard background panel                               |
//+------------------------------------------------------------------+
bool CreateDashboardBackground()
  {
//--- Remove any previous panel instance before creating a fresh background.
   if(!DeleteObjectIfExists(PANEL_BG_NAME))
      return false;

   ResetLastError();

//--- Create a rectangle label that acts as the dashboard container.
   if(!ObjectCreate(0,PANEL_BG_NAME,OBJ_RECTANGLE_LABEL,0,0,0))
     {
      PrintApiError("ObjectCreate()",
                    "creating the dashboard background");
      return false;
     }

//--- Anchor the panel to the upper-left corner of the chart.
   if(!SetObjectIntegerProperty(PANEL_BG_NAME,
                                OBJPROP_CORNER,CORNER_LEFT_UPPER))
      return false;

//--- Position the panel slightly outside the text origin to create padding.
   if(!SetObjectIntegerProperty(PANEL_BG_NAME,
                                OBJPROP_XDISTANCE,PANEL_X - 10))
      return false;

   if(!SetObjectIntegerProperty(PANEL_BG_NAME,
                                OBJPROP_YDISTANCE,PANEL_Y - 10))
      return false;

//--- Apply the fixed dimensions used by the compact dashboard layout.
   if(!SetObjectIntegerProperty(PANEL_BG_NAME,
                                OBJPROP_XSIZE,PANEL_WIDTH))
      return false;

   if(!SetObjectIntegerProperty(PANEL_BG_NAME,
                                OBJPROP_YSIZE,PANEL_HEIGHT))
      return false;

//--- Apply the dashboard background and border appearance.
   if(!SetObjectIntegerProperty(PANEL_BG_NAME,
                                OBJPROP_BGCOLOR,PANEL_BG))
      return false;

   if(!SetObjectIntegerProperty(PANEL_BG_NAME,
                                OBJPROP_COLOR,PANEL_BORDER))
      return false;

   if(!SetObjectIntegerProperty(PANEL_BG_NAME,
                                OBJPROP_BORDER_TYPE,BORDER_FLAT))
      return false;

//--- Keep the background fixed so it does not interfere with chart interaction.
   if(!SetObjectIntegerProperty(PANEL_BG_NAME,
                                OBJPROP_SELECTABLE,false))
      return false;

   if(!SetObjectIntegerProperty(PANEL_BG_NAME,
                                OBJPROP_HIDDEN,true))
      return false;

   return true;
  }

//+------------------------------------------------------------------+
//| Creates or updates a dashboard label                             |
//+------------------------------------------------------------------+
bool SetPanelText(const string name,
                  const string text,
                  const int x,
                  const int y,
                  const color textColor)
  {
//--- Create the label only when it does not already exist on the chart.
   if(ObjectFind(0,name) < 0)
     {
      ResetLastError();

      //--- Create a label object that will display one dashboard value.
      if(!ObjectCreate(0,name,OBJ_LABEL,0,0,0))
        {
         PrintApiError("ObjectCreate()",
                       "creating dashboard label '" + name + "'");
         return false;
        }

      //--- Anchor the label to the upper-left corner for fixed panel layout.
      if(!SetObjectIntegerProperty(name,
                                   OBJPROP_CORNER,CORNER_LEFT_UPPER))
         return false;

      if(!SetObjectIntegerProperty(name,
                                   OBJPROP_ANCHOR,ANCHOR_LEFT_UPPER))
         return false;

      //--- Apply the common font settings used by all dashboard labels.
      if(!SetObjectIntegerProperty(name,OBJPROP_FONTSIZE,9))
         return false;

      if(!SetObjectStringProperty(name,OBJPROP_FONT,"Tahoma"))
         return false;

      //--- Prevent dashboard text from interfering with chart interaction.
      if(!SetObjectIntegerProperty(name,OBJPROP_SELECTABLE,false))
         return false;

      if(!SetObjectIntegerProperty(name,OBJPROP_HIDDEN,true))
         return false;
     }

//--- Update the label position, color, and displayed text.
   if(!SetObjectIntegerProperty(name,OBJPROP_XDISTANCE,x))
      return false;

   if(!SetObjectIntegerProperty(name,OBJPROP_YDISTANCE,y))
      return false;

   if(!SetObjectIntegerProperty(name,OBJPROP_COLOR,textColor))
      return false;

   if(!SetObjectStringProperty(name,OBJPROP_TEXT,text))
      return false;

   return true;
  }

//+------------------------------------------------------------------+
//| Creates dashboard objects                                        |
//+------------------------------------------------------------------+
bool CreateDashboard()
  {
//--- Create the background container before adding dashboard labels.
   if(!CreateDashboardBackground())
      return false;

//--- Create the fixed set of labels used to display planning information.
   for(int i = 0; i < 15; i++)
     {
      string name = PANEL_PREFIX + IntegerToString(i);

      //--- Position each label on its own row using the common line spacing.
      if(!SetPanelText(name,"",
                       PANEL_X,
                       PANEL_Y + i * PANEL_LINE_GAP,
                       PANEL_TEXT))
         return false;
     }

//--- Redraw the chart so the completed dashboard becomes visible immediately.
   ChartRedraw(0);

   return true;
  }
The background and labels are created separately so that the text can be refreshed without reconstructing the panel. The repeated object-property calls are checked for failure, but their individual settings require no further explanation.
The dashboard also needs readable descriptions of the selected order type and setup direction. Add these functions below CreateDashboard():
//+------------------------------------------------------------------+
//| Returns selected order type text                                 |
//+------------------------------------------------------------------+
string GetOrderTypeText()
  {
//--- Convert the selected order type into readable dashboard text.
   switch(InpOrderType)
     {
      case PTO_BUY_MARKET:
         return "Buy Market";

      case PTO_SELL_MARKET:
         return "Sell Market";

      case PTO_BUY_LIMIT:
         return "Buy Limit";

      case PTO_SELL_LIMIT:
         return "Sell Limit";

      case PTO_BUY_STOP:
         return "Buy Stop";

      case PTO_SELL_STOP:
         return "Sell Stop";
     }

//--- Return a fallback label if the selected value is not recognized.
   return "Unknown";
  }

//+------------------------------------------------------------------+
//| Returns direction text                                           |
//+------------------------------------------------------------------+
string GetDirectionText()
  {
//--- Convert the internal setup direction into readable dashboard text.
   if(GetSetupDirection() == PTD_BUY)
      return "Buy";

//--- Any non-BUY setup is presented as a SELL direction.
   return "Sell";
  }
Updating the Dashboard
UpdateDashboard() becomes the central calculation routine. It first reads the current chart levels and validates their structure. If the setup remains valid, it calculates Stop-Loss distance, monetary risk, estimated position size, and finally the reward metrics.
Add the following function below GetDirectionText():
//+------------------------------------------------------------------+
//| Updates dashboard values                                         |
//+------------------------------------------------------------------+
bool UpdateDashboard()
  {
//--- Read the latest Entry, Stop-Loss, and Take-Profit line positions.
   if(!UpdateLinePrices())
      return false;

   string status = "";

   double stopDistance = 0.0;
   double stopPoints   = 0.0;
   double riskMoney    = 0.0;
   double lotSize      = 0.0;
   double rewardPoints = 0.0;
   double rr           = 0.0;
   double rewardMoney  = 0.0;

//--- Validate the price structure before performing any calculations.
   bool valid = ValidateLineStructure(status);

//--- Run each calculation only if the preceding stage completed successfully.
   if(valid)
      valid = CalculateStopLossDistance(stopDistance,
                                        stopPoints,
                                        status);

   if(valid)
      valid = CalculateRiskAmount(riskMoney,status);

   if(valid)
      valid = CalculateLotSize(stopDistance,
                               riskMoney,
                               lotSize,
                               status);

   if(valid)
      valid = CalculateRewardMetrics(stopPoints,
                                     riskMoney,
                                     rewardPoints,
                                     rr,
                                     rewardMoney,
                                     status);

//--- Populate the dashboard with the latest setup and calculation results.
   if(!SetPanelText(PANEL_PREFIX + "0",
                    "Position Planning Tool",
                    PANEL_X,
                    PANEL_Y,
                    PANEL_TITLE))
      return false;

   if(!SetPanelText(PANEL_PREFIX + "1",
                    "Symbol: " + _Symbol,
                    PANEL_X,
                    PANEL_Y + 1 * PANEL_LINE_GAP,
                    PANEL_TEXT))
      return false;

   if(!SetPanelText(PANEL_PREFIX + "2",
                    "Order Type: " + GetOrderTypeText(),
                    PANEL_X,
                    PANEL_Y + 2 * PANEL_LINE_GAP,
                    PANEL_TEXT))
      return false;

   if(!SetPanelText(PANEL_PREFIX + "3",
                    "Direction: " + GetDirectionText(),
                    PANEL_X,
                    PANEL_Y + 3 * PANEL_LINE_GAP,
                    PANEL_TEXT))
      return false;

   if(!SetPanelText(PANEL_PREFIX + "4",
                    "Entry: " + DoubleToString(EntryPrice,_Digits),
                    PANEL_X,
                    PANEL_Y + 4 * PANEL_LINE_GAP,
                    PANEL_TEXT))
      return false;

   if(!SetPanelText(PANEL_PREFIX + "5",
                    "Stop-Loss: " +
                    DoubleToString(StopLossPrice,_Digits),
                    PANEL_X,
                    PANEL_Y + 5 * PANEL_LINE_GAP,
                    PANEL_TEXT))
      return false;

   if(!SetPanelText(PANEL_PREFIX + "6",
                    "Take-Profit: " +
                    DoubleToString(TakeProfitPrice,_Digits),
                    PANEL_X,
                    PANEL_Y + 6 * PANEL_LINE_GAP,
                    PANEL_TEXT))
      return false;

   if(!SetPanelText(PANEL_PREFIX + "7",
                    "SL Points: " +
                    DoubleToString(stopPoints,1),
                    PANEL_X,
                    PANEL_Y + 7 * PANEL_LINE_GAP,
                    PANEL_TEXT))
      return false;

   if(!SetPanelText(PANEL_PREFIX + "8",
                    "TP Points: " +
                    DoubleToString(rewardPoints,1),
                    PANEL_X,
                    PANEL_Y + 8 * PANEL_LINE_GAP,
                    PANEL_TEXT))
      return false;

   if(!SetPanelText(PANEL_PREFIX + "9",
                    "Risk: " +
                    DoubleToString(InpRiskPercent,2) + "%",
                    PANEL_X,
                    PANEL_Y + 9 * PANEL_LINE_GAP,
                    PANEL_TEXT))
      return false;

   if(!SetPanelText(PANEL_PREFIX + "10",
                    "Risk Money: " +
                    DoubleToString(riskMoney,2),
                    PANEL_X,
                    PANEL_Y + 10 * PANEL_LINE_GAP,
                    PANEL_TEXT))
      return false;

   if(!SetPanelText(PANEL_PREFIX + "11",
                    "Estimated Reward: " +
                    DoubleToString(rewardMoney,2),
                    PANEL_X,
                    PANEL_Y + 11 * PANEL_LINE_GAP,
                    PANEL_TEXT))
      return false;

   if(!SetPanelText(PANEL_PREFIX + "12",
                    "Position Size: " +
                    DoubleToString(lotSize,2),
                    PANEL_X,
                    PANEL_Y + 12 * PANEL_LINE_GAP,
                    PANEL_TEXT))
      return false;

   if(!SetPanelText(PANEL_PREFIX + "13",
                    "RR: 1:" + DoubleToString(rr,2),
                    PANEL_X,
                    PANEL_Y + 13 * PANEL_LINE_GAP,
                    PANEL_TEXT))
      return false;

//--- Use the final validation state to color the dashboard status message.
   if(!SetPanelText(PANEL_PREFIX + "14",
                    "Status: " + status,
                    PANEL_X,
                    PANEL_Y + 14 * PANEL_LINE_GAP,
                    valid ? clrLimeGreen : clrTomato))
      return false;

//--- Redraw the chart so all updated dashboard values appear immediately.
   ChartRedraw(0);

   return true;
  }
The order of these calculations is intentional. A structurally invalid plan stops the calculation chain before risk or reward values are produced. Likewise, a failure in Stop-Loss distance, risk calculation, volume estimation, or reward calculation prevents later stages from using invalid data. The final status value therefore represents the last meaningful result of the evaluation.
The dashboard must now be connected to the EA's event handlers. Replace the existing OnInit() function with the following version:
//+------------------------------------------------------------------+
//| Expert initialization function                                   |
//+------------------------------------------------------------------+
int OnInit()
  {
//--- Apply the visual style used by the Position Planning Tool.
   if(!ConfigureChartAppearance())
      return INIT_FAILED;

//--- Configure chart display settings required by the planning interface.
   if(!ConfigureChartDisplay())
      return INIT_FAILED;

//--- Calculate the initial Entry, Stop-Loss, and Take-Profit prices.
   if(!InitializeLinePrices())
      return INIT_FAILED;

//--- Create the interactive planning lines at the initialized prices.
   if(!CreatePositionLines())
      return INIT_FAILED;

//--- Create the dashboard objects used to display the position plan.
   if(!CreateDashboard())
      return INIT_FAILED;

//--- Populate the dashboard with the first complete set of calculations.
   if(!UpdateDashboard())
      return INIT_FAILED;

//--- Redraw the chart after all interface components are initialized.
   ChartRedraw(0);

   return INIT_SUCCEEDED;
  }
Next, replace the existing OnTick() function:
//+------------------------------------------------------------------+
//| Tick event handler                                               |
//+------------------------------------------------------------------+
void OnTick()
  {
//--- Keep market Entry synchronized with the current Bid or Ask price.
   if(!UpdateMarketEntryPrice())
      return;

//--- Recalculate and refresh the dashboard using the latest market data.
   if(!UpdateDashboard())
      Print("Failed to update the dashboard.");
  }
Finally, replace the existing OnChartEvent() function with the complete version below:
//+------------------------------------------------------------------+
//| Chart event handler                                              |
//+------------------------------------------------------------------+
void OnChartEvent(const int id,
                  const long &lparam,
                  const double &dparam,
                  const string &sparam)
  {
//--- Ignore chart events that are unrelated to dragging objects.
   if(id != CHARTEVENT_OBJECT_DRAG)
      return;

//--- Market Entry follows Bid or Ask and should not be handled as a manual drag.
   if(IsMarketOrderType() && sparam == ENTRY_LINE_NAME)
      return;

//--- Recalculate the plan when any adjustable planning line is moved.
   if(sparam == ENTRY_LINE_NAME ||
      sparam == SL_LINE_NAME ||
      sparam == TP_LINE_NAME)
     {
      //--- Refresh all calculations and dashboard values after the drag ends.
      if(!UpdateDashboard())
         Print("Failed to update the dashboard after line movement.");
     }
  }
The temporary validation messages previously written to the "Experts" tab are no longer required. Validation is now part of the dashboard calculation sequence, and the resulting status is displayed directly on the chart. At this stage, the interface should resemble the completed Position Planning Tool shown below.
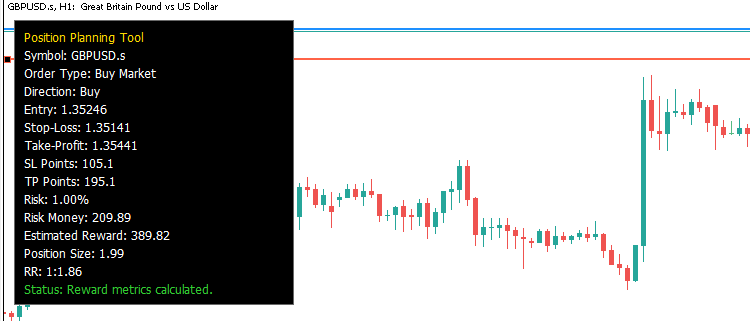
Dragging Stop-Loss or Take-Profit now causes the displayed distances, estimated position size, potential reward, and risk-to-reward ratio to update with the new plan. For pending scenarios, moving Entry recalculates the same values from the newly selected entry price. Market Entry remains synchronized with Bid or Ask, and the dashboard follows it as prices change.
Completing Initialization and Cleanup
The core planning logic is complete. The remaining work is to apply a consistent chart appearance when the tool starts and remove the objects it created when the EA is detached.
Configuring the Chart
The Position Planning Tool uses a clean chart layout so the planning lines and dashboard remain easy to read. Add the following helper below the existing object-property helpers:
//+------------------------------------------------------------------+
//| Sets an integer chart property                                   |
//+------------------------------------------------------------------+
bool SetChartIntegerProperty(const ENUM_CHART_PROPERTY_INTEGER property,
                             const long value)
  {
   ResetLastError();

//--- Apply the requested integer setting to the current chart.
   if(!ChartSetInteger(0,property,value))
     {
      //--- Report the failure so chart configuration problems are traceable.
      PrintApiError("ChartSetInteger()",
                    "configuring the current chart");
      return false;
     }

   return true;
  }
Next, add the chart-configuration functions below the dashboard functions:
//+------------------------------------------------------------------+
//| Configures chart display settings                                |
//+------------------------------------------------------------------+
bool ConfigureChartDisplay()
  {
//--- Hide the platform Bid and Ask lines to keep the planning view uncluttered.
   if(!SetChartIntegerProperty(CHART_SHOW_ASK_LINE,false))
      return false;

   if(!SetChartIntegerProperty(CHART_SHOW_BID_LINE,false))
      return false;

//--- Keep chart objects visible above the price display.
   if(!SetChartIntegerProperty(CHART_FOREGROUND,false))
      return false;

//--- Show object descriptions so the planning lines remain identifiable.
   if(!SetChartIntegerProperty(CHART_SHOW_OBJECT_DESCR,true))
      return false;

//--- Apply the updated display settings immediately.
   ChartRedraw(0);

   return true;
  }

//+------------------------------------------------------------------+
//| Applies Position Planning Tool chart appearance                  |
//+------------------------------------------------------------------+
bool ConfigureChartAppearance()
  {
//--- Use a clean white background and remove the default chart grid.
   if(!SetChartIntegerProperty(CHART_COLOR_BACKGROUND,clrWhite))
      return false;

   if(!SetChartIntegerProperty(CHART_SHOW_GRID,false))
      return false;

//--- Display price action as candlesticks for a clear planning view.
   if(!SetChartIntegerProperty(CHART_MODE,CHART_CANDLES))
      return false;

//--- Apply contrasting foreground and candle colors for readability.
   if(!SetChartIntegerProperty(CHART_COLOR_FOREGROUND,clrBlack))
      return false;

   if(!SetChartIntegerProperty(CHART_COLOR_CANDLE_BULL,clrLimeGreen))
      return false;

   if(!SetChartIntegerProperty(CHART_COLOR_CANDLE_BEAR,clrTomato))
      return false;

   if(!SetChartIntegerProperty(CHART_COLOR_CHART_UP,clrLimeGreen))
      return false;

   if(!SetChartIntegerProperty(CHART_COLOR_CHART_DOWN,clrTomato))
      return false;

//--- Redraw the chart so the new appearance is applied immediately.
   ChartRedraw(0);

   return true;
  }
These functions only control presentation. They do not affect the planning calculations. Each chart operation is still checked so that initialization can stop if a required display setting cannot be applied.
Now replace the current OnInit() function with its final version:
//+------------------------------------------------------------------+
//| Expert initialization function                                   |
//+------------------------------------------------------------------+
int OnInit()
  {
//--- Apply the visual style used by the Position Planning Tool.
   if(!ConfigureChartAppearance())
      return INIT_FAILED;

//--- Configure chart display settings required by the planning interface.
   if(!ConfigureChartDisplay())
      return INIT_FAILED;

//--- Calculate the initial Entry, Stop-Loss, and Take-Profit prices.
   if(!InitializeLinePrices())
      return INIT_FAILED;

//--- Create the interactive planning lines at the initialized prices.
   if(!CreatePositionLines())
      return INIT_FAILED;

//--- Create the dashboard objects used to display the position plan.
   if(!CreateDashboard())
      return INIT_FAILED;

//--- Populate the dashboard with the first complete set of calculations.
   if(!UpdateDashboard())
      return INIT_FAILED;

//--- Redraw the chart after all interface components are initialized.
   ChartRedraw(0);

   return INIT_SUCCEEDED;
  }
Removing Created Objects
The EA should also remove the objects it owns when it is detached. This prevents old planning lines or dashboard elements from remaining on the chart after the tool stops running.
Add the following cleanup functions below UpdateDashboard():
//+------------------------------------------------------------------+
//| Deletes dashboard objects                                        |
//+------------------------------------------------------------------+
bool DeleteDashboard()
  {
   bool success = true;

//--- Remove the dashboard background while preserving the overall cleanup state.
   if(!DeleteObjectIfExists(PANEL_BG_NAME))
      success = false;

//--- Remove every dashboard label created with the common panel prefix.
   for(int i = 0; i < 15; i++)
     {
      string name = PANEL_PREFIX + IntegerToString(i);

      //--- Continue deleting remaining labels even if one deletion fails.
      if(!DeleteObjectIfExists(name))
         success = false;
     }

//--- Report whether all dashboard objects were removed successfully.
   return success;
  }

//+------------------------------------------------------------------+
//| Deletes position planning lines                                  |
//+------------------------------------------------------------------+
bool DeletePositionLines()
  {
   bool success = true;

//--- Remove each planning line while preserving the overall cleanup result.
   if(!DeleteObjectIfExists(ENTRY_LINE_NAME))
      success = false;

   if(!DeleteObjectIfExists(SL_LINE_NAME))
      success = false;

   if(!DeleteObjectIfExists(TP_LINE_NAME))
      success = false;

//--- Report whether all planning lines were removed successfully.
   return success;
  }
Both functions attempt to remove all related objects even if one deletion fails. They return the overall result so the caller can report cleanup problems without stopping halfway through the remaining objects.
Finally, replace the current OnDeinit() function with:
//+------------------------------------------------------------------+
//| Expert deinitialization function                                 |
//+------------------------------------------------------------------+
void OnDeinit(const int reason)
  {
//--- Remove all dashboard objects created by the EA.
   if(!DeleteDashboard())
      Print("Warning: One or more dashboard objects could not be deleted.");

//--- Remove the Entry, Stop-Loss, and Take-Profit planning lines.
   if(!DeletePositionLines())
      Print("Warning: One or more planning lines could not be deleted.");

//--- Refresh the chart after cleanup so removed objects disappear immediately.
   ChartRedraw(0);
  }
The tool now has a complete lifecycle: it configures the chart and creates its planning interface during initialization, then removes its own objects when the EA is detached.
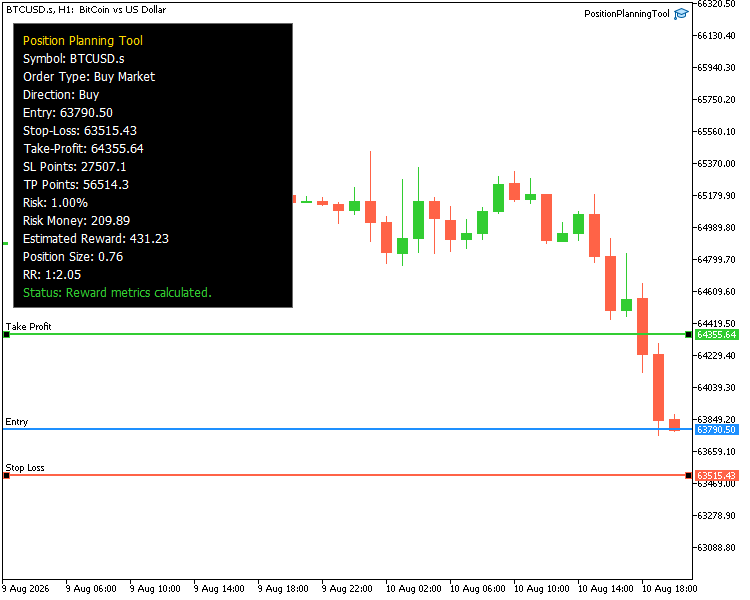
Apply the MetaQuotes Styler, compile the completed EA, and attach it to a chart. Verify that the lines appear at the expected starting levels and that draggable lines respond correctly. Confirm that market Entry follows Bid/Ask, and that the dashboard updates position size, risk, reward, risk-to-reward, and validation status as levels change.
Conclusion
The finished Position Planning Tool provides a practical, on‑chart workflow for evaluating trade ideas before execution. Key outcomes delivered by the EA:
- ATR‑based initialization of Entry/Stop‑Loss/Take‑Profit spacing and support for six planning scenarios (Buy/Sell × Market/Limit/Stop);
- interactive horizontal lines for direct plan editing (market Entry synchronizes to Bid/Ask);
- BUY/SELL structural validation that prevents invalid Entry/SL/TP arrangements;
- live calculations of SL/TP distances (points), monetary risk from a configured % of account balance, and estimated lot size derived from stop distance, tick size/value and symbol volume rules (min/max/step);
- potential reward and risk‑to‑reward ratio, all shown on a compact dashboard that updates on line drag or new ticks.
Importantly, the tool is strictly a planner and evaluator — it never opens, modifies or closes trades. You receive a ready‑to‑compile MQL5 Expert Advisor that streamlines the repetitive math of position sizing and lets you immediately see the numeric consequences of any chart‑level adjustment.
Attachments
The complete source code developed in this article is provided as a direct attachment.
| Filename | Description |
|---|---|
| PositionPlanningTool.mq5 | Complete MQL5 source code for the Position Planning Tool |
The project is also available on Algo Forge for readers who prefer to browse the source online or follow future repository updates:
Algo Forge repository: https://forge.mql5.io/CHACHAIAN/PositionPlanningTool
Warning: All rights to these materials are reserved by MetaQuotes Ltd. Copying or reprinting of these materials in whole or in part is prohibited.
This article was written by a user of the site and reflects their personal views. MetaQuotes Ltd is not responsible for the accuracy of the information presented, nor for any consequences resulting from the use of the solutions, strategies or recommendations described.

 Neural Networks in Trading: An End-to-End Multivariate Time Series Forecasting Model (Key Components)
 Building a Position Lifecycle Manager in MQL5 (Part 1): The Foundation of Reusable Position Management
 Isolation Forest: Unsupervised Anomaly Detection, and What It Actually Finds in Price Data
 Deterministic Dendritic Cell Algorithm (dDCA)

- Free trading apps
- Over 8,000 signals for copying
- Economic news for exploring financial markets
You agree to website policy and terms of use