

Where should your stop-loss really sit? An MAE/MFE excursion analyzer in MQL5
 3 749
3 749
 2
2

Introduction
Most traders still set stop-losses and take-profits by habit — a round number, a fixed risk-reward ratio, or the indicator's default — and then wonder why good entries are stopped out by noise or why winners are cut short. The answer is already in the account: past trades encode how far price actually ran for and against each entry. Extracting that information consistently is all it takes to turn guesswork into measurement.
This article presents an Expert Advisor, the MAE/MFE Excursion Analyzer, that does exactly that. Given a symbol (and an optional magic number) and a window of closed history, it reconstructs each round-trip from the deal records, reads the M1 candles between entry and exit, and reports per-trade MAE (maximum adverse excursion), MFE (maximum favorable excursion) and efficiency. From those distributions it produces concrete, strategy-specific guidance: a stop suggestion (for example, winners' p90 MAE), a target suggestion (for example, winners' median MFE), and a CSV of every trade, while making clear that this is an analysis instrument, not a trading robot and not financial advice. Note that the method requires an existing history of closed trades for the symbol or strategy you want to study.
This tool is for analysis and diagnostics. It reads history and does not place orders. It is not financial advice.
What MAE and MFE measure
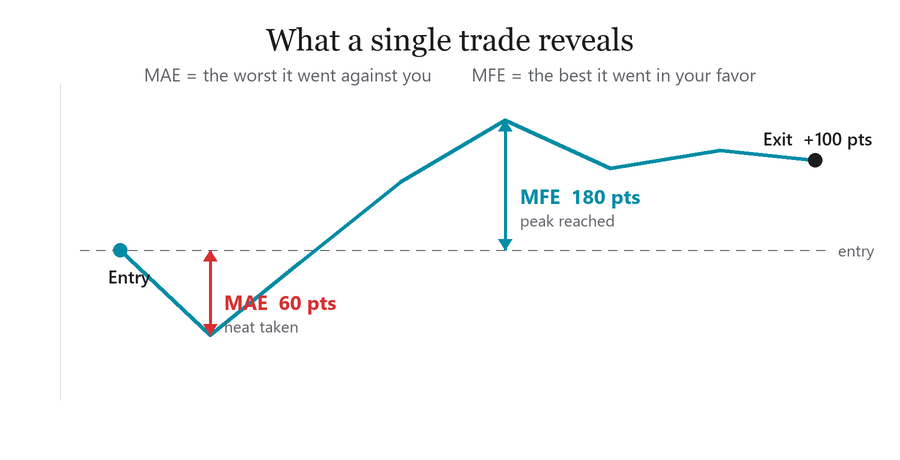
Consider a single long trade. You enter at a price, the market dips a little, recovers, runs up, pulls back, and you exit. Over that lifetime the price traced a path with a lowest point and a highest point.
- The MAE is the distance from your entry to that lowest point — the maximum heat the trade took. For a long, it is entry - lowest_low. For a short, it is highest_high - entry.
- The MFE is the distance from your entry to the highest point — the maximum profit the trade ever showed. For a long, highest_high - entry; for a short, entry - lowest_low.
Both are measured in points and are always reported as non-negative magnitudes: MAE is how far against, MFE is how far in favor, regardless of direction.
A concrete example makes the two tangible. Suppose you buy XAUUSD at 2000.00. Before the trade resolves, price dips to 1999.40 and later peaks at 2001.80, and you exit at 2001.00. The MAE is 60 points (2000.00 − 1999.40), the MFE is 180 points (2001.80 − 2000.00), and you captured 100 points (2001.00 − 2000.00). That last comparison — 100 captured out of 180 available — is efficiency: this trade kept about 56% of its favorable move. One trade tells you little; a few hundred of them, summarized, tell you a great deal.
What each distribution decides
The value is not in any single trade but in the shape of the distributions, and specifically in splitting them by winners and losers. Three readings come straight out of that split.
1. Winners' MAE decides the stop. Look only at the trades that ended in profit, and ask how deep they dipped before recovering. If 90% of your winners never went more than, say, 45 points against you, then a stop tighter than 45 points is cutting winning trades during noise they would have survived. The 90th percentile of winners' MAE is, in effect, the smallest stop that keeps most of your winners alive.
2. Winners' MFE decides the target. Among the same winning trades, how far did price actually run in your favor? The median MFE is a realistic target zone — the move the market typically offered. A take-profit set far beyond it will rarely be reached; one set far below it leaves the bulk of the move uncaptured.
3. Efficiency decides whether the exit is the problem. If your winners show a high median MFE but a low efficiency, you are consistently exiting before the move matures — the entries are fine, the exits are early. If efficiency is high, you are already capturing most of what is on offer.
Losers add the counter-check. If losers' MAE clusters just beyond your current stop, the stop may be sitting precisely in the noise band. If losers showed large MFE before turning into losses — big favorable moves given back — the exit logic, not the entry, is bleeding the account.
There is a fourth, subtler reading in the gap between winners' and losers' MAE. If the two overlap heavily — winners and losers take similar heat before resolving — then MAE alone cannot separate them, and a stop placed on the winners' distribution will also let many losers run further before closing. If they separate cleanly — winners dip shallow, losers dip deep — then a well-placed stop does double duty: it spares the winners and cuts the losers earlier. Which of the two you have is itself a property worth knowing about the strategy.
Why a fixed risk-reward ratio is a guess
The most common way to set a stop and a target is a fixed ratio — risk one, aim for two. It is tidy, but it assumes the market offers the same shape to every strategy, which it does not. A mean-reversion system and a breakout system fill, dip and run in completely different ways; imposing the same 1:2 on both ignores what each one actually experiences.
The MAE and MFE distributions replace the assumption with a measurement. The stop is no longer "half the target" but "beyond where the winners stop dipping". The target is no longer "twice the stop" but "near the move the winners actually reach". The resulting ratio is whatever the data produces — sometimes 1:1.5, sometimes 1:3 — and it is specific to the strategy, the symbol and the regime that generated the trades. A fixed ratio is not always wrong, but there is no reason to prefer a number chosen for its neatness over one derived from the account.
The approach: replay closed history
There are two ways to collect MAE and MFE. One is to track open positions tick by tick and record their extremes live; that works, but it only ever sees trades taken from the moment the tool is attached, so it accumulates slowly. The other — the one used here — is to reconstruct the excursions from the closed history that already exists, so the analysis is immediate and runs on the real track record.
Reconstruction means, for each closed trade, retrieving the M1 candles between its entry time and its exit time and reading the highest high and lowest low over that window. M1 high/low is a reasonably close approximation of the true extreme; it is accurate enough for placement decisions and avoids the cost of replaying every tick.
Choosing history over live tracking is a deliberate trade-off. Live tracking captures exact tick extremes, but it only records trades opened after attachment. For a strategy with months of history, that would delay results by months. Reading the closed record instead delivers the full distribution on the first click, at the price of M1 rather than tick resolution — a price worth paying when the goal is where to place a level, not auditing a single fill.
Two properties matter because they define how to interpret the output. The statistics are deal-based: a trade is rebuilt from its deals, and a position that closes in several parts is consolidated by its position identifier. The excursion window is limited to M1 resolution. Any extreme that occurs and reverses within one minute is represented by that minute's high or low; this granularity is sufficient for stop/target placement.
Input parameters and state
Before the reconstruction can run, a few choices define its scope: how far back to read, an optional magic-number filter to isolate one strategy, and the percentile that drives the stop suggestion. Everything else is reporting.
//--- input parameters
input int    InpLookbackDays = 180;                  // Days of closed history to analyze
input long   InpMagicFilter  = 0;                    // Analyze only this magic (0 = all closed trades)
input int    InpSlPctile     = 90;                   // Suggest SL beyond this percentile of winners' MAE
input bool   InpWriteCsv     = true;                 // Write one row per trade to a CSV file
input string InpCsvName      = "MAE_MFE_Report.csv"; // CSV file name (MQL5\Files)
input int    InpFontSize     = 11;                   // Panel font size
input color  InpTextColor    = C'43,43,43';          // Report body text color (charcoal, on the cream card)
The state is a small set of sample arrays, split by outcome so that winners and losers are never averaged together. Every sample is stored, not summed, because the analysis needs medians and percentiles, which require the full distribution.
//--- one closed round-trip rebuilt from the deal history
struct RoundTrip
  {
   ulong             posId;    // position id that links all the deals of one trade
   double            entry;    // entry (open) price
   double            exit;     // exit (last close) price
   datetime          tIn;      // entry time
   datetime          tOut;     // exit time
   bool              isBuy;    // true = long, false = short
   double            profit;   // net result (profit + swap + commission)
   bool              hasIn;    // an opening deal was found
   bool              hasOut;   // a closing deal was found
  };

//--- per-trade samples (points), split by outcome
double g_winMae[];   // winners: maximum adverse excursion
double g_winMfe[];   // winners: maximum favorable excursion
double g_winEff[];   // winners: efficiency (captured / MFE, %)
double g_losMae[];   // losers: maximum adverse excursion
double g_losMfe[];   // losers: maximum favorable excursion
int    g_nWin = 0;
int    g_nLos = 0;
Rebuilding trades from the deal history
A position in MetaTrader 5 is not a single record; it is a sequence of deals sharing a position identifier — one deal to open it (DEAL_ENTRY_IN), one or more to close it (DEAL_ENTRY_OUT). To rebuild a trade — a round-trip from its opening deal to its closing deal — we group deals by that identifier, take the entry price and time from the opening deal, the exit price and time from the closing deal, and the net result from the sum of profit, swap and commission.
//--- group deals into round-trips by position id
   RoundTrip rt[];
   int total = HistoryDealsTotal();
   for(int i = 0; i < total; i++)
     {
      //--- keep only buy/sell deals on this chart's symbol (and magic, if set)
      ulong ticket = HistoryDealGetTicket(i);
      if(ticket == 0)
         continue;
      if(HistoryDealGetString(ticket, DEAL_SYMBOL) != _Symbol)
         continue;
      long magic = HistoryDealGetInteger(ticket, DEAL_MAGIC);
      if(InpMagicFilter != 0 && magic != InpMagicFilter)
         continue;
      long dtype = HistoryDealGetInteger(ticket, DEAL_TYPE);
      if(dtype != DEAL_TYPE_BUY && dtype != DEAL_TYPE_SELL)
         continue;

      //--- read this deal's key fields
      ulong  posId  = (ulong)HistoryDealGetInteger(ticket, DEAL_POSITION_ID);
      long   entry  = HistoryDealGetInteger(ticket, DEAL_ENTRY);
      double price  = HistoryDealGetDouble(ticket, DEAL_PRICE);
      datetime tdl  = (datetime)HistoryDealGetInteger(ticket, DEAL_TIME);
      double pl     = HistoryDealGetDouble(ticket, DEAL_PROFIT)
                      + HistoryDealGetDouble(ticket, DEAL_SWAP)
                      + HistoryDealGetDouble(ticket, DEAL_COMMISSION);

      //--- first time we see this position id: open a new round-trip slot
      int idx = FindTrip(rt, posId);
      if(idx < 0)
        {
         idx = ArraySize(rt);
         ArrayResize(rt, idx + 1);
         rt[idx].posId  = posId;
         rt[idx].hasIn  = false;
         rt[idx].hasOut = false;
         rt[idx].profit = 0.0;
        }
      //--- the opening deal carries the entry price, time and direction
      if(entry == DEAL_ENTRY_IN)
        {
         rt[idx].entry = price;
         rt[idx].tIn   = tdl;
         rt[idx].isBuy = (dtype == DEAL_TYPE_BUY);
         rt[idx].hasIn = true;
        }
      else
         //--- closing deal(s) carry the exit price and time
         if(entry == DEAL_ENTRY_OUT || entry == DEAL_ENTRY_OUT_BY)
           {
            rt[idx].exit   = price;     // last close price = exit reference
            rt[idx].tOut   = tdl;
            rt[idx].hasOut = true;
           }
      //--- accumulate the net result across all the position's deals
      rt[idx].profit += pl;
     }
Only deals of type buy or sell on the chart's symbol are considered; balance operations and other symbols are filtered out. DEAL_ENTRY is read explicitly rather than assumed: the opening deal sets the entry and the direction, the closing deals set the exit and accumulate the result. Trades that are missing either side after the grouping are simply skipped.
Measuring the excursion
With each trade rebuilt, the excursion is read from the M1 candles spanning its life. The function returns MAE, MFE and the captured move, with the sign handled by direction so that adverse and favorable always mean the same thing for longs and shorts.
//+------------------------------------------------------------------+
//| Replay M1 between entry and exit to get MAE / MFE / captured     |
//+------------------------------------------------------------------+
bool Excursion(const RoundTrip &t, double &maePts, double &mfePts, double &capturedPts)
  {
   datetime stop = (t.tOut < t.tIn) ? t.tIn : t.tOut;
   MqlRates r[];
   int n = CopyRates(_Symbol, PERIOD_M1, t.tIn, stop + 60, r);  // +60s to include the closing minute
   if(n <= 0)
      return(false);

   double hi = t.entry, lo = t.entry;
   for(int i = 0; i < n; i++)
     {
      if(r[i].high > hi)
         hi = r[i].high;
      if(r[i].low < lo)
         lo = r[i].low;
     }

   if(t.isBuy)
     {
      maePts      = (t.entry - lo) / _Point;     // worst dip below entry
      mfePts      = (hi - t.entry) / _Point;     // best run above entry
      capturedPts = (t.exit - t.entry) / _Point; // what we actually kept
     }
   else
     {
      maePts      = (hi - t.entry) / _Point;
      mfePts      = (t.entry - lo) / _Point;
      capturedPts = (t.entry - t.exit) / _Point;
     }
   if(maePts < 0.0)
      maePts = 0.0;
   if(mfePts < 0.0)
      mfePts = 0.0;
   return(true);
  }
The high and low are seeded with the entry price, so a trade that only ever moved one way still produces a zero on the other side rather than a spurious value. Captured is the realized move from entry to exit; dividing it by the MFE gives the efficiency for that trade.
Distributions, not averages
A mean collapses the distribution to a point and hides exactly the part that matters: the tail. An average MAE of 15 points means something very different when the 90th percentile is 20 than when it is 80. The analyzer therefore keeps every sample and computes order statistics on demand.
//+------------------------------------------------------------------+
//| Empirical percentile of a sample array (p in [0, 1])             |
//+------------------------------------------------------------------+
double Pctile(const double &a[], const double p)
  {
   int n = ArraySize(a);
   if(n == 0)
      return(0.0);
   double c[];
   ArrayResize(c, n);
   ArrayCopy(c, a);
   ArraySort(c);
   int rank = (int)MathRound(p * (n - 1));
   if(rank < 0)
      rank = 0;
   if(rank > n - 1)
      rank = n - 1;
   return(c[rank]);
  }
The function sorts a copy of the array, leaving the accumulators in insertion order, and returns the value at the requested rank. The median is simply the 50th percentile, and the stop suggestion uses the configurable InpSlPctile (90 by default) of winners' MAE.
The report and its recommendations
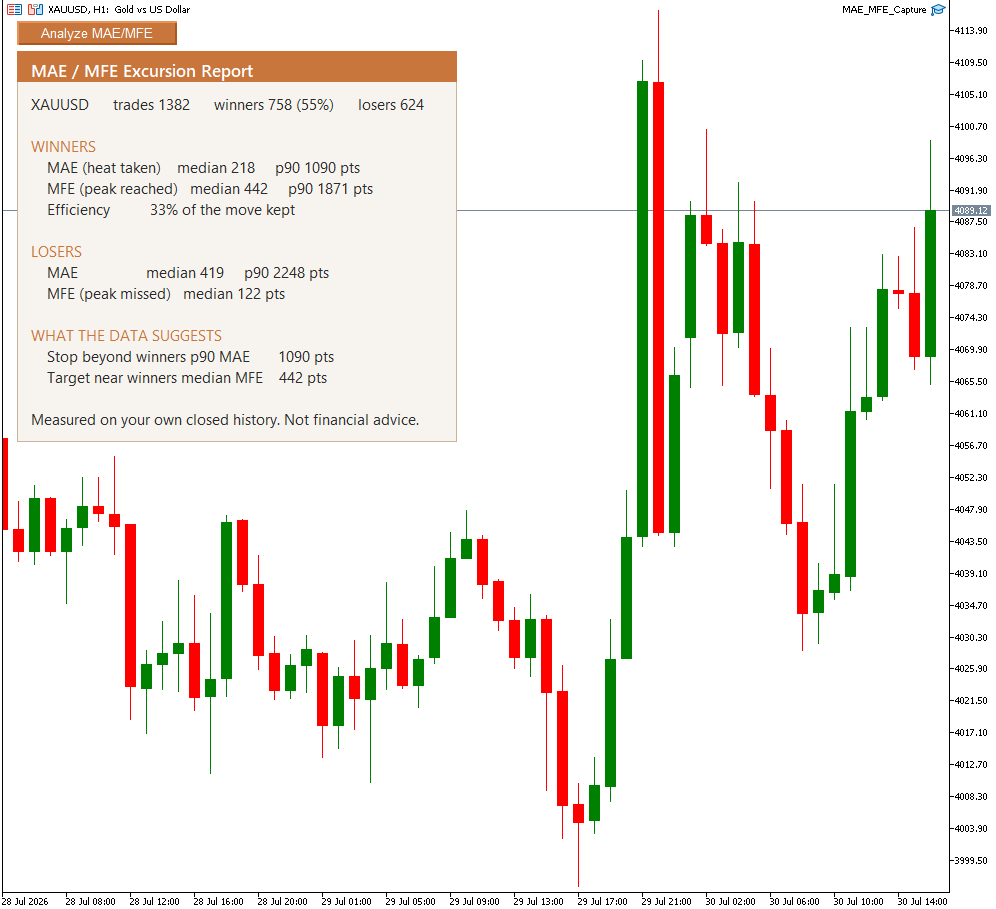
The on-chart report renders the two distributions side by side and, crucially, translates them into two concrete numbers: a stop distance and a target distance derived from the trader's own winning trades.
//+------------------------------------------------------------------+
//| Refresh the on-chart report                                      |
//+------------------------------------------------------------------+
void UpdatePanel()
  {
   int    nTr = g_nWin + g_nLos;
   double wr  = (nTr > 0) ? 100.0 * g_nWin / nTr : 0.0;
   double pSl = InpSlPctile / 100.0;

   string L[];
   AddStr(L, StringFormat("%s      trades %d      winners %d (%.0f%%)      losers %d",
                          _Symbol, nTr, g_nWin, wr, g_nLos));
   AddStr(L, " ");
   AddStr(L, "WINNERS");
   AddStr(L, StringFormat("    MAE (heat taken)    median %.0f     p%d %.0f pts",
                          Median(g_winMae), InpSlPctile, Pctile(g_winMae, pSl)));
   AddStr(L, StringFormat("    MFE (peak reached)   median %.0f     p%d %.0f pts",
                          Median(g_winMfe), InpSlPctile, Pctile(g_winMfe, pSl)));
   AddStr(L, StringFormat("    Efficiency          %.0f%% of the move kept", Median(g_winEff)));
   AddStr(L, " ");
   AddStr(L, "LOSERS");
   AddStr(L, StringFormat("    MAE                 median %.0f     p%d %.0f pts",
                          Median(g_losMae), InpSlPctile, Pctile(g_losMae, pSl)));
   AddStr(L, StringFormat("    MFE (peak missed)   median %.0f pts", Median(g_losMfe)));
   AddStr(L, " ");
   AddStr(L, "WHAT THE DATA SUGGESTS");
   AddStr(L, StringFormat("    Stop beyond winners p%d MAE       %.0f pts",
                          InpSlPctile, Pctile(g_winMae, pSl)));
   AddStr(L, StringFormat("    Target near winners median MFE    %.0f pts", Median(g_winMfe)));
   AddStr(L, " ");
   AddStr(L, "Measured on your own closed history. Not financial advice.");

   int x     = 14;
   int yTop  = 52;
   int hdrH  = 30;
   int pad   = 12;
   int lh    = InpFontSize + 10;
   int k     = ArraySize(L);
   int cardW = 440;
   int cardH = hdrH + pad + k * lh + pad;

//--- a warm card with a terracotta header: the report's own visual identity
   SetRect("MMA_BG",  x, yTop, cardW, cardH, C'247,244,239', C'201,180,153');
   SetRect("MMA_HDR", x, yTop, cardW, hdrH,  C'200,118,60',  C'200,118,60');
   SetLabel("MMA_TITLE", x + 14, yTop + 7, "MAE / MFE Excursion Report",
            InpFontSize + 2, clrWhite, "Segoe UI Semibold");

   int by = yTop + hdrH + pad;
   for(int i = 0; i < MM_MAX_LABELS; i++)
     {
      if(i < k)
        {
         color clr = InpTextColor;
         if(L[i] == "WINNERS" || L[i] == "LOSERS" || L[i] == "WHAT THE DATA SUGGESTS")
            clr = C'200,118,60';
         SetLabel("MMA_L" + (string)i, x + 14, by + i * lh, L[i], InpFontSize, clr, "Segoe UI");
        }
      else
         ObjectDelete(0, "MMA_L" + (string)i);
     }
  }
The two suggestions are intentionally conservative and explainable. The stop sits just beyond where most winners stopped dipping, so it survives the noise that winning trades routinely take. The target sits near the move winners typically reached, so it is asking for what the market has actually been giving rather than a number picked from the air.
The CSV report
The panel is for a glance; the per-trade detail goes to a CSV for offline work, one row per closed trade with its excursions and efficiency.
//+------------------------------------------------------------------+
//| Append one round-trip to the CSV report                          |
//+------------------------------------------------------------------+
void AppendCsv(const RoundTrip &t, const double mae, const double mfe, const double eff)
  {
   if(!InpWriteCsv)
      return;
   if(g_csv == INVALID_HANDLE)
      OpenCsv();
   if(g_csv == INVALID_HANDLE)
      return;
   FileWrite(g_csv,
             (string)t.posId,
             (t.isBuy ? "BUY" : "SELL"),
             TimeToString(t.tIn,  TIME_DATE | TIME_MINUTES),
             TimeToString(t.tOut, TIME_DATE | TIME_MINUTES),
             DoubleToString(t.entry, _Digits),
             DoubleToString(t.exit,  _Digits),
             DoubleToString(t.profit, 2),
             DoubleToString(mae, 0),
             DoubleToString(mfe, 0),
             DoubleToString(eff, 0));
   FileFlush(g_csv);
  }
With the file open in a spreadsheet you can do what the panel summarizes: filter winners, plot the MAE distribution, sort by efficiency to find the trades that gave the most back. The listing in this article shows the functions that carry the logic; the small helpers — the dynamic-array appenders, the button and the label routines — are in the attached source, which compiles with 0 errors and 0 warnings.
A worked example
Run over 180 days of XAUUSD trades, the analyzer reports:
+---------------------------------------------------------+
|  MAE / MFE Excursion Report                             |
+---------------------------------------------------------+
   XAUUSD      trades 1382     winners 758 (55%)      losers 624

   WINNERS
       MAE (heat taken)    median 218    p90 1090 pts
       MFE (peak reached)  median 442    p90 1871 pts
       Efficiency          33% of the move kept

   LOSERS
       MAE                 median 419    p90 2248 pts
       MFE (peak missed)   median 122 pts

   WHAT THE DATA SUGGESTS
       Stop beyond winners p90 MAE       1090 pts
       Target near winners median MFE    442 pts
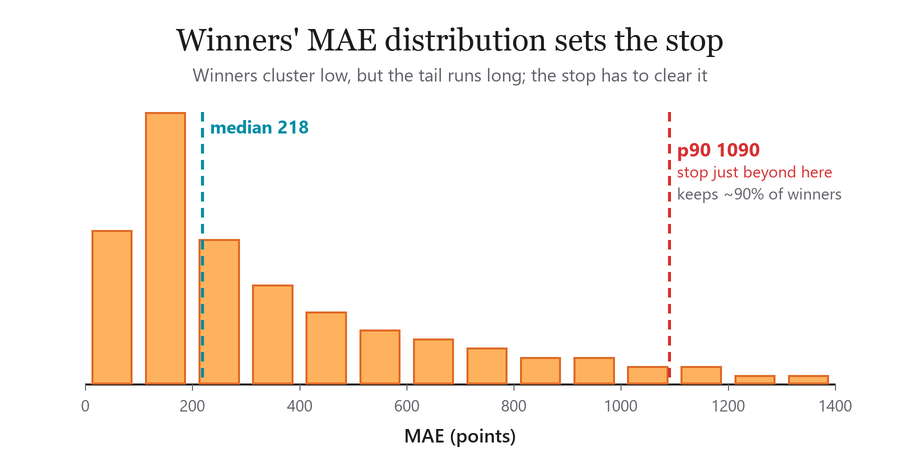
Read it from the top. Winners cluster low, with a median of only 218 points of heat, but the tail runs long: 90% of them stayed within 1090, and it is that tail, not the median, that a stop has to clear to keep the winners alive. The target side is where the report speaks loudest. Winners typically reached 442 points, yet the median efficiency is just 33%, so a winning trade is banking barely a third of the move it was handed. The entries are finding real moves; the exits are leaving most of them on the table.
The losers' line supports the reading from the other side: losers dipped far deeper than winners, a median of 419 against 218, and gave back almost nothing, a median favorable move of only 122, so the two groups separate cleanly by heat rather than blurring together. The conclusion is specific and testable: the exit is the first thing to fix. Push the target toward the 442 points winners actually reach, keep the stop out beyond the p90 where it is not clipping the winners, and re-measure whether the extra captured move outweighs the trades that no longer get there.
Practical use
The analyzer is built to guide one specific decision, where to place the stop-loss and take-profit, and it works best through incremental change: move one level at a time, then re-measure its effect on the trades that follow. For the stop, if the suggested width exceeds your current one, widen toward the winners' p90 MAE while tracking win rate and average winner size and making sure the average loss does not rise meaningfully. For the target, if efficiency is low while MFE stays high, the target may be set too early, so push it toward the median MFE and check whether the extra captured points outweigh the trades that now fail to reach the closer level. Reliable percentiles need a few hundred trades; until then, treat the output as directional rather than definitive.
To run it, compile the EA in MetaEditor, attach it to the chart of the symbol whose trades you want to study, set the lookback window and the magic filter if you run several strategies on the account, and start the analysis. Use the suggested levels as testable hypotheses rather than fixed rules, and confirm each change by re-running the analyzer on the trades that follow. Keep the limitations in mind: excursions are read from M1 candles rather than ticks; positions are consolidated by position id, so a trade scaled in or out is summarized to one entry and exit; past distributions reflect the volatility regime that produced them and should be re-checked periodically; and the tool is a measurement instrument, not a strategy or a forecast, so it reports where your levels have historically been tested, not where the market will move next.
Conclusion
MAE and MFE convert an under-measured decision — where to place the stop and the target — into a repeatable measurement. Winners' MAE gives a defensible lower bound on stop distance: the percentile you choose reflects how many winners you are willing to see nicked by noise. Winners' MFE gives a realistic target: the median expresses what the market has typically offered. Efficiency, the captured move over the MFE, diagnoses whether exits are systematically early. The analyzer delivers all of this as an on-chart summary and a per-trade CSV, so you can filter, inspect outliers and build tests.
Treat the suggestions as falsifiable hypotheses, not prescriptions: change one level at a time, keep trading, and re-run the EA to see whether win rate, average winner and the distributions moved as expected. Keep the limits in mind too: M1 only approximates the tick extreme, and percentiles need a large enough sample to stabilize. This is a diagnostic instrument that lets your own history decide where the stop and the target should sit. If its recommendations match your current settings, that too is a useful finding, one that points further work away from the exits and toward other parts of the strategy.
Disclaimer: this tool is for analysis and diagnostics. It is not financial advice.
Warning: All rights to these materials are reserved by MetaQuotes Ltd. Copying or reprinting of these materials in whole or in part is prohibited.
This article was written by a user of the site and reflects their personal views. MetaQuotes Ltd is not responsible for the accuracy of the information presented, nor for any consequences resulting from the use of the solutions, strategies or recommendations described.

 Exporting MetaTrader 5 Open Positions to a Live-Refreshing HTML Dashboard
 Forecasting a Conditional Distribution Using MLP
 How to Research a Trading Idea: A Range Breakout Strategy Case Study
 Symbolic Aggregate Approximation (SAX) in MQL5: Historical Analog Search and Forecasting

- Free trading apps
- Over 8,000 signals for copying
- Economic news for exploring financial markets
You agree to website policy and terms of use
Moderator warning: AI-generated comment
Bug: CSV report duplicates rows on every re-run
The g_csv file handle is opened once and never closed between calls to RunAnalysis() — only OnDeinit() closes it. Since OpenCsv() opens the file with FILE_WRITE | FILE_READ and then does FileSeek(g_csv, 0, SEEK_END) , every time the "Analyze MAE/MFE" button is clicked (or RunAnalysis() runs again for any other reason), the entire history is replayed and AppendCsv() writes every round-trip again — appended after whatever was already written in the previous run. Click the button three times and you get the same trades duplicated three times in MAE_MFE_Report.csv , with no truncation and no dedup, silently corrupting the report for anyone using the CSV downstream (Excel, Python, etc.).
Fix: close and reset the file handle at the start of every RunAnalysis() call, and open the file with plain FILE_WRITE (which truncates) instead of FILE_WRITE | FILE_READ + seek-to-end.
// In RunAnalysis(), right before HistorySelect(): if(g_csv != INVALID_HANDLE) { FileClose(g_csv); g_csv = INVALID_HANDLE; }
// In OpenCsv(): g_csv = FileOpen(InpCsvName, FILE_WRITE | FILE_SHARE_READ | FILE_CSV | FILE_ANSI, ','); if(g_csv == INVALID_HANDLE) { PrintFormat("MAE/MFE: could not open %s (error %d).", InpCsvName, GetLastError()); return; } FileWrite(g_csv, "pos_id", "side", "entry_time", "exit_time", "entry", "exit", "result", "mae_points", "mfe_points", "efficiency_pct");
With this, each "Analyze" click produces a fresh CSV covering exactly that run's trades, instead of accumulating duplicates indefinitely.