

Motifs and Discords: Building a Matrix Profile from Scratch
 1 058
1 058
 0
0

Contents
- Introduction
- What the finished library shows
- Motifs and discords: the idea
- The z-normalized distance and its rolling statistics
- MASS: a sliding dot product through the FFT
- STOMP: the whole profile in O(L^2)
- The numerical trap that only real prices reveal
- Reading the profile: motifs and discords
- The facade: two lines to a profile
- Checking it against stumpy
- The indicator
- A demonstration Expert: gating trades on discords
- Conclusion
Introduction
Every trader eventually asks the chart two questions. Has this shape happened before, and if so, what came next? And is what just happened normal, or is it a break from everything the market has been doing? The first question is about repetition. The second is about anomaly. Most indicators answer neither directly: a moving average smooths, an oscillator bounds, but nothing on the standard palette says "this 48-bar stretch is a near-copy of one from three months ago" or "this is the single most unusual window on the chart".
The Matrix Profile answers both, and it does so without you telling it what to look for. Introduced by Keogh and colleagues around 2016, it has become the backbone of modern time series data mining. Given one series and a window length, it computes, for every window, the distance to its nearest neighbor anywhere else in the series. A low value means the window has a close twin, so it is part of a repeated pattern, called a motif. A high value means the window has no twin, so it is an anomaly, called a discord. One pass, two readings, no parameters to tune beyond the window length itself.
MQL5 has one or two articles on Dynamic Time Warping, but nothing that computes a Matrix Profile. This article closes that gap with a small, tested library you can drop into any project. The work is code-first. The library is built and verified to machine precision against an independent reference before any of the writeup is committed. That order matters, because the interesting part of this build was not the algorithm on paper, it was a numerical failure that only appeared the first time the code met a real gold price.
By the end you will have six header files that turn a price array into a profile, an indicator that draws the profile in a subwindow and flags discords on the chart, and a demonstration Expert Advisor that gates its entries on the live anomaly score. The library is the heart of the article. The indicator and the Expert are how you read and use what it produces.
What the finished library shows
Before the theory, here is the payoff. Attach the finished indicator to a EURUSD H1 chart and it computes one Matrix Profile over the last several hundred bars, then draws it in a subwindow. The line dips where the market repeated a shape and spikes where it did something new, and the top discords, each a roughly two-day stretch unlike anything else nearby, are marked on the chart.
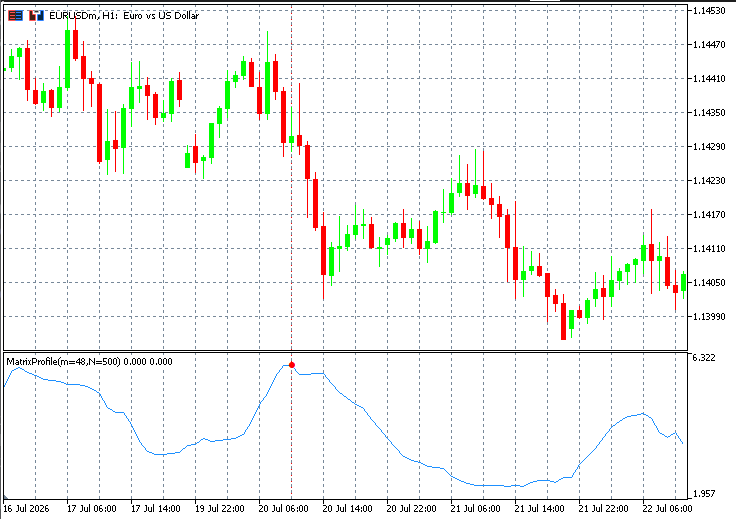
Fig. 1. The Matrix Profile indicator on EURUSD H1; the subwindow line dips at repeated shapes and spikes where the market did something new, with discord markers on the most unusual stretches in view
The numbers behind that picture are worth stating, because they set this tool apart from a rare-event detector. On EURUSD H1, using a 48-bar window over 500 bars, the profile ranges from about 2.3 (tightest repeated pair) to about 6.3 (strongest discord), with a median around 4.4. The theoretical ceiling is sqrt(2*48) ≈ 9.8. The whole profile, 453 windows and roughly 194,000 distance evaluations, computes in a handful of milliseconds per recompute, below what the millisecond timer can resolve. The signal is rich and always present: unlike a bubble detector that reads zero on most days, the Matrix Profile always has a motif and a discord to show you. That is what this article delivers. The rest explains how.
Motifs and discords: the idea
Fix a window length m. Slide it along the series to get every length-m subsequence. There are L = n - m + 1 of them for a series of length n. For each subsequence, find the one other subsequence it most resembles, and record that distance. The array of those distances, indexed by window position, is the Matrix Profile P. Alongside it we keep the index array I, which remembers where each nearest neighbor was found.
The figure below shows the two readings on a toy series. Two stretches carry the same bump, so each is the other's nearest neighbor at a small distance: that pair is a motif. One stretch carries a shape that appears nowhere else, so its nearest neighbor is far away: that is a discord.
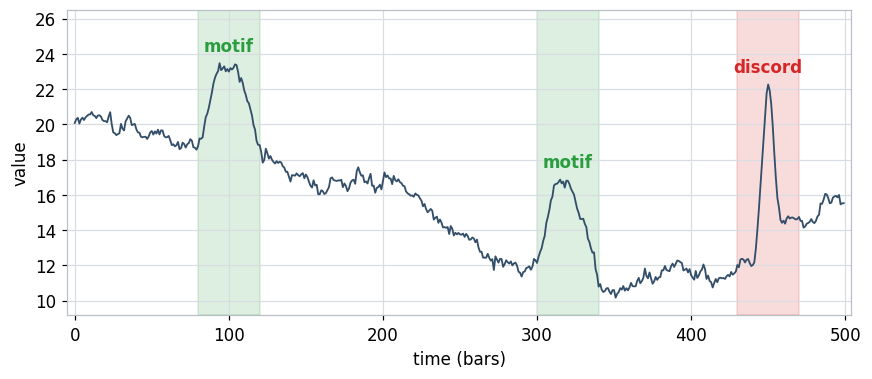
Fig. 2. A motif is a shape the series repeats, the two matching bumps, while a discord is a window unlike anything else, the lone spike on the right
Two details make the definition usable rather than trivial. First, "resembles" has to be scale and offset free. A rally from 1900 to 1950 and a rally from 2900 to 2950 are the same shape at different price levels, and the distance must treat them as such. The fix is to z-normalize each window before comparing: subtract its mean, divide by its standard deviation. Second, a window overlaps itself heavily with its immediate neighbors, and those overlaps would always be the closest match. We exclude them with a small exclusion zone around each window, so the nearest neighbor is a genuine echo somewhere else, not the same window shifted by a bar.
The z-normalized distance and its rolling statistics
With z-normalization in place, the distance between window i and window j is the Euclidean distance between their normalized forms,
D(i,j) = sqrt( sum_k ( zi_k - zj_k )^2 ). Expand that square and the only term that couples the two windows is their dot product. The result is a closed form that removes the per-element loop:
D(i,j) = sqrt( 2m ( 1 - rho ) ), rho = ( QT - m * mu_i * mu_j ) / ( m * sig_i * sig_j )
Here QT is the raw dot product of the two windows, mu and sig are the window mean and population standard deviation, and rho is the Pearson correlation of the two windows. So every distance needs only a dot product plus the mean and standard deviation of each window. Those statistics do not have to be recomputed window by window. From prefix sums of the series and its square, the mean and variance of every length-m window fall out in a single O(n) pass. The library computes them once, up front, and the variance is clamped at zero before the square root so that rounding dust on a flat window can never produce a negative under the root:
//+------------------------------------------------------------------+
//| Rolling mean and population std via cumulative sums (O(N))       |
//|                                                                  |
//|  var_i = (1/m) S2 - mean_i^2, clamped at zero so rounding dust   |
//|  on a flat window can never produce a negative under the root.   |
//+------------------------------------------------------------------+
bool CMPData::RollingStats(int m, double &mu[], double &sig[]) const
  {
   int L = SubCount(m);
   if(L <= 0)
     {
      Print("MPData::RollingStats - subsequence length does not fit the series");
      return false;
     }

//--- prefix sums of x and x^2:  cs[k] = sum_{t<k} x_t
   double cs[], cs2[];
   ArrayResize(cs,  m_N + 1);
   ArrayResize(cs2, m_N + 1);
   cs[0]  = 0.0;
   cs2[0] = 0.0;
   for(int i = 0; i < m_N; i++)
     {
      cs[i + 1]  = cs[i]  + m_x[i];
      cs2[i + 1] = cs2[i] + m_x[i] * m_x[i];
     }

   ArrayResize(mu,  L);
   ArrayResize(sig, L);
   double invm = 1.0 / m;
   for(int i = 0; i < L; i++)
     {
      double s  = cs[i + m]  - cs[i];
      double s2 = cs2[i + m] - cs2[i];
      double mean = s * invm;
      double var  = s2 * invm - mean * mean;
      if(var < 0.0)
         var = 0.0;
      mu[i]  = mean;
      sig[i] = MathSqrt(var);
     }
   return true;
  }
CMPData stores the series and grows its buffer using amortized doubling (instead of resizing by one inside a loop). With the statistics in hand, the whole problem reduces to computing dot products, and that is where the speed comes from.
MASS: a sliding dot product through the FFT
The sliding dot product of a query against every position of the series is a convolution, and a convolution is a pair of forward FFTs, a pointwise product, and one inverse FFT. That is MASS, Mueen's Algorithm for Similarity Search, and it costs O(n log n) regardless of the window length. It rests on one primitive, a from-scratch, radix-2 Cooley–Tukey FFT. The transform only accepts power-of-two lengths, which is not a limitation here because we control the padding and pad up to a power of two anyway. Twiddle factors are evaluated directly with cosine and sine per butterfly rather than carried as a running product, which costs a few extra trig calls, negligible against the O(L^2) self-join, and buys a transform that does not drift on larger sizes:
//+------------------------------------------------------------------+
//| Iterative radix-2 Cooley-Tukey, decimation in time               |
//+------------------------------------------------------------------+
bool CMPTransform::FFT(double &re[], double &im[], bool inverse)
  {
   int n = ArraySize(re);
   if(n != ArraySize(im))
     {
      Print("MPTransform::FFT - real and imaginary parts differ in length");
      return false;
     }
   if(n < 1 || (n & (n - 1)) != 0)
     {
      PrintFormat("MPTransform::FFT - length %d is not a power of two", n);
      return false;
     }
   if(n == 1)
      return true;

//--- bit-reversal permutation
   int j = 0;
   for(int i = 1; i < n; i++)
     {
      int bit = n >> 1;
      for(; (j & bit) != 0; bit >>= 1)
         j ^= bit;
      j ^= bit;
      if(i < j)
        {
         double tr = re[i];
         re[i] = re[j];
         re[j] = tr;
         double ti = im[i];
         im[i] = im[j];
         im[j] = ti;
        }
     }

//--- butterflies, stage by stage
   double sign = (inverse ? 1.0 : -1.0);
   for(int len = 2; len <= n; len <<= 1)
     {
      double ang  = sign * 2.0 * M_PI / len;
      int    half = len >> 1;
      for(int start = 0; start < n; start += len)
        {
         for(int k = 0; k < half; k++)
           {
            double wr = MathCos(ang * k);
            double wi = MathSin(ang * k);
            int a = start + k;
            int b = a + half;
            double tr = wr * re[b] - wi * im[b];
            double ti = wr * im[b] + wi * re[b];
            re[b] = re[a] - tr;
            im[b] = im[a] - ti;
            re[a] = re[a] + tr;
            im[a] = im[a] + ti;
           }
        }
     }

//--- inverse transform carries the 1/N normalization
   if(inverse)
     {
      double invn = 1.0 / n;
      for(int i = 0; i < n; i++)
        {
         re[i] *= invn;
         im[i] *= invn;
        }
     }
   return true;
  }
The transform runs in two phases. A bit-reversal permutation first reorders the array in place, pairing every index with the number whose binary digits are its own reversed. Then log2(n) butterfly stages combine adjacent blocks, doubling the block length at each stage, with a twiddle factor that rotates by a fixed angle across each block. The inverse transform is the same machinery with the rotation direction flipped and one final division by n, which is the single branch guarded by the inverse flag. Everything is done on plain double arrays for the real and imaginary parts, so there is no dependency outside the standard library.
On top of the transform, MASS reverses the query, transforms both signals, multiplies, and transforms back. Padding is the key detail. A sliding dot product is a linear convolution, and a length-p circular convolution wraps its tail around, corrupting only the first m-1 output positions. The values we read, positions m-1 through n-1, are the exact linear sliding dot products, so a plain radix-2 transform padded to the next power of two is enough, with no mixed-radix path:
//+------------------------------------------------------------------+
//| Sliding dot product via FFT convolution                          |
//+------------------------------------------------------------------+
bool CMPMass::SlidingDot(const double &Q[], int m,
                         const double &T[], int n, double &qt[])
  {
   if(m <= 0 || n <= 0 || m > n)
     {
      Print("MPMass::SlidingDot - bad lengths");
      return false;
     }

   int p = CMPTransform::NextPow2(n);

   double tre[], tim[], qre[], qim[];
   ArrayResize(tre, p);
   ArrayResize(tim, p);
   ArrayResize(qre, p);
   ArrayResize(qim, p);
   ArrayInitialize(tre, 0.0);
   ArrayInitialize(tim, 0.0);
   ArrayInitialize(qre, 0.0);
   ArrayInitialize(qim, 0.0);

   for(int i = 0; i < n; i++)
      tre[i] = T[i];
//--- reversed query, zero-padded
   for(int i = 0; i < m; i++)
      qre[i] = Q[m - 1 - i];

   if(!CMPTransform::FFT(tre, tim, false))
      return false;
   if(!CMPTransform::FFT(qre, qim, false))
      return false;

//--- pointwise complex product T(f) * Q(f)
   for(int i = 0; i < p; i++)
     {
      double r  = tre[i] * qre[i] - tim[i] * qim[i];
      double im = tre[i] * qim[i] + tim[i] * qre[i];
      tre[i] = r;
      tim[i] = im;
     }
   if(!CMPTransform::FFT(tre, tim, true))
      return false;

   int L = n - m + 1;
   ArrayResize(qt, L);
   for(int jj = 0; jj < L; jj++)
      qt[jj] = tre[m - 1 + jj];   // valid, wrap-safe region
   return true;
  }
The figure below shows MASS in action: one query window on top, and below it the distance from that query to every position. The profile falls to zero at the query itself and again at the matching window, and rises everywhere the shape does not fit.
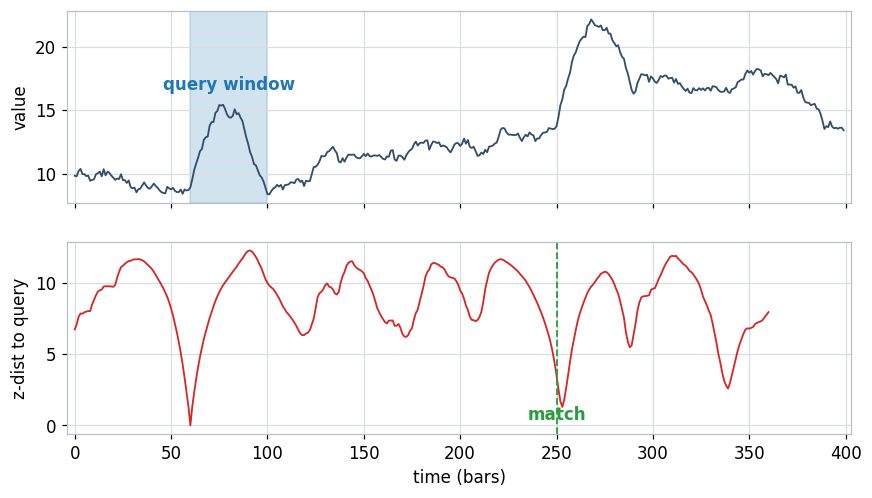
Fig. 3. MASS in one query: the top panel highlights a query window, the bottom panel is its distance to every position, falling to zero at the query itself and again at the matching window
STOMP: the whole profile in O(L^2)
MASS gives the distance profile of one window. The Matrix Profile needs the distance profile of every window, then the minimum of each. Running MASS L times would work, at O(L * n log n). STOMP does better by noticing that consecutive rows of the dot-product matrix are almost identical. Once you have the dot products for window i, the dot products for window i+1 follow from a one-line recurrence, because sliding the window by one bar drops one product and adds another:
QT[i][j] = QT[i-1][j-1] - T[i-1]*T[j-1] + T[i+m-1]*T[j+m-1]
So the first row of dot products is one MASS call, and every row after it costs O(L). The whole self-join is O(L^2) with no dependence on the window length. The Compute method sets up the rolling statistics and the first row, then walks down the series, advancing the dot-product row by the recurrence and scoring it against every admissible column:
//+------------------------------------------------------------------+
//| Full matrix profile via STOMP                                    |
//+------------------------------------------------------------------+
bool CMPStomp::Compute(const CMPData &data, int m, SMPProfile &out)
  {
   out.Reset();
   m_lastEvals = 0;

   int n = data.Size();
   int L = data.SubCount(m);
   if(L <= 0)
     {
      Print("MPStomp::Compute - subsequence length does not fit the series");
      return false;
     }
   if(L < 2)
     {
      Print("MPStomp::Compute - need at least two subsequences");
      return false;
     }

   double T[];
   data.GetSeries(T);

   double mu[], sig[];
   if(!data.RollingStats(m, mu, sig))
      return false;

//--- first row of sliding dot products, and a kept copy of it:
//--- QTfirst[i] = dot(window 0, window i) = dot(window i, window 0),
//--- which is exactly QT[i][0] used to restart each row.
   double Q0[];
   ArrayResize(Q0, m);
   for(int k = 0; k < m; k++)
      Q0[k] = T[k];

   double QT[], QTfirst[];
   if(!CMPMass::SlidingDot(Q0, m, T, n, QT))
      return false;
   ArrayResize(QTfirst, L);
   for(int i = 0; i < L; i++)
      QTfirst[i] = QT[i];

//--- profile storage
   ArrayResize(out.P, L);
   ArrayResize(out.I, L);
   for(int i = 0; i < L; i++)
     {
      out.P[i] = MP_NODIST;
      out.I[i] = -1;
     }

   int excl = ExclusionZone(m);

//--- helper inlined: score row i against all admissible j
//--- (kept as an explicit loop; MQL5 has no nested closures)
   for(int i = 0; i < L; i++)
     {
      if(i > 0)
        {
         //--- advance QT one row via the diagonal recurrence
         double aOld = T[i - 1];
         double aNew = T[i + m - 1];
         for(int j = L - 1; j >= 1; j--)
            QT[j] = QT[j - 1] - aOld * T[j - 1] + aNew * T[j + m - 1];
         QT[0] = QTfirst[i];
        }

      double muI  = mu[i];
      double sigI = sig[i];
      double bestD = MP_NODIST;
      int    bestJ = -1;
      for(int j = 0; j < L; j++)
        {
         if(j >= i - excl && j <= i + excl)
            continue;
         m_lastEvals++;
         double d;
         if(sigI <= 1e-12 || sig[j] <= 1e-12)
           {
            d = MathSqrt(2.0 * m);   // constant window: neutral distance
           }
         else
           {
            double rho = (QT[j] - m * muI * mu[j]) / (m * sigI * sig[j]);
            if(rho > 1.0)
               rho = 1.0;
            double d2 = 2.0 * m * (1.0 - rho);
            if(d2 < 0.0)
               d2 = 0.0;
            d = MathSqrt(d2);
           }
         if(d < bestD)
           {
            bestD = d;
            bestJ = j;
           }
        }
      out.P[i] = bestD;
      out.I[i] = bestJ;
     }

   out.n  = n;
   out.m  = m;
   out.L  = L;
   out.ok = true;
   return true;
  }
Three details in that loop earn their keep. The exclusion zone is ceil(m/4), the same one-quarter rule the reference implementations use, so our profile is directly comparable to theirs. The constant-window branch guards against a flat subsequence, whose standard deviation is zero and whose correlation is therefore undefined; we report the neutral distance sqrt(2m) so a flat window never masquerades as a perfect match. The rho clamp at 1 stops a rounding error from sending a zero distance imaginary under the square root. The figure below shows the finished profile on a series that repeats a shape many times and then breaks it once: the profile stays low across the repeats and spikes on the single alien segment.
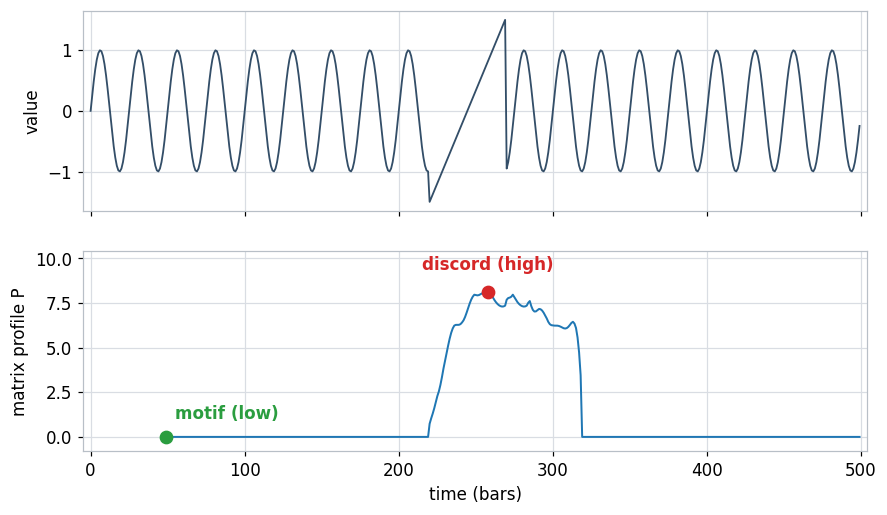
Fig. 4. The matrix profile of a series that repeats a shape and breaks it once; the profile stays low across every repeat and spikes only on the single alien segment
The numerical trap that only real prices reveal
The distance identity is exact in real arithmetic and dangerous in floating point. Look again at rho. The numerator subtracts m*mu_i*mu_j from QT. On a series that sits near a large price level, both of those terms are enormous and nearly equal, while their difference is a small variance-scale number. Subtracting two large nearly-equal quantities is catastrophic cancellation: it throws away significant digits, and the square root then amplifies whatever error survives, because sqrt has an infinite slope at zero. The distances that suffer most are exactly the ones we care about, the small ones that mark motifs.
This did not show up in the Python prototype, whose test series happened to sit near zero. It showed up the first time the MQL5 test ran on a series built around 100, and it would have been far worse on gold near 2000. The self-distance of a window against itself, which must be zero, came out around 0.00002. The fix is almost embarrassing in its simplicity. The z-normalized distance is invariant to a constant shift of the whole series, so we subtract the series mean once, at build time, before anything else touches the data. Nothing changes mathematically, and every magnitude in the cancellation shrinks:
//+------------------------------------------------------------------+
//| Copy a slice of the source series                                |
//+------------------------------------------------------------------+
bool CMPData::Build(const double &src[], int srcLen, int start, int count)
  {
   if(count < 4)
     {
      Print("MPData::Build - series too short (need at least 4 points)");
      m_N = 0;
      return false;
     }
   if(start < 0 || srcLen <= 0 || start + count > srcLen)
     {
      Print("MPData::Build - window out of range");
      m_N = 0;
      return false;
     }

   EnsureCapacity(count);
   double mean = 0.0;
   for(int i = 0; i < count; i++)
     {
      m_x[i] = src[start + i];
      mean += m_x[i];
     }
   mean /= count;

//--- Mean-center the window. Every distance the library computes is
//--- z-normalized, hence invariant to a constant shift of the series,
//--- so this changes nothing mathematically. It is essential
//--- numerically: the identity D = sqrt(2m(1 - rho)) recovers a
//--- variance-scale number by subtracting m*mu_i*mu_j from the dot
//--- product QT (~ m*price^2). On real price data (gold ~ 2000) that
//--- cancellation destroys 6-7 digits and the near-zero distances of
//--- genuine motifs come out as noise. Centering first keeps every
//--- magnitude small, so QT and the rolling stats stay well
//--- conditioned. Measured: on a gold-scale (offset 2000) series the
//--- profile error vs stumpy falls from 1.9e-7 to 1e-11 with centering.
   for(int i = 0; i < count; i++)
      m_x[i] -= mean;

   m_N = count;
   return true;
  }
The figure below measures the effect directly. It plots the self-distance error, which should be zero, against the price level of the series. On the raw series the error climbs with the offset and reaches roughly 0.0001 at gold-scale levels. On the mean-centered series it stays near the floor of double precision across the whole range. The decisive evidence that this was our bug and not something inherent is that the reference package never degraded on offset data at all: it was already doing the equivalent internally. Centering also keeps the prefix sums in the rolling statistics well conditioned, which is a second reason it earns its place.
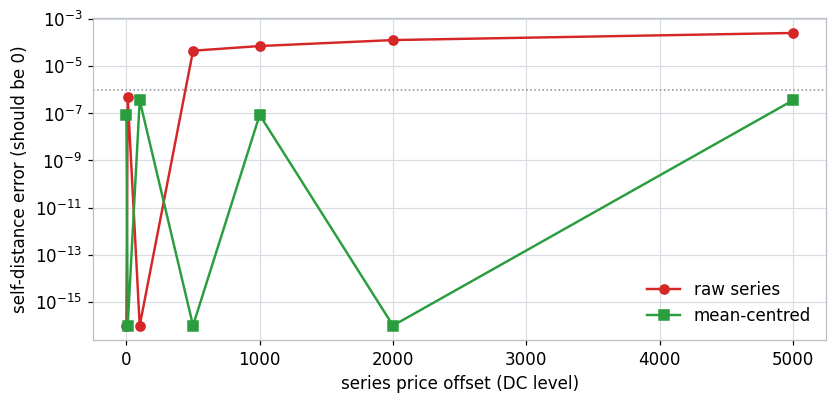
Fig. 5. Self-distance error against the price level of the series; on the raw series it climbs toward gold-scale offsets, while mean-centering holds it near the floor of double precision
Reading the profile: motifs and discords
The profile and its index array are the raw output. Turning them into a ranked list of motifs and discords is a small extraction step, and it needs one guard: results have to be distinct events, not the same event reported many times. A strong discord bleeds into its neighbors, so the second, third, and fourth highest values often sit one bar apart from the first. We mask a neighborhood of plus or minus m/2 around each pick before taking the next. Discord extraction walks the profile from the highest value down, recording each pick and blanking its neighborhood:
//+------------------------------------------------------------------+
//| Top-k discords, most anomalous first, neighborhoods masked       |
//+------------------------------------------------------------------+
int SMPProfile::Discords(int k, SMPDiscord &out[]) const
  {
   ArrayResize(out, 0);
   if(!ok || L <= 0 || k <= 0)
      return 0;

   double work[];
   ArrayResize(work, L);
   for(int i = 0; i < L; i++)
      work[i] = (Valid(i) ? P[i] : -1.0);   // -1 marks "taken / invalid"

   int ez = MathMax(1, m / 2);
   int found = 0;
   for(int r = 0; r < k; r++)
     {
      int    pick = -1;
      double best = -1.0;
      for(int i = 0; i < L; i++)
         if(work[i] >= 0.0 && work[i] > best)
           {
            best = work[i];
            pick = i;
           }
      if(pick < 0)
         break;

      ArrayResize(out, found + 1);
      out[found].idx  = pick;
      out[found].dist = P[pick];
      found++;

      int lo = MathMax(0, pick - ez);
      int hi = MathMin(L - 1, pick + ez);
      for(int i = lo; i <= hi; i++)
         work[i] = -1.0;
     }
   return found;
  }
Motif extraction is the mirror image: it walks from the lowest value up, and because a motif is a pair, it masks the neighborhoods of both ends, the window and its recorded neighbor, before taking the next. Both live on the result structure SMPProfile, so the caller never touches the raw arrays to get a ranked answer.
The facade: two lines to a profile
The six headers behind this, the data window, the transform, MASS, STOMP, and the profile result, are tied together by one facade class, CMatrixProfile. It exists so the common path is two calls, compute and read, while the stages stay reachable for callers who need to retune the exclusion zone or read the cost meter. Computing a profile over a whole series is one method:
//+------------------------------------------------------------------+
//| Compute over the whole series                                    |
//+------------------------------------------------------------------+
bool CMatrixProfile::ComputeSeries(const double &src[], int count,
                                   int m, SMPProfile &out)
  {
   return Compute(src, count, 0, count, m, out);
  }
From there a caller writes two lines: call ComputeSeries to fill an SMPProfile, then ask that profile for its Motifs or its Discords. Everything in the previous sections happens behind those two calls.
Checking it against stumpy
A from-scratch numerical library is only as trustworthy as what it is measured against. The reference here is stumpy, the widely used Python Matrix Profile package, and it has one property that makes it ideal: it is deterministic. It returns the same profile every time, so we can demand exact equality rather than settling for a statistical resemblance. That is a stronger position than some libraries allow, where the reference itself cannot reproduce its own answer.
The verification runs in layers. At the lowest level, the FFT is checked against a direct O(N^2) discrete Fourier transform, and the sliding dot product against a brute-force sum. One level up, the MASS distance profile and the full STOMP profile are checked against a plain double loop that computes every z-normalized distance the slow, obvious way. The MASS distance profile matches the brute-force computation across a sweep of lengths, with the worst near-zero self-distance at about 9.8e-7, exactly the sqrt-amplified floor discussed earlier and the reason the near-zero tolerance is set from measurement rather than guessed.
The decisive check exports four synthetic datasets from MQL5, reads them back in Python, and compares the exported profile to stumpy's. The figure below overlays the two on a random-walk dataset: the library's profile and stumpy's lie on top of each other, and the absolute difference, shown below on a log scale, sits around 1e-13. Across all four datasets the worst profile error against stumpy is about 2.6e-7, and every index the library reports genuinely points at a neighbor sitting at the recorded distance.
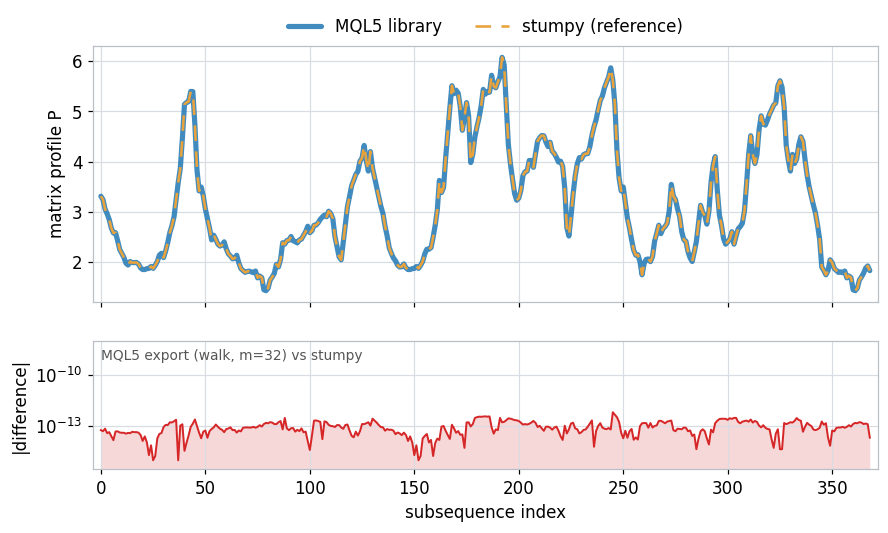
Fig. 6. The MQL5 profile against the deterministic stumpy reference on a random walk; the two lines are indistinguishable and their absolute difference, below, sits around 1e-13
The indicator
The indicator computes one profile per completed bar over a fixed window of recent history and draws it in a subwindow. This has a different cost profile than a fitter that runs on every historical bar. There is no first-load freeze: processing a few hundred bars takes milliseconds, and the indicator recomputes only when a new bar closes. After the profile is ready, each value is written to the buffer at the bar where its window completes, so the reading is causal and never uses a bar that has not closed. The discords are then extracted and marked twice, as colored dots on the profile line and as dashed vertical lines on the main chart:
//--- align profile: P[i] describes window [i .. i+m-1]; plot it at the
//--- bar where that window COMPLETES, so the reading is causal.
   for(int i = 0; i < prof.L; i++)
     {
      int bar = startBar + i + m - 1;
      if(bar >= 0 && bar < rates_total)
         ProfBuf[bar] = prof.P[i];
     }

//--- mark discords in the subwindow and (optionally) the main chart
   ObjectsDeleteAll(0, g_objPrefix);
   SMPDiscord dc[];
   int nd = prof.Discords(InpTopDiscords, dc);
   for(int r = 0; r < nd; r++)
     {
      int bar = startBar + dc[r].idx + m - 1;
      if(bar >= 0 && bar < rates_total)
        {
         DiscBuf[bar] = dc[r].dist;
         if(InpMarkOnChart)
            MarkDiscord(r, time[bar], dc[r].dist);
        }
     }
The screenshot in the payoff section is exactly this indicator on EURUSD H1, its subwindow line marking the discords in the recent range. The live anomaly reading, the profile value of the most recent completed window, is the number the Expert Advisor in the next section consumes.
A demonstration Expert: gating trades on discords
Important: the Expert Advisor below is a demonstration of how the discord reading is consumed by a trading rule. It is not a trading system, and no profit is claimed for it. The single backtest shown is one symbol over one six-month window with 57 trades, which is far too little to establish an edge. Read it as an illustration of the signal, not as a strategy to trade.
The Expert computes a profile over recent history on each new bar and reads the anomaly score of the most recent window. What counts as anomalous is not a hardcoded distance: it is a percentile of the current profile, recomputed every bar, so the threshold adapts to how varied the recent market has been. The helper that computes it sorts a copy of the profile and reads off the requested percentile:
//+------------------------------------------------------------------+
//| percentile (0..100) of a copy of the profile values              |
//+------------------------------------------------------------------+
double ProfilePercentile(const SMPProfile &prof, double pct)
  {
   int L = prof.L;
   if(L <= 0) return 0.0;
   double v[];
   ArrayResize(v, L);
   for(int i = 0; i < L; i++)
      v[i] = (prof.Valid(i) ? prof.P[i] : 0.0);
   ArraySort(v);
   int idx = (int)MathRound((pct / 100.0) * (L - 1));
   if(idx < 0) idx = 0;
   if(idx >= L) idx = L - 1;
   return v[idx];
  }
The rule itself is short. If the latest window's score sits below that percentile, the window is ordinary and the Expert stands aside. If it clears the percentile, the window is a discord, and the Expert acts on the direction of the move that produced it, in one of two honest interpretations: fade the move, treating the anomaly as an overextension, or follow it, treating the anomaly as a breakout:
//--- profile, then read the anomaly score of the LATEST window
   CMatrixProfile mp;
   SMPProfile prof;
   if(!mp.ComputeSeries(x, N, m, prof))
      return;
   if(prof.L < 2) return;

   double live = prof.P[prof.L - 1];
   double thr  = ProfilePercentile(prof, InpAnomalyPct);
   g_diagScored++;
   if(live > g_diagMaxLive) { g_diagMaxLive = live; g_diagMaxThr = thr; }
   if(live < thr)
      return;                         // latest window is ordinary - stand aside
   g_diagSignal++;
One position at a time, an optional fixed stop and target, and a time-based exit round out the rule. Run in the Strategy Tester on EURUSD H1 over the first half of 2026 in fade mode, with a 50-pip stop and a 50-pip target, it produced the following:
| Metric | Value |
|---|---|
| Total net profit | 159.70 on a 10,000 deposit (about 1.6 percent) |
| Profit factor | 1.31 |
| Total trades | 57 |
| Profit trades | 24 (42.11 percent) |
| Average win vs average loss | 28.14 vs -15.62 |
| Maximal drawdown | 1.08 percent (109.03) |
| Sharpe ratio | 2.17 |
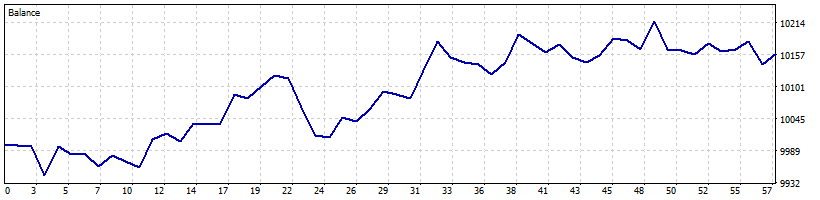
Fig. 7. The Strategy Tester balance curve for the demonstration Expert Advisor on EURUSD H1 over the first half of 2026; a modest, small-drawdown result that should not be read as an edge
The result is modestly positive with a small drawdown and should not be over-interpreted. Fifty-seven trades over six months is a small sample, the period is recent and in-sample, and the win rate is below half, carried by an average win larger than the average loss. What the backtest demonstrates is that the discord gate produces a coherent, tradeable stream of decisions, not that it produces an edge. The honest way to present a demonstration like this is to state its limits plainly and leave the profit claim unmade, which is what the attention box above does.
Conclusion
The Matrix Profile turns a price series into two readings that no standard indicator gives directly: where the market repeated itself, and where it broke from everything it had been doing. We built the whole thing from scratch in MQL5, a radix-2 FFT under a MASS distance profile, a STOMP self-join that computes the entire profile in O(L^2), and a small extraction layer that ranks motifs and discords. The one lesson worth carrying away is numerical, not algorithmic: the elegant distance identity fails silently on real price levels, and mean-centering the series at build time is what makes it trustworthy on gold and every other market that does not trade near zero.
What you have at the end is concrete:
- A six-header library that turns a price array into a Matrix Profile and its motif and discord lists.
- A from-scratch FFT and MASS distance profile, verified against a direct transform and a brute-force sum.
- A STOMP self-join that matches the deterministic stumpy reference to about 2.6e-7 across four datasets.
- An indicator that draws the profile in a subwindow and flags discords on the chart, computing in a handful of milliseconds per bar on EURUSD H1.
- A demonstration Expert Advisor that gates entries on the live discord score, presented honestly with its limits stated.
| # | Filename | Type | Description |
|---|---|---|---|
| 1 | MP.mqh | Header | Facade CMatrixProfile: compute a profile, distance profile, and reach the engine |
| 2 | MPData.mqh | Header | One window: the series, mean-centering, and rolling mean and standard deviation |
| 3 | MPTransform.mqh | Header | Radix-2 iterative FFT, the engine behind MASS |
| 4 | MPMass.mqh | Header | MASS: the sliding dot product and the distance profile |
| 5 | MPStomp.mqh | Header | STOMP self-join: the full profile and index in O(L^2) |
| 6 | MPProfile.mqh | Header | The profile result plus motif and discord extraction |
| 7 | MP_Test_Transform.mq5 | Script | FFT versus a direct DFT and the sliding dot product versus a brute-force sum |
| 8 | MP_Test_Mass.mq5 | Script | MASS distance profile versus a brute-force z-normalized distance |
| 9 | MP_Test_Stomp.mq5 | Script | Full profile versus a brute-force self-join and a planted motif |
| 10 | MP_Export_ForCrosscheck.mq5 | Script | Export four datasets for the stumpy cross-check |
| 11 | MP_Scan_Market.mq5 | Script | Run on a real chart and report top motifs, discords, and timing |
| 12 | MP_Discord_Indicator.mq5 | Indicator | Subwindow profile line, discord dots, and chart markers |
| 13 | MP_Anomaly_EA.mq5 | Expert | Demonstration: discord-gated fade or follow, no profit claimed |
| 14 | mp_crosscheck.py | Python | Cross-check of the MQL5 export against stumpy |
| 15 | MQL5.zip | Archive | Archive with all the files above, ready to unpack into the terminal data directory so each file lands in its correct location |
Warning: All rights to these materials are reserved by MetaQuotes Ltd. Copying or reprinting of these materials in whole or in part is prohibited.
This article was written by a user of the site and reflects their personal views. MetaQuotes Ltd is not responsible for the accuracy of the information presented, nor for any consequences resulting from the use of the solutions, strategies or recommendations described.

 Quantum Computing and Gradient Boosting in EURUSD Trading
 Hypothesis Testing for Trading Strategies — Proving Whether Your Edge is Real
 A Reusable Breakeven Manager in MQL5 with Spread Compensation
 Controller Objects for Everything: Draggable Slider Control

- Free trading apps
- Over 8,000 signals for copying
- Economic news for exploring financial markets
You agree to website policy and terms of use