

From Novice to Expert: Weekend Gap Size Effect Research Using MQL5 and Python
 1 913
1 913
 0
0

Contents
- The Weekend Gap Fill – From Trading Belief to Testable Question
- Measurement Contract and Test Criteria
- MQL5 Data Extraction + Python Analytics
- MQL5 Expert Advisor: Data Collection with Pip-Based Gap Detection
- Python Setup and Installation
- Python Data Loading and Cleaning
- Statistical Testing Methodology for Gap Fill Analysis
- Parameterization and Customization
- End‑to‑End Walkthrough: EURUSD, GBPUSD, and USDJPY
- Automation and Dashboard Deployment
- Key Lessons and Next Steps
The Weekend Gap Fill – From Trading Belief to Testable Question
Traders often rely on the intuitive rule that weekend gaps “fill” before price continues in the original direction. That intuition is useful as a hypothesis, but an algorithmic trader needs measurable answers: can gap‑fill be used as a reliable, parameterized signal for entry, risk management, or position sizing? This study reframes the question into an operational, reproducible testable specification.
Concretely, we define a gap fill as a return of intraday price to the Friday close (measured in pips), measured from the Monday open. To avoid ambiguous cases we exclude gaps where minute‑level data are missing ("NO_DATA"), parameterize gap size in pips, and bound the observation window (default: 168 hours). Our goals are explicit and actionable: (1) measure the fraction of weekend gaps that reach the Friday close and the distribution of time‑to‑fill; (2) test whether fill probability and fill speed vary with gap size; and (3) deliver a reproducible pipeline (MT5 Expert Advisor → CSV schema → Python analysis) so practitioners can reproduce, update, and extend the results for their instruments and parameter choices. The remainder of the article describes that pipeline, the statistical tests, and the outputs you can reuse directly.
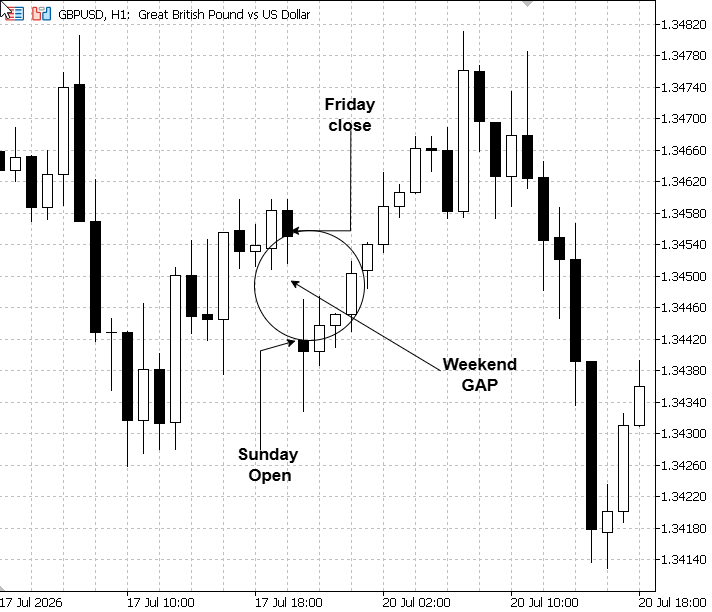
Fig. 1. Weekend gap on GBPUSD (H1).
Measurement Contract and Test Criteria
Before collecting data, we fix the rules that connect the trading question to the statistical outputs. This prevents definitions from changing after the results are known.
| Item | Operational rule | Purpose |
|---|---|---|
| Weekend gap | The signed difference between the Monday opening price and the preceding Friday closing price, converted to standard pips. | Creates a broker-digit-independent size variable. |
| Gap filled | After a gap up, a bar low touches or falls below Friday's close; after a gap down, a bar high touches or rises above Friday's close. | Provides one direction-aware and reproducible event rule. |
| Time to fill | Elapsed hours from the Monday open to the first fill touch, detected on inpFillTimeframe (M5 by default). | Measures fill speed and supports the 1/4/24/48/72-hour summaries. |
| Observation window | Observe each eligible gap for at most inpFillTimeLimit hours (168 by default). A valid gap not filled inside that window remains unfilled for the study. | Makes the fill rate comparable across observations. |
| Eligibility | Retain gaps within inpMinGapPips and inpMaxGapPips; label unavailable fill-timeframe history as NO_DATA and exclude it from statistical analysis. | Separates genuine non-fills from observations that cannot be evaluated. |
The tests follow directly from this contract. The fill rate and Kaplan–Meier curve quantify whether and how quickly eligible gaps fill. Logistic regression tests the null hypothesis that gap size has no relationship with fill probability (β = 0) against the alternative that it does (β ≠ 0), using a 5% significance level. Gap-size buckets provide an interpretable descriptive check. The often-mentioned 24–48-hour interval is therefore evaluated through the observed cumulative fill percentages rather than assumed in advance.
The controlled outputs are the per-symbol EA CSV files, one unified cleaned dataset, bucket and time-limit statistics, a logistic-model summary, a Kaplan–Meier time-to-fill estimate, six plots, and a text report saved in output/. Together, these outputs provide evidence for selecting filters and time limits; they do not by themselves constitute a complete entry or position-sizing strategy.
Research Pipeline: MQL5 Data Extraction + Python Analytics
To examine weekend gap fills rigorously, we use an architecture that handles market-data specifics and supports modern statistical analysis. The solution is a two‑phase pipeline that delegates distinct responsibilities to the most capable tool for each task.
Phase 1: MQL5 Expert Advisor – High‑Fidelity Data Extraction with Fill Tracking
The first phase runs as an Expert Advisor within the MetaTrader 5 environment. We chose an EA over an indicator for several key advantages:
- Multi‑symbol processing – The EA can process multiple symbols in a single run, eliminating the need to attach an indicator to each chart.
- Flexible symbol selection – Choose from predefined groups (Forex Majors, Minors, Indices, Commodities, Crypto) or define a custom list.
- Scheduled execution – Run once and stop, or run continuously with a timer.
- Append mode – Add new data without overwriting existing CSV files.
The EA uses several key MQL5 functions: CopyRates() retrieves arrays of MqlRates structures; Bars() checks data availability; SymbolSelect() ensures the symbol is available. For each symbol, the EA loads bars, computes the gap in pips, filters by user thresholds, scans minute data for fills, and exports to CSV.
Phase 2: Python – Statistical Analysis and Fill Probability Modeling
Once the CSV files are generated, we move to Python for comprehensive statistical analysis. This phase is broken into three sub‑tasks: data ingestion and cleaning (Pandas), hypothesis testing and probability modeling (Statsmodels, Lifelines), and visualization (Matplotlib, Seaborn) with a text report.
Integration Workflow
- Run the MQL5 EA on your chosen symbols. The EA outputs CSV files (e.g., gapfill_EURUSD.csv) to the \MQL5\Files\ folder.
- Copy the CSV files to your Python project's data/ directory.
- Execute the Python script which loads all files, cleans the data, runs statistical tests, and generates plots and a report.
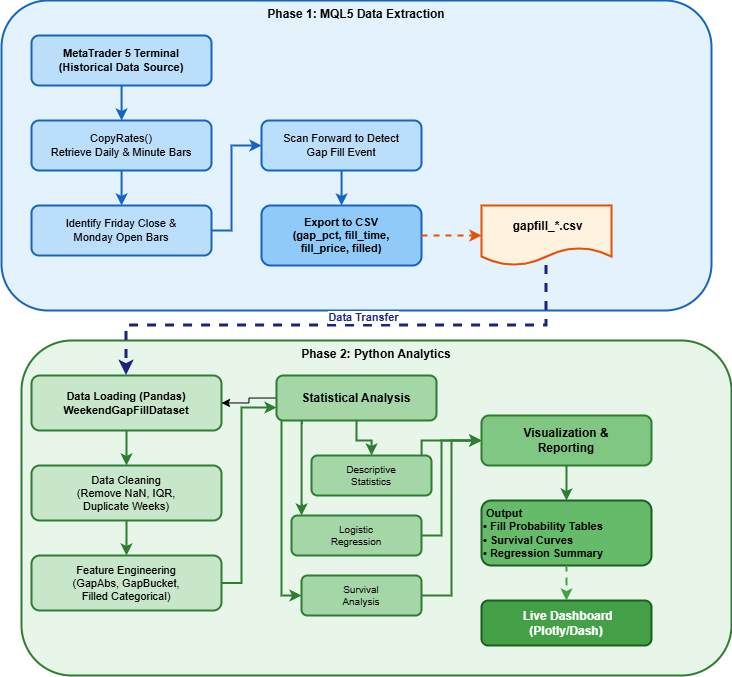
Fig. 2. Weekend Gap Fill Analysis: Data Flow Pipeline
MQL5 Expert Advisor: Data Collection with Pip-Based Gap Detection
The EA is structured into several logical components. Below we break down each part with contextual explanations.
1. Metadata and Properties
This block identifies the EA name, copyright holder, website, and version number. The #property directives provide this information to the MetaTrader 5 terminal, displayed in the Navigator panel.
//+------------------------------------------------------------------+
//|                                         WeekendGapFillEA.mq5     |
//|                                Copyright 2026, Clemence Benjamin |
//|                                          https://www.mql5.com    |
//+------------------------------------------------------------------+
#property copyright "Copyright 2026"
#property link      "https://www.mql5.com"
#property version   "1.07"
2. Symbol Selection Enumeration
This enumeration defines the available symbol selection modes. The user can choose from predefined groups or define custom lists. This provides flexibility without requiring code changes.
//+------------------------------------------------------------------+
//| Enumeration defining symbol selection modes                      |
//+------------------------------------------------------------------+
enum ENUM_SYMBOL_SELECTION_MODE
  {
   SYM_SINGLE,         // Single Specific Symbol (Define below)
   SYM_CUSTOM_LIST,    // Specific Symbol List (Comma-separated)
   SYM_FOREX_MAJORS,   // All Forex Majors
   SYM_FOREX_MINORS,   // All Forex Minors
   SYM_INDICES,        // All Indices
   SYM_COMMODITIES,    // All Commodities
   SYM_CRYPTO          // All Cryptocurrencies
  };
3. Input Parameters
The input parameters allow users to configure every aspect of the EA without modifying the source code: general settings (run once/continuous), symbol selection, gap detection timeframe and bar count, pip thresholds (min/max), fill detection timeframe and time limit, and file settings (prefix, append mode, folder).
//+------------------------------------------------------------------+
//| Input parameters                                                 |
//+------------------------------------------------------------------+
input group "===== GENERAL SETTINGS ====="
input bool                        inpRunOnce          = true;         // Run once and stop (true) or run continuously (false)
input int                         inpSleepMinutes     = 60;           // Minutes to sleep between runs (if continuous)

input group "===== SYMBOL SELECTION ====="
input ENUM_SYMBOL_SELECTION_MODE inpSymbolMode       = SYM_SINGLE;    // Choose selection mode
input string                      inpSingleSymbol     = "GBPUSD";     // Single Symbol (used if mode = SYM_SINGLE)
input string                      inpCustomSymbols    = "EURUSD,GBPUSD,USDJPY"; // Custom List (used if mode = SYM_CUSTOM_LIST)

input group "===== GAP DETECTION SETTINGS ====="
input ENUM_TIMEFRAMES             inpGapTimeframe     = PERIOD_H1;    // Gap detection timeframe (Default: PERIOD_H1)
input int                         inpBarsToAnalyze    = 10000;        // Number of gap-timeframe bars to analyze

input group "===== GAP CRITERIA (PIPS) ====="
input double                      inpMinGapPips       = 2.0;          // Minimum gap size in pips
input double                      inpMaxGapPips       = 200.0;        // Maximum gap size in pips

input group "===== FILL DETECTION SETTINGS ====="
input ENUM_TIMEFRAMES             inpFillTimeframe    = PERIOD_M5;    // Fill detection timeframe (Default: PERIOD_M5)
input int                         inpFillTimeLimit    = 168;          // Max hours to check for fill

input group "===== FILE SETTINGS ====="
input string                      inpOutputFileName   = "gapfill_";   // CSV output file prefix
input bool                        inpAppendMode       = false;        // Append to existing file (true) or overwrite (false)
input bool                        inpUseCommonFolder  = false;        // Save to Common Folder (true) or MQL5/Files (false)
4. Global Variables and Symbol List Helper
This function returns a comma-separated string of symbols based on the selected enumeration mode. It maps each enum value to a predefined list or user-defined values, enabling flexible symbol selection without code changes.
//--- Global state variables
datetime g_lastCheckTime;

//+------------------------------------------------------------------+
//| Returns symbol string list corresponding to selected mode        |
//+------------------------------------------------------------------+
string GetSymbolList(const ENUM_SYMBOL_SELECTION_MODE mode)
  {
   switch(mode)
     {
      case SYM_SINGLE:
        return(inpSingleSymbol);
      case SYM_CUSTOM_LIST:
        return(inpCustomSymbols);
      case SYM_FOREX_MAJORS:
        return("EURUSD,GBPUSD,USDJPY,AUDUSD,USDCAD,NZDUSD,USDCHF");
      case SYM_FOREX_MINORS:
        return("EURGBP,EURAUD,EURCAD,EURCHF,EURJPY,GBPAUD,GBPCAD,GBPJPY,GBPCHF,AUDJPY,CADJPY,CHFJPY,NZDJPY");
      case SYM_INDICES:
        return("US30,US500,US100,DE40,UK100,JP225,AU200");
      case SYM_COMMODITIES:
        return("XAUUSD,XAGUSD,XTIUSD,XBRUSD,XNGUSD");
      case SYM_CRYPTO:
        return("BTCUSD,ETHUSD,LTCUSD,XRPUSD");
      default:
        return(_Symbol);
     }
  }
5. Initialization Function
OnInit() is called when the EA is attached to a chart. It retrieves the symbol list, logs all settings, and either runs the processing once (if inpRunOnce = true) or sets a timer for continuous execution. ExpertRemove() terminates the EA after a single run.
//+------------------------------------------------------------------+
//| Program initialization function                                  |
//+------------------------------------------------------------------+
int OnInit()
  {
   //--- Retrieve target symbols string based on user inputs
   string symbolList = GetSymbolList(inpSymbolMode);

   Print("WeekendGapFillEA initialized");
   Print("Selection Mode: ", EnumToString(inpSymbolMode));
   Print("Symbols to analyze: ", symbolList);
   Print("Gap detection TF: ", EnumToString(inpGapTimeframe));
   Print("Min gap (pips): ", inpMinGapPips, " | Max gap (pips): ", inpMaxGapPips);
   Print("Fill detection TF: ", EnumToString(inpFillTimeframe));
   Print("Max fill time: ", inpFillTimeLimit, " hours");

   g_lastCheckTime = 0;

   //--- Execute single pass or register timer for continuous execution
   if(inpRunOnce)
     {
      Print("Running in single execution mode");
      ProcessAllSymbols();
      ExpertRemove();
     }
   else
     {
      Print("Running in continuous mode - checking every ", inpSleepMinutes, " minutes");
      EventSetTimer(inpSleepMinutes * 60);
     }

   return(INIT_SUCCEEDED);
  }
6. Deinitialization and Timer Functions
OnDeinit() kills the timer and logs deinitialization. OnTimer() triggers processing in continuous mode.
//+------------------------------------------------------------------+
//| Program deinitialization function                                |
//+------------------------------------------------------------------+
void OnDeinit(const int reason)
  {
   //--- Unregister timer handler
   EventKillTimer();
   Print("WeekendGapFillEA deinitialized (Reason: ", reason, ")");
  }

//+------------------------------------------------------------------+
//| Handles timer events for continuous execution mode              |
//+------------------------------------------------------------------+
void OnTimer()
  {
   //--- Trigger complete process loop across target assets
   ProcessAllSymbols();
  }
7. Main Processing Loop
This function splits the comma-separated symbol list into an array, iterates through each symbol, and calls ProcessSymbol() for each one. It handles empty strings and provides progress logging.
//+------------------------------------------------------------------+
//| Iterates through all specified symbols and runs detection logic  |
//+------------------------------------------------------------------+
void ProcessAllSymbols()
  {
   string symbolList = GetSymbolList(inpSymbolMode);
   string symbols[];
   int count = SplitString(symbolList, symbols, ",");

   if(count == 0)
     {
      Print("No symbols specified. Check your input settings.");
      return;
     }

   Print("===== Processing ", count, " symbol(s) =====");

   //--- Process each symbol independently
   for(int i = 0; i < count; i++)
     {
      string symbol = TrimString(symbols[i]);
      if(symbol == "")
        continue;

      Print("Processing: ", symbol);
      ProcessSymbol(symbol);
     }

   Print("===== All symbols processed =====");
  }
8. Pip Size Calculation
This function calculates the pip size based on symbol digits. For 5-digit (EURUSD) and 3-digit (JPY pairs) brokers, pip = 10 × Point; for 4‑digit and 2‑digit brokers, pip = Point. This ensures consistent gap measurement across symbol types.
//+------------------------------------------------------------------+
//| Calculates standard pip value based on symbol digits             |
//+------------------------------------------------------------------+
double GetPipSize(const string symbol)
  {
   double point = SymbolInfoDouble(symbol, SYMBOL_POINT);
   int digits = (int)SymbolInfoInteger(symbol, SYMBOL_DIGITS);

   //--- 5-digit and 3-digit broker quotes (Pip = 10 * Point)
   if(digits == 5 || digits == 3)
     return(point * 10.0);

   //--- 4-digit and 2-digit broker quotes (Pip = Point)
   if(digits == 4 || digits == 2)
     return(point);

   return(point * 10.0);
  }
9. Data Synchronization
This function forces the terminal to load historical data for a symbol and timeframe. It attempts up to 10 times with 200ms delays, ensuring data is available before processing and preventing "not enough bars" errors.
//+------------------------------------------------------------------+
//| Synchronizes historical rates from broker terminal cache         |
//+------------------------------------------------------------------+
bool SyncSymbolData(const string symbol, const ENUM_TIMEFRAMES timeframe)
  {
   datetime times[];
   int attempts = 0;

   //--- Attempt to load time series data into the terminal cache
   while(attempts < 10)
     {
      ResetLastError();
      int copied = CopyTime(symbol, timeframe, 0, 100, times);
      if(copied > 0)
        return(true);

      Sleep(200);
      attempts++;
     }

   return(false);
  }
10. Core Symbol Processing – Selection and Bar Copy
This begins the core processing for a single symbol. It selects the symbol, synchronizes data, retrieves pip size, checks bar count, and copies rates in chronological order.
//+------------------------------------------------------------------+
//| Processes gap detection and fill tracking for a single symbol    |
//+------------------------------------------------------------------+
void ProcessSymbol(const string symbol)
  {
   //--- Ensure symbol is selected in Market Watch
   if(!SymbolSelect(symbol, true))
     {
      Print("  Error: Symbol ", symbol, " not available in Market Watch");
      return;
     }

   //--- Synchronize history buffers
   SyncSymbolData(symbol, inpGapTimeframe);
   SyncSymbolData(symbol, inpFillTimeframe);

   double pipSize = GetPipSize(symbol);
   int gap_bars = Bars(symbol, inpGapTimeframe);

   if(gap_bars < 2)
     {
      Print("  Error: Not enough bars on ", EnumToString(inpGapTimeframe), " for ", symbol);
      return;
     }

   int bars_to_load = MathMin(inpBarsToAnalyze, gap_bars);

   MqlRates gap_rates[];
   ArraySetAsSeries(gap_rates, false); //--- Chronological order (Index 0 = Oldest)
   int gap_copied = CopyRates(symbol, inpGapTimeframe, 0, bars_to_load, gap_rates);

   if(gap_copied < 2)
     {
      Print("  Error: Failed to copy gap bars for ", symbol);
      return;
     }
11. File Handling and Append Mode
This section handles file operations: determines file flags, checks if the file exists, reads the last line to get the last processed date (for append mode), opens the file in append or write mode, and writes the CSV header for new files.
int fileFlags = FILE_CSV | (inpUseCommonFolder ? FILE_COMMON : 0);
   string csvFileName = inpOutputFileName + symbol + ".csv";

//--- Inspect file existence to determine append/overwrite position
   datetime lastProcessedDate = 0;
   bool fileExists = false;
   int fileHandle = FileOpen(csvFileName, FILE_READ | fileFlags, ",");

   if(fileHandle != INVALID_HANDLE)
     {
      fileExists = true;
      FileReadString(fileHandle); //--- Skip header

      string line = "";
      while(!FileIsEnding(fileHandle))
        {
         string temp = FileReadString(fileHandle);
         if(temp != "")
           line = temp;
        }
      FileClose(fileHandle);

      if(line != "")
        {
         string parts[];
         StringSplit(line, ',', parts);
         if(ArraySize(parts) >= 2)
           lastProcessedDate = ParseDateString(parts[0]);
        }
     }

//--- Open CSV file for writing
   int file_handle;
   if(fileExists && inpAppendMode)
     {
      file_handle = FileOpen(csvFileName, FILE_WRITE | FILE_READ | fileFlags, ",");
      if(file_handle != INVALID_HANDLE)
        FileSeek(file_handle, 0, SEEK_END);
     }
   else
     {
      file_handle = FileOpen(csvFileName, FILE_WRITE | fileFlags, ",");
      if(file_handle != INVALID_HANDLE)
        {
         FileWrite(file_handle, "close_time", "open_time", "gap_pips", "gap_pct",
                   "fill_time_hours", "fill_price", "gap_filled");
        }
     }

   if(file_handle == INVALID_HANDLE)
     {
      Print("  Error opening file: ", csvFileName);
      return;
     }
12. Weekend Gap Detection Loop
The main detection loop iterates through adjacent bars, calculates time differences, checks for weekend gaps (>=48 hours), skips previously processed dates, validates volume, computes gap in pips and percentage, and filters by min/max pip thresholds.
int gapCount = 0;
   int filledCount = 0;
   int skippedCount = 0;
   int processedGaps = 0;

//--- Main loop checking adjacent chronological candles
   for(int i = 0; i < gap_copied - 1; i++)
     {
      datetime timeClose = gap_rates[i].time;
      datetime timeOpen  = gap_rates[i + 1].time;
      long timeDiffSec   = timeOpen - timeClose;

      //--- Time-delta verification: gaps spanning >= 48 hours (172,800 sec)
      if(timeDiffSec >= 172800)
        {
         //--- Skip previously recorded dates
         if(lastProcessedDate > 0 && gap_rates[i].time <= lastProcessedDate)
           {
            skippedCount++;
            continue;
           }

         //--- Filter zero volume bars
         if(gap_rates[i].tick_volume <= 0 || gap_rates[i + 1].tick_volume <= 0)
           continue;

         double closePrice = gap_rates[i].close;
         double openPrice  = gap_rates[i + 1].open;
         double price_diff = openPrice - closePrice;
         double gap_pips   = MathAbs(price_diff) / pipSize;

         //--- Validate minimum/maximum gap pip boundary conditions
         if(gap_pips < inpMinGapPips || gap_pips > inpMaxGapPips)
           continue;

         double gap_pct = (price_diff / closePrice) * 100.0;
         bool isGapUp   = (price_diff > 0);
13. Fill Detection Logic
This section fetches minute bars for the fill detection window, scans direction-aware (gap-up: low ≤ close price; gap-down: high ≥ close price), records fill time and price when touched, and sets fill status ("NO_DATA", "TRUE", or "FALSE").
//--- Dynamically request minute rates during fill window
         datetime timeLimit = timeOpen + (inpFillTimeLimit * 3600);
         MqlRates minute_rates[];
         ArraySetAsSeries(minute_rates, false);

         int minute_copied = CopyRates(symbol, inpFillTimeframe, timeOpen, timeLimit, minute_rates);

         double fill_price = 0;
         int fill_time_hours = -1;
         bool gap_filled = false;

         //--- Direction-aware gap fill verification
         if(minute_copied > 0)
           {
            for(int j = 0; j < minute_copied; j++)
              {
               bool touchedFillLevel = false;

               if(isGapUp)
                 {
                  //--- Gap Up: Low price must touch or dip below close price
                  if(minute_rates[j].low <= closePrice)
                    touchedFillLevel = true;
                 }
               else
                 {
                  //--- Gap Down: High price must touch or rally above close price
                  if(minute_rates[j].high >= closePrice)
                    touchedFillLevel = true;
                 }

               if(touchedFillLevel)
                 {
                  fill_price = closePrice;
                  fill_time_hours = (int)((minute_rates[j].time - timeOpen) / 3600);
                  gap_filled = true;
                  break;
                 }
              }
           }

         //--- Set explicit status string depending on data availability
         string fillStatus = "FALSE";
         if(minute_copied == 0)
           {
            fillStatus = "NO_DATA";
           }
         else if(gap_filled)
           {
            fillStatus = "TRUE";
           }
14. CSV Writing and Final Logging
For each detected gap, the EA writes a row to the CSV with all data. After processing all bars, it closes the file and logs a summary: gaps processed, skipped, detected, and fill rate percentage.
//--- Write formatted row to output CSV
         FileWrite(file_handle,
                   TimeToString(gap_rates[i].time, TIME_DATE|TIME_MINUTES),
                   TimeToString(gap_rates[i + 1].time, TIME_DATE|TIME_MINUTES),
                   DoubleToString(gap_pips, 1),
                   DoubleToString(gap_pct, 4),
                   (fill_time_hours >= 0) ? IntegerToString(fill_time_hours) : "",
                   DoubleToString(fill_price, _Digits),
                   fillStatus);

         gapCount++;
         if(gap_filled)
           filledCount++;

         processedGaps++;
        }
     }

   FileClose(file_handle);

//--- Output results summary to terminal log
   Print("  Results for ", symbol, ":");
   Print("    New gaps processed: ", processedGaps);
   Print("    Skipped (already processed): ", skippedCount);
   Print("    Gaps detected: ", gapCount);
   Print("    Gaps filled: ", filledCount,
         " (", (gapCount > 0 ? DoubleToString((double)filledCount / gapCount * 100, 2) : "0.00"), "%)");
   Print("    Data saved to: ", csvFileName);
  }
15. Utility Functions
These provide string splitting, trimming, and date parsing for CSV handling.
//+------------------------------------------------------------------+
//| Splits a string delimited by character into an output array      |
//+------------------------------------------------------------------+
int SplitString(const string src, string &output[], const string delimiter)
  {
   int count = 0;
   string temp = src;

   StringReplace(temp, " ", "");
   int delimLen = StringLen(delimiter);

   while(true)
     {
      int pos = StringFind(temp, delimiter);
      if(pos == -1)
        break;

      string part = StringSubstr(temp, 0, pos);
      if(part != "")
        {
         ArrayResize(output, count + 1);
         output[count] = part;
         count++;
        }
      temp = StringSubstr(temp, pos + delimLen);
     }

   if(temp != "")
     {
      ArrayResize(output, count + 1);
      output[count] = temp;
      count++;
     }

   return(count);
  }

//+------------------------------------------------------------------+
//| Removes leading and trailing whitespace characters from string   |
//+------------------------------------------------------------------+
string TrimString(const string str)
  {
   int start = 0;
   int end = StringLen(str) - 1;

   while(start < end && str[start] == ' ')
     start++;

   while(end > start && str[end] == ' ')
     end--;

   return(StringSubstr(str, start, end - start + 1));
  }

//+------------------------------------------------------------------+
//| Converts formatted date string into datetime structure value     |
//+------------------------------------------------------------------+
datetime ParseDateString(const string str)
  {
   int pos1 = StringFind(str, ".");
   if(pos1 == -1)
     return(0);

   int pos2 = StringFind(str, ".", pos1 + 1);
   if(pos2 == -1)
     return(0);

   int year  = (int)StringToInteger(StringSubstr(str, 0, pos1));
   int month = (int)StringToInteger(StringSubstr(str, pos1 + 1, pos2 - pos1 - 1));
   int day, hour = 0, minute = 0;

   int timePos = StringFind(str, " ");

   if(timePos != -1)
     {
      day = (int)StringToInteger(StringSubstr(str, pos2 + 1, timePos - pos2 - 1));
      string timeStr = StringSubstr(str, timePos + 1);
      int colonPos = StringFind(timeStr, ":");

      if(colonPos != -1)
        {
         hour = (int)StringToInteger(StringSubstr(timeStr, 0, colonPos));
         minute = (int)StringToInteger(StringSubstr(timeStr, colonPos + 1));
        }
     }
   else
     {
      day = (int)StringToInteger(StringSubstr(str, pos2 + 1));
     }

   MqlDateTime dt;
   dt.year  = year;
   dt.mon   = month;
   dt.day   = day;
   dt.hour  = hour;
   dt.min   = minute;
   dt.sec   = 0;

   return(StructToTime(dt));
  }
The complete EA source file is provided as an attachment for download.
Python Setup and Installation
Before running the Python analysis, you need to set up your environment correctly.
Project Structure
weekend_gap_fill_analysis/
├── gap_fill_analysis.py        # Main analysis class
├── run_analysis.py             # Script to execute analysis
├── requirements.txt            # Python dependencies
├── data/                       # Place CSV files from MT5 here
│   ├── gapfill_EURUSD.csv
│   ├── gapfill_GBPUSD.csv
│   └── gapfill_USDJPY.csv
└── output/                     # Generated automatically
    ├── gap_distribution_pips.png
    ├── fill_probability_by_bucket_pips.png
    ├── fill_time_distribution.png
    ├── fill_time_by_bucket_pips.png
    ├── survival_curve.png
    ├── fill_rate_by_symbol.png
    └── analysis_report_pips.txt
Install Dependencies (requirements.txt)
pandas>=1.3.0
numpy>=1.21.0
matplotlib>=3.4.0
seaborn>=0.11.0
statsmodels>=0.13.0
scipy>=1.7.0
lifelines>=0.27.0
Install with: pip install -r requirements.txt
Copy CSV Files from MetaTrader 5
The EA saves CSV files to: C:\Users\YourUsername\AppData\Roaming\MetaQuotes\Terminal\Common\Files\ or the terminal's MQL5\Files\ folder. Copy all gapfill_*.csv to your project's data/ folder.
Run the Analysis:
python run_analysis.py
Python Data Loading and Cleaning
Below is the complete Python analysis code, broken into logical sections with explanations.
1. Imports and Class Initialization
We import necessary libraries with try/except for optional imports (matplotlib, seaborn, etc.) so the analysis can still run without them. The WeekendGapFillDataset class encapsulates all functionality. The constructor accepts data directory and pip thresholds, and initializes empty data structures.
import pandas as pd
import numpy as np
from pathlib import Path
from datetime import datetime
import warnings
warnings.filterwarnings('ignore')

try:
    import matplotlib.pyplot as plt
    HAS_PLT = True
except ImportError:
    HAS_PLT = False

try:
    import seaborn as sns
    HAS_SNS = True
except ImportError:
    HAS_SNS = False

try:
    import statsmodels.api as sm
    HAS_SM = True
except ImportError:
    HAS_SM = False

try:
    from lifelines import KaplanMeierFitter
    HAS_LIFELINES = True
except ImportError:
    HAS_LIFELINES = False

class WeekendGapFillDataset:
    def __init__(self, data_dir: str, min_gap_pips: float = 2.0, max_gap_pips: float = 200.0):
        self.data_dir = Path(data_dir)
        self.min_gap_pips = min_gap_pips
        self.max_gap_pips = max_gap_pips
        self.raw_data = {}
        self.cleaned_data = None
        self.analysis_results = {}
        self.metadata = {}
2. Robust CSV Reading Helpers
These helper methods handle the common issue of CSV file encoding. They attempt multiple encodings (UTF-8 with BOM, UTF-16, Latin-1, etc.) until one works. The "_without_header" variant is used when the file may have missing or corrupt headers.
def _read_csv_with_fallback(self, filepath):
    encodings = ['utf-8-sig', 'utf-16-le', 'utf-16', 'latin-1', 'cp1252']
    for encoding in encodings:
        try:
            return pd.read_csv(filepath, encoding=encoding)
        except (UnicodeDecodeError, UnicodeError):
            continue
    raise UnicodeError(f"Could not read {filepath} with any encoding")

def _read_csv_without_header(self, filepath):
    encodings = ['utf-8-sig', 'utf-16-le', 'utf-16', 'latin-1', 'cp1252']
    for encoding in encodings:
        try:
            return pd.read_csv(filepath, encoding=encoding, header=None)
        except (UnicodeDecodeError, UnicodeError):
            continue
    raise UnicodeError(f"Could not read {filepath} without header with any encoding")
3. Loading All CSV Files
This method loads all gapfill_*.csv files. It applies encoding fallbacks, normalizes column names, parses datetime fields, stores DataFrames in raw_data, and updates metadata with record count and date range.
def load_all(self):
    print(f"Loading data from: {self.data_dir}")
    print(f"Gap filter: {self.min_gap_pips} pips <= gap <= {self.max_gap_pips} pips")

    csv_files = list(self.data_dir.glob('gapfill_*.csv'))

    if not csv_files:
        print("No CSV files found. Please run the MQL5 EA first.")
        return

    for csv_file in csv_files:
        try:
            try:
                df = self._read_csv_with_fallback(csv_file)
            except UnicodeError:
                df = self._read_csv_without_header(csv_file)
                if len(df.columns) >= 7:
                    df.columns = ['close_time', 'open_time', 'gap_pips', 'gap_pct',
                                  'fill_time_hours', 'fill_price', 'gap_filled']
                else:
                    print(f"  Error: Unexpected columns in {csv_file.name}")
                    continue

            symbol = csv_file.stem.replace('gapfill_', '')

            if 'friday_date' in df.columns and 'monday_date' in df.columns:
                df.rename(columns={'friday_date': 'close_time', 'monday_date': 'open_time'}, inplace=True)

            df['close_time'] = pd.to_datetime(df['close_time'])
            df['open_time'] = pd.to_datetime(df['open_time'])

            self.raw_data[symbol] = df
            self.metadata[symbol] = {
                'records': len(df),
                'first_date': df['close_time'].min(),
                'last_date': df['close_time'].max()
            }
            print(f"  Loaded {symbol}: {len(df)} records")
        except Exception as e:
            print(f"  Error loading {csv_file.name}: {e}")

    print(f"Loaded {len(self.raw_data)} symbols")
4. Data Cleaning
This method performs comprehensive cleaning: excludes rows with 'NO_DATA', converts gap_filled to boolean, removes NaN, applies pip thresholds, filters outliers using IQR, deduplicates by close_time, creates pip-based buckets, adds a symbol column, and concatenates all cleaned DataFrames.
def clean_data(self, iqr_multiplier: float = 3.0):
    cleaned_dfs = []

    for symbol, df in self.raw_data.items():
        df_clean = df.copy()
        df_clean = df_clean[df_clean['gap_filled'] != 'NO_DATA']
        df_clean['gap_filled'] = df_clean['gap_filled'].astype(str).str.upper() == 'TRUE'
        df_clean['filled_bool'] = df_clean['gap_filled']
        df_clean = df_clean.dropna(subset=['gap_pips', 'gap_pct'])
        df_clean = df_clean[np.isfinite(df_clean['gap_pips'])]

        df_clean = df_clean[(df_clean['gap_pips'] >= self.min_gap_pips) &
                            (df_clean['gap_pips'] <= self.max_gap_pips)]

        Q1 = df_clean['gap_pips'].quantile(0.25)
        Q3 = df_clean['gap_pips'].quantile(0.75)
        IQR = Q3 - Q1
        lower_bound = max(0, Q1 - iqr_multiplier * IQR)
        upper_bound = Q3 + iqr_multiplier * IQR
        df_clean = df_clean[(df_clean['gap_pips'] >= lower_bound) &
                            (df_clean['gap_pips'] <= upper_bound)]

        df_clean = df_clean.drop_duplicates(subset=['close_time'])

        bins = [0, 2, 5, 10, 20, 50, 100, float('inf')]
        labels = ['0-2 pips', '2-5 pips', '5-10 pips', '10-20 pips',
                  '20-50 pips', '50-100 pips', '>100 pips']
        df_clean['gap_bucket'] = pd.cut(df_clean['gap_pips'], bins=bins, labels=labels)
        df_clean['fill_time_hours'] = pd.to_numeric(df_clean['fill_time_hours'], errors='coerce')
        df_clean['symbol'] = symbol

        cleaned_dfs.append(df_clean)
        print(f"  Cleaned {symbol}: {len(df_clean)} records")

    if cleaned_dfs:
        self.cleaned_data = pd.concat(cleaned_dfs, ignore_index=True)
        print(f"Total cleaned records: {len(self.cleaned_data)}")
5. Descriptive Statistics
This method computes overall fill probability, gap size statistics (mean, median, std, min, max in pips and percentage), fill time statistics, time-based fill rates, fill probability by pip bucket, and per-symbol fill rates. Results are stored in analysis_results.
def descriptive_statistics(self):
    results = {}
    df = self.cleaned_data
    if df is None:
        print("Data not cleaned. Run clean_data() first.")
        return results

    results['overall_fill_rate'] = df['filled_bool'].mean()
    results['total_gaps'] = len(df)
    results['filled_gaps'] = df['filled_bool'].sum()

    results['gap_mean_pips'] = df['gap_pips'].mean()
    results['gap_median_pips'] = df['gap_pips'].median()
    results['gap_std_pips'] = df['gap_pips'].std()
    results['gap_min_pips'] = df['gap_pips'].min()
    results['gap_max_pips'] = df['gap_pips'].max()

    results['gap_mean_pct'] = df['gap_pct'].mean()
    results['gap_median_pct'] = df['gap_pct'].median()

    filled_df = df[df['filled_bool']]
    if len(filled_df) > 0:
        results['fill_time_mean'] = filled_df['fill_time_hours'].mean()
        results['fill_time_median'] = filled_df['fill_time_hours'].median()
        results['fill_time_std'] = filled_df['fill_time_hours'].std()
        results['fill_time_min'] = filled_df['fill_time_hours'].min()
        results['fill_time_max'] = filled_df['fill_time_hours'].max()

        for hours in [1, 4, 24, 48, 72]:
            pct = (filled_df['fill_time_hours'] <= hours).mean()
            results[f'filled_within_{hours}h'] = pct

    results['fill_prob_by_bucket'] = df.groupby('gap_bucket')['filled_bool'].agg([
        ('count', 'count'), ('filled', 'sum'), ('probability', 'mean')
    ])

    results['per_symbol'] = df.groupby('symbol')['filled_bool'].agg([
        ('count', 'count'), ('filled', 'sum'), ('fill_rate', 'mean')
    ])

    self.analysis_results['descriptive'] = results
    return results
6. Logistic Regression
This method performs logistic regression using statsmodels to model the relationship between gap size (gap_pips) and fill probability (filled_bool). It returns model summary, coefficients, p-values, AIC, and BIC.
def logistic_regression_analysis(self):
    if not HAS_SM:
        print("Statsmodels not available.")
        return None

    df = self.cleaned_data
    if df is None:
        print("Data not cleaned. Run clean_data() first.")
        return None

    X = df[['gap_pips']]
    X = sm.add_constant(X)
    y = df['filled_bool'].astype(int)

    try:
        model = sm.Logit(y, X).fit(disp=0)
        results = {
            'summary': model.summary(),
            'params': model.params,
            'pvalues': model.pvalues,
            'aic': model.aic,
            'bic': model.bic
        }
        self.analysis_results['logistic'] = results
        return results
    except Exception as e:
        print(f"Logistic regression failed: {e}")
        return None
7. Survival Analysis (Kaplan-Meier)
This method uses lifelines to fit a Kaplan-Meier estimator on fill times. It returns the estimator, median survival time, and the survival table.
def survival_analysis(self):
    if not HAS_LIFELINES:
        print("Lifelines not available.")
        return None

    df = self.cleaned_data
    if df is None:
        print("Data not cleaned. Run clean_data() first.")
        return None

    survival_data = df[['fill_time_hours', 'filled_bool']].copy()
    survival_data = survival_data.dropna()

    if len(survival_data) == 0:
        print("No survival data available")
        return None

    kmf = KaplanMeierFitter()
    kmf.fit(
        durations=survival_data['fill_time_hours'],
        event_observed=survival_data['filled_bool'],
        label='Kaplan-Meier Estimate'
    )

    results = {
        'kmf': kmf,
        'median_survival_time': kmf.median_survival_time_,
        'survival_table': kmf.survival_function_.tail(10)
    }

    self.analysis_results['survival'] = results
    return results
8. Main Execution
The main() function orchestrates the entire workflow: initializes the dataset, loads data, cleans, computes descriptive statistics, runs logistic regression, performs survival analysis, generates plots, and generates the report.
def main():
    print("=" * 70)
    print("WEEKEND GAP FILL ANALYSIS (PIP-BASED)")
    print("=" * 70)

    DATA_DIR = "data"
    OUTPUT_DIR = "output"
    MIN_GAP_PIPS = 2.0
    MAX_GAP_PIPS = 200.0

    analyzer = WeekendGapFillDataset(DATA_DIR, min_gap_pips=MIN_GAP_PIPS, max_gap_pips=MAX_GAP_PIPS)

    print("Step 1: Loading data...")
    analyzer.load_all()

    if not analyzer.raw_data:
        print("\nERROR: No data loaded.")
        return

    print("\nStep 2: Cleaning data...")
    analyzer.clean_data()

    print("\nStep 3: Calculating descriptive statistics...")
    analyzer.descriptive_statistics()

    print("\nStep 4: Performing logistic regression...")
    analyzer.logistic_regression_analysis()

    print("\nStep 5: Performing survival analysis...")
    analyzer.survival_analysis()

    print("\nStep 6: Generating plots...")
    analyzer.generate_plots(OUTPUT_DIR)

    print("\nStep 7: Generating report...")
    analyzer.generate_report(OUTPUT_DIR)

    print("\n" + "=" * 70)
    print("ANALYSIS COMPLETE")
    print("=" * 70)
    print(f"Results saved to: {OUTPUT_DIR}/")

if __name__ == "__main__":
    main()
The complete Python source files are provided as attachments.
Statistical Testing Methodology for Gap Fill Analysis
We follow a three‑part methodology: descriptive statistics, inferential testing, and survival analysis.
Descriptive Statistics
Compute fill probability by gap size bucket, mean fill time, median fill time, and the distribution of gap sizes.
Logistic Regression for Fill Probability
Model: P(Filled) = 1 / (1 + exp(-(α + β·GapPips)))
This tests whether gap size (in pips) is a significant predictor of fill probability. A statistically significant coefficient would indicate that gap size affects the likelihood of a fill.
Survival Analysis for Time‑to‑Fill
Kaplan‑Meier estimator to analyze the distribution of fill times. This shows the probability that a gap remains unfilled over time.
Trade‑offs
- Fill detection precision – M1 bars provide higher precision but require more data. M5 bars offer a good balance.
- Survivorship bias – Only currently available symbols can be analyzed. For historical equities, use a data provider.
- Look‑ahead bias – The fill is determined after Monday open using only available data, so no future data is used.
Parameterization and Customization
No single definition of a "gap fill" suits every research question. We parameterize critical components.
Fill Definition:
Parameter inpFillTimeLimit (default 168 hours = 7 days). The EA tracks fills only within this window.
Fill Detection Precision:
Parameter inpFillTimeframe (default PERIOD_M5).
Gap Size Thresholds (Pips):
Two parameters: inpMinGapPips (default 2.0) and inpMaxGapPips (default 200.0).
Symbol Selection:
Parameter inpSymbolMode with options: Single Symbol, Custom List, Forex Majors, Forex Minors, Indices, Commodities, Crypto.
Table of Parameters (Default Values)
| Parameter | Type | Default | Description |
|---|---|---|---|
| inpSymbolMode | enum | SYM_CUSTOM_LIST | Symbol selection mode |
| inpCustomSymbols | string | EURUSD,GBPUSD,USDJPY | Custom symbol list |
| inpGapTimeframe | ENUM_TIMEFRAMES | PERIOD_H1 | Gap detection timeframe |
| inpMinGapPips | double | 2.0 | Minimum gap size in pips |
| inpMaxGapPips | double | 200.0 | Maximum gap size in pips |
| inpFillTimeframe | ENUM_TIMEFRAMES | PERIOD_M5 | Fill detection timeframe |
| inpFillTimeLimit | int | 168 | Max hours to check for fill |
| inpAppendMode | bool | false | Append to existing CSV |
End‑to‑End Walkthrough: EURUSD, GBPUSD, and USDJPY
We demonstrate the pipeline with three Forex majors: EURUSD, GBPUSD, and USDJPY.
Step 1: MQL5 EA – Data Collection
Attach the EA to any chart (e.g., GBPUSD, H1) with the following settings:
- inpSymbolMode = SYM_CUSTOM_LIST
- inpCustomSymbols = EURUSD,GBPUSD,USDJPY
- inpGapTimeframe = PERIOD_H1
- inpMinGapPips = 2.0
- inpMaxGapPips = 200.0
- inpRunOnce = true
The EA processes all three symbols and generates: gapfill_EURUSD.csv, gapfill_GBPUSD.csv, gapfill_USDJPY.csv
Step 2: Python Loading and Preprocessing
from gap_fill_analysis import WeekendGapFillDataset
analyzer = WeekendGapFillDataset('data', min_gap_pips=2.0, max_gap_pips=200.0)
analyzer.load_all()
analyzer.clean_data()
Step 3: Descriptive Statistics
stats = analyzer.descriptive_statistics()
print(stats['overall_fill_rate'])   # Overall fill probability
print(stats['fill_prob_by_bucket']) # Fill probability by pip bucket
Step 4: Logistic Regression
logit = analyzer.logistic_regression_analysis()
print(logit['summary'])
Step 5: Survival Analysis
surv = analyzer.survival_analysis()
print(f"Median survival time: {surv['median_survival_time']:.1f} hours")
Step 6: Generate Plots and Report
analyzer.generate_plots('output')
analyzer.generate_report('output')
Results
======================================================================
WEEKEND GAP FILL ANALYSIS REPORT (PIP-BASED)
======================================================================

Generated: 2026-07-21 09:29:47

DATA OVERVIEW
----------------------------------------
Total symbols: 3
Total records: 211
Date range: 2024-12-13 to 2026-07-17
Gap filter: 2.0 pips <= gap <= 200.0 pips

OVERALL STATISTICS
----------------------------------------
Total gaps analyzed: 211
Gaps filled: 166
Fill rate: 78.67%

GAP SIZE STATISTICS (PIPS)
----------------------------------------
Mean gap: 15.7 pips
Median gap: 11.1 pips
Std gap: 13.5 pips
Min gap: 2.1 pips
Max gap: 67.5 pips

FILL PROBABILITY BY GAP SIZE (PIPS)
----------------------------------------
       0-2 pips: nan% (n=0)
       2-5 pips: 76.47% (n=34)
      5-10 pips: 79.31% (n=58)
     10-20 pips: 79.41% (n=68)
     20-50 pips: 73.81% (n=42)
    50-100 pips: 100.00% (n=9)
      >100 pips: nan% (n=0)

FILL TIME STATISTICS
----------------------------------------
Mean fill time: 8.24 hours
Median fill time: 1.00 hours
Std fill time: 15.42 hours

FILL COMPLETION BY TIME
----------------------------------------
Within 1h: 54.82%
Within 4h: 66.87%
Within 24h: 90.36%
Within 48h: 95.78%
Within 72h: 98.80%

PER-SYMBOL STATISTICS
----------------------------------------
    EURUSD: 77.27% (n=66)
    GBPUSD: 83.56% (n=73)
    USDJPY: 75.00% (n=72)

LOGISTIC REGRESSION RESULTS
----------------------------------------
Constant: 1.1694 (p=0.0000)
Gap_pips coefficient: 0.0089 (p=0.5042)
AIC: 222.24
BIC: 228.94

CONCLUSION
----------------------------------------
The overall fill rate of 78.7% suggests that
weekend gaps tend to fill more often than not.
With a median fill time of 1.0 hours,
fills typically occur quickly.

Recommendation: Use the pip-based bucket analysis to identify
the gap size ranges with the highest fill probability.
The logistic regression shows that gap size (in pips) is not statistically significant (p = 0.50) within the 2–67 pip range analyzed. The analysis therefore does not provide evidence that gap size predicts fill probability in this sample. This is not proof that every gap size has an identical probability; larger samples or additional predictors may reveal effects that this model cannot detect.
Kaplan‑Meier Survival Curves
Among the gaps that filled, approximately 55% did so within the first hour, 67% within 4 hours, and over 90% within 24 hours. In this sample, successful fills are therefore concentrated near the Monday open.
Visualization Output
The Python analysis generates the following files in the output/ directory:
output/
├── gap_distribution_pips.png         # Histogram of gap sizes in pips
├── fill_probability_by_bucket_pips.png  # Fill rate by pip bucket with sample sizes
├── fill_time_distribution.png         # Distribution of fill times in hours
├── fill_time_by_bucket_pips.png       # Median fill time by pip bucket
├── survival_curve.png               # Kaplan-Meier survival curve
├── fill_rate_by_symbol.png          # Fill rates compared across symbols
└── analysis_report_pips.txt        # Complete text report with all statistics
These visualizations help interpret the gap-fill behavior and support the statistical findings presented above.
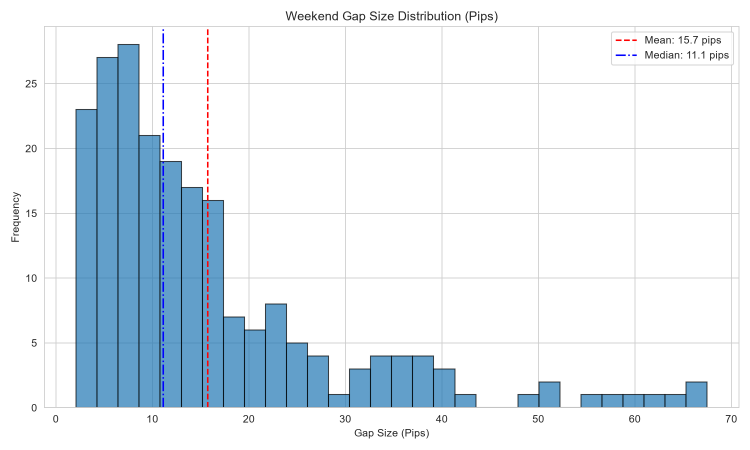
Fig. 3. gap_distribution_pips
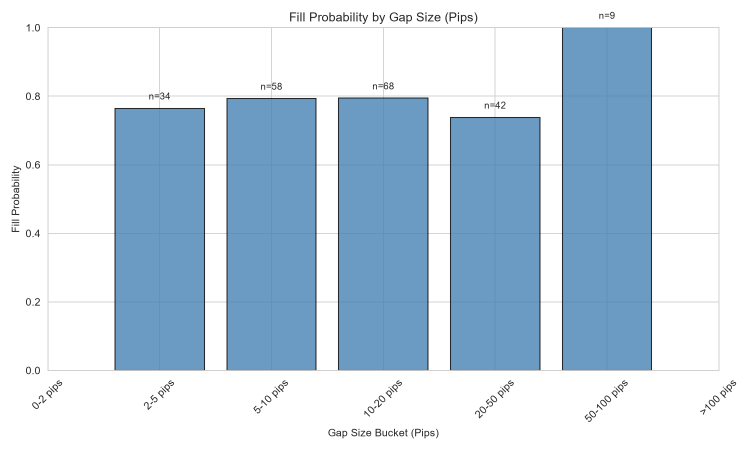
Fig. 4. fill_probability_by_bucket_pips
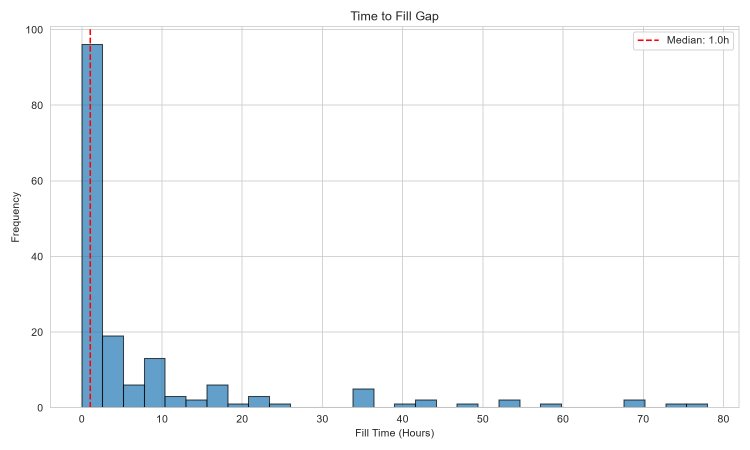
Fig. 5. fill_time_distribution
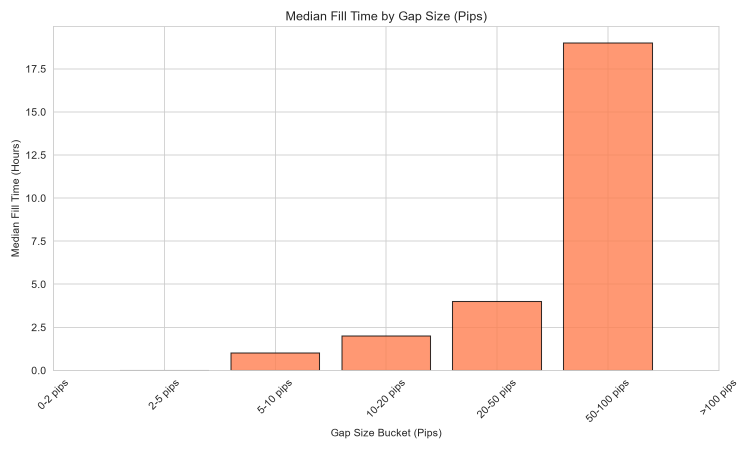
Fig. 6. fill_time_by_bucket_pips
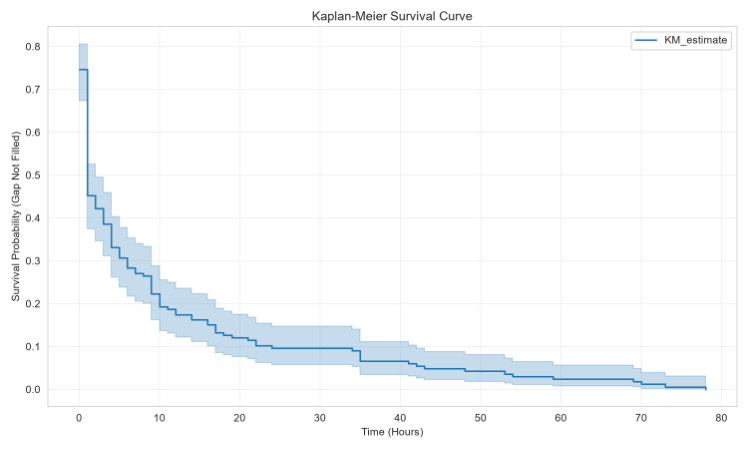
Fig. 7. survival_curve
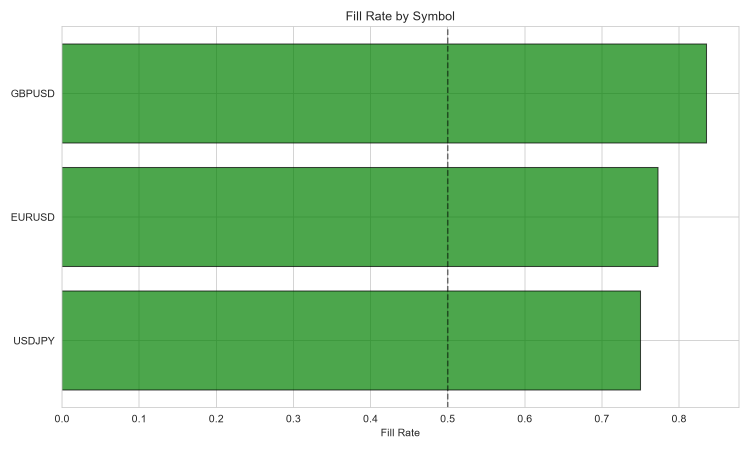
Fig. 8. fill_rate_by_symbol
Automation and Dashboard Deployment
To transform the research into an automated monitoring system, we combine scheduled MQL5 scripts, Python periodic re‑analysis, and a Plotly Dash dashboard.
Scheduled MQL5 Data Collection Agent
The EA can run in continuous mode (inpRunOnce = false) with a timer (inpSleepMinutes = 60) to check for new gaps every hour. It appends new weeks to existing CSV files when inpAppendMode = true.
Python Periodic Re‑analysis Scheduler
A Python script runs weekly (e.g., Monday evening) using cron or Task Scheduler. It loads the CSV, computes rolling statistics, runs logistic regression, and stores results.
Live Dashboard with Plotly/Dash
A Dash app displays interactive graphs: fill probability by gap size, survival curves, and a table showing current week's gaps and their fill status.
Deployment Considerations
- Data storage – CSV for archiving, SQLite for fast dashboard reads.
- Scheduling – External cron/Task Scheduler is more reliable than MetaTrader's internal scheduler.
- Scalability – Modify the EA to loop over a list of symbols stored in a text file.
Key Lessons and Next Steps
We have built a fully reproducible framework that bridges MQL5 data retrieval with Python‑based statistical analysis of gap fills. The key steps—from configuring the MQL5 EA with pip‑based gap detection to importing CSV data into Pandas, computing fill probabilities, applying logistic regression, and visualizing survival curves—form a template that can be extended to other calendar anomalies.
Critical Pitfalls and Mitigations
| Pitfall | How the framework mitigates | Remaining Concern |
|---|---|---|
| Survivorship bias | Uses currently traded symbols; futures/forex roll into continuous series. | For equities, delisted stocks are missing. Use a commercial provider for delisted data. |
| Look‑ahead bias | Fill status is determined after Monday open using only available data. | None, as no future data is used. |
| Fill detection precision | Uses M5 bars for reasonable precision with minimal data load. | Intra‑bar fills may be missed; M1 bars would be more precise but require more data. |
| Encoding issues | Python handles UTF‑8 BOM, UTF‑16, and Latin‑1 automatically with fallback logic. | Rare encodings may still fail; manual inspection may be needed. |
| Missing minute data | EA marks gaps as "NO_DATA" when minute data is unavailable; these are excluded from analysis. | Gaps with "NO_DATA" are excluded, which may bias the sample if data is missing systematically. |
Key Findings:
- Eligible weekend gaps in this sample have an overall fill rate of 78.7% within the 168-hour observation window.
- Fills occur extremely quickly – median fill time is just 1 hour.
- Within the 2–67 pip range, gap size does not predict fill probability (p = 0.50).
- Approximately 90% of observed fills occur within 24 hours, so the first trading day is the most informative time horizon in this sample.
Recommended Next Steps for Expert Extensions:
- Feature engineering – Add prior week volatility, volume, trend direction, and news sentiment.
- Machine learning – Random forest or gradient boosting to predict fill probability with higher accuracy.
- Multi‑asset analysis – Expand to equities, commodities, and cryptocurrencies.
- Trading strategy – Use the fill probability model to develop entry/exit rules for gap‑based strategies.
- Real‑time monitoring – Deploy the pipeline in a live environment to track current week's gaps.
The code published in this article is a starting point. We encourage readers to modify, critique, and share their findings. Save any customized scripts under new names to preserve the original templates.
Conclusion
This work provides a reproducible MetaTrader 5→CSV→Python framework and a practical empirical answer to whether weekend gaps reliably fill. Using the pipeline described—an EA for bulk collection, a standard CSV schema, and Python scripts for cleaning, bucketed statistics, logistic regression, and Kaplan–Meier survival analysis—we find that weekend gaps in the sample are more likely than not to fill quickly: the overall fill rate is approximately 78.7%, the median time‑to‑fill is approximately 1 hour, and approximately 90% of observed fills occur within 24 hours. Within the analyzed 2–67 pip range, gap size was not a statistically significant predictor of fill probability (logistic p ≈ 0.50), so gap size alone is insufficient as a decision rule in this sample.
Practical takeaways
- Gap filling has empirical support in the tested sample, but speed matters: most observed fills occur within hours, not days.
- Do not rely on gap size alone in the tested pip range; combine it with volatility, trend, liquidity, or news features and validate the resulting rule separately.
- Use the provided EA, CSV format, Python scripts, plots, and report as operational inputs for strategy development and ongoing monitoring.
Limitations and recommended next steps
- Scope: The reported results cover the analyzed Forex majors, gaps observed in the realized 2–67 pip range after filtering, and M5 fill detection within a maximum 168-hour window. They should not be generalized automatically to equities, larger gaps, or other markets.
- Data caveat: Observations flagged as NO_DATA were excluded. If missing minute data are systematic rather than random, this exclusion may bias the estimated fill rate and time distribution.
- Extensions: Add prior volatility, trend, liquidity or order-flow proxies, and news variables; repeat fill detection on M1 data; expand the asset universe; and compare interpretable statistical models with machine-learning classifiers under out-of-sample validation.
The key contribution is reproducibility. The reader receives both the measurement contract—how a gap, fill, observation window, pip filter, and missing-data exception are defined—and the complete MetaTrader 5→CSV→Python pipeline. The EA supports bulk collection by symbol list with minimum and maximum gap parameters and a configurable observation limit; the CSV schema accumulates comparable history; and the Python analysis cleans NO_DATA rows, builds bucket statistics, estimates logistic fill probability and Kaplan–Meier time to fill, and saves the report and graphs in output/. These controlled artifacts allow the findings to be re-tested on new weeks, instruments, and parameter choices and then translated into evidence-based filters, time limits, and risk rules.
Attachments
The following archive contains all source code files used in this research pipeline. It includes the MQL5 Expert Advisor and the Python analysis scripts in a single download.
| Archive | File / Folder | Type | Description |
|---|---|---|---|
| MQL5.zip | MQL5/Experts/WeekendGapFillAnalysis/WeekendGapFillEA.mq5 | MQL5 Expert Advisor | Main EA for data collection. Compile in MetaEditor and attach to any chart. Extract the MQL5 folder directly into your MetaTrader 5 terminal installation to place the EA in the correct location. |
| WeekendGapFillAnalysis/gap_fill_analysis.py | Python Module | Main analysis class. Contains data loading, cleaning, statistical tests, and visualization methods. | |
| WeekendGapFillAnalysis/run_analysis.py | Python Script | Entry point script. Executes the complete analysis pipeline. Modify DATA_DIR and OUTPUT_DIR as needed. | |
| WeekendGapFillAnalysis/requirements.txt | Text File | Lists all Python dependencies. Install with pip install -r requirements.txt. | |
| WeekendGapFillAnalysis/data/ | Directory | Placeholder folder for CSV input files from the EA. Copy your gapfill_*.csv files here. | |
| WeekendGapFillAnalysis/output/ | Directory | Automatically created by the Python script. All charts and the analysis report are saved here. |
Installation Notes:
- Extract the MQL5 folder from the archive directly into your MetaTrader 5 terminal’s installation directory. This places the EA at MQL5/Experts/WeekendGapFillAnalysis/WeekendGapFillEA.mq5. Compile the EA in MetaEditor before use.
- The WeekendGapFillAnalysis root folder contains all Python scripts and subfolders. Install the required packages by running pip install -r requirements.txt from inside that folder.
Warning: All rights to these materials are reserved by MetaQuotes Ltd. Copying or reprinting of these materials in whole or in part is prohibited.
This article was written by a user of the site and reflects their personal views. MetaQuotes Ltd is not responsible for the accuracy of the information presented, nor for any consequences resulting from the use of the solutions, strategies or recommendations described.

 Building a Position Sizing Engine in MQL5 with Multiple Risk Models
 Building a Future Swing Projection Indicator in MQL5
 Machine Learning Without the Black Box: The Tsetlin Machine for Trading
 Interactive Supply and Demand Zone Manager in MQL5 (Part IV): Trading Supply and Demand Zones

- Free trading apps
- Over 8,000 signals for copying
- Economic news for exploring financial markets
You agree to website policy and terms of use