

How to Test and Customize Built-in MQL5 Programs: Custom BullishBearish MeetingLines Stoch Expert Advisor
 800
800
 0
0

MetaTrader 5 already includes ready‑made Expert Advisors, indicators, and scripts. Many traders treat these as finished tools: you launch them, and they work, but their results may not be that satisfactory. Built‑in EAs have one big advantage—the source MQL5 code is provided that you can customize.
In this article, we'll look at one example among many: the BullishBearish MeetingLines Stoch.mq5 Expert Advisor. By default, it searches for the Three Black Crows and Three White Soldiers candlestick patterns and confirms entries with stochastic signals. This is enough to understand how the built‑in EA works, how to test it in the Strategy Tester, and what can be improved.
There are two ways to customize it. The first is to work with the input parameters to find the best settings—this is simpler and safer as it requires no coding experience. The second is to open the source code and change the logic itself, which may include adding filters. In this case, I will demonstrate the Moving Average trend filter. By the end of this discussion, you will have a customized Expert Advisor and some basic knowledge on working with the available tools and modifying them in MQL5.
We will cover the following topics:
- Finding the EA and Saving a Copy
- How the EA Works
- First: A Basic Test
- First Way: Optimizing the Settings
- Second Way: Simple Code Changes
- Saving and Loading Your Custom EA
- What Changed in the Tests
- Conclusion
Finding the EA and Saving a Copy
You need to locate the EA source code, open it in MetaEditor, and study it to understand how it works. The code is professionally developed and includes comments that make it easier to understand what each line does. The original BullishBearish MeetingLines Stoch.mq5 is stored in the Free Robots folder.
To find it:
- Open the Navigator panel (Ctrl+N).
- Expand Expert Advisors → Free Robots.
- Look for BullishBearish MeetingLines Stoch.
- Right‑click and select Modify to open it in MetaEditor.
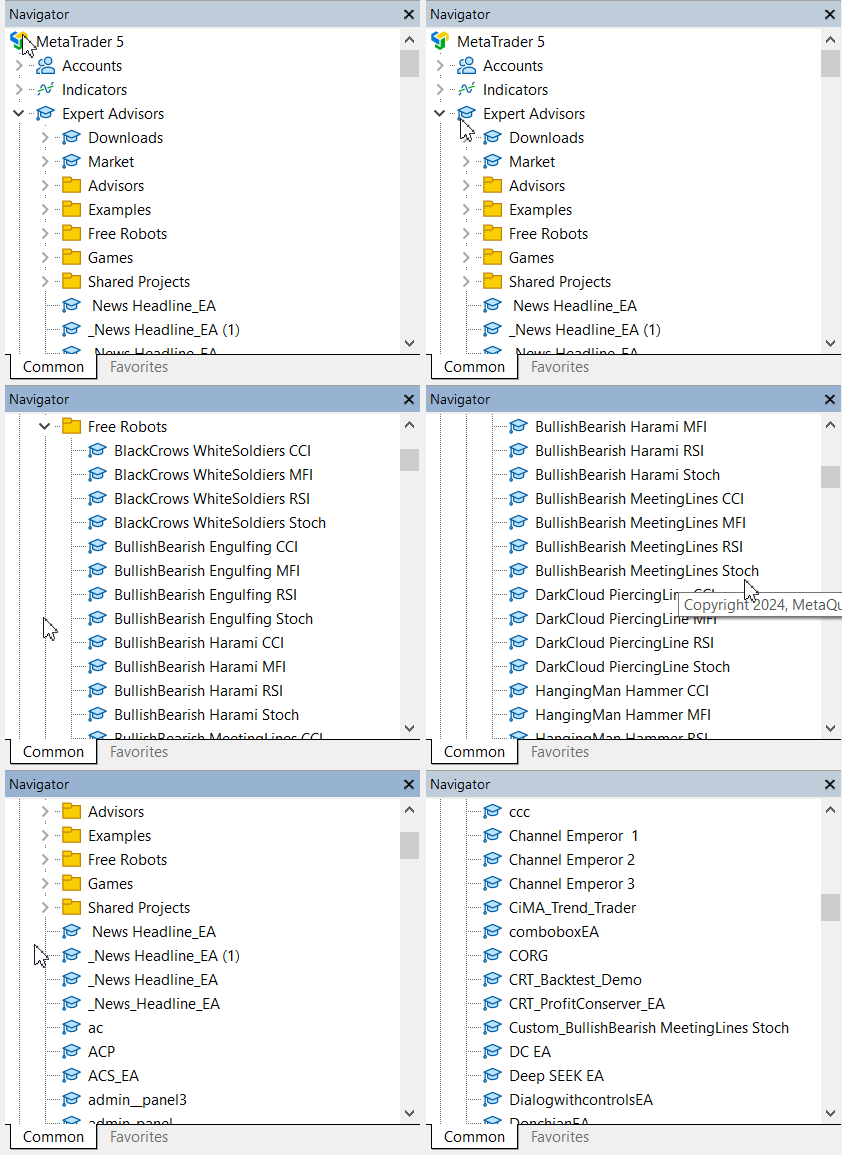
Fig. 1. Launching Free Robots in MetaTrader 5
The file path will look something like this:
C:\Users\[YourUsername]\AppData\Roaming\MetaQuotes\Terminal\[TerminalID]\MQL5\Experts\Free Robots\BullishBearish MeetingLines Stoch.mq5
Important: Never edit the original file directly. In MetaEditor, use File → Save As and save it as Custom_BullishBearish MeetingLines Stoch.mq5 or any other name you choose. This way, the original stays intact, and you can experiment freely.
How the EA Works
This is a modular EA that detects candlestick patterns, confirms them with Stochastic, and manages trades using signal, time, and risk-based rules. Despite the name "MeetingLines", the actual code searches for Three Black Crows and Three White Soldiers patterns. Understand the default logic before making changes. Otherwise, you may introduce errors that silently degrade performance. The code is well-commented, so even if you are not a programmer, you can follow the general flow. If you want to skip the code analysis, go to the testing and optimization section. It shows how to find better settings without editing code.
The EA follows a standard MQL5 template with three key functions:
- OnInit() – runs once when the EA is attached to a chart. It creates the Stochastic indicator handle.
- OnTick() – runs on every price tick. It checks for patterns, confirms signals, and manages trades.
- OnDeinit() – cleans up resources when the EA is removed.
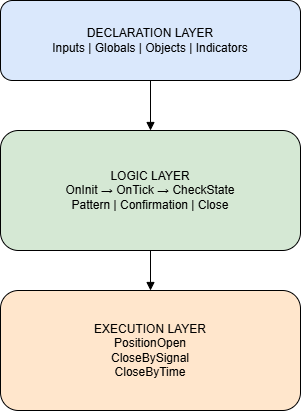
Fig. 2. Code Structure
The EA checks for two candlestick patterns: Three Black Crows (sell signal) and Three White Soldiers (buy signal). If a pattern is found, it confirms the signal using the Stochastic oscillator—below 30 for buy, above 70 for sell. Note that these values are hard-coded in the original source, not exposed as input parameters. This is one of the limitations we will address later. Once confirmed, the EA opens a trade with the specified stop‑loss, take‑profit, and holding time.
The input parameters that matter most are:
- InpStochK, InpStochD, InpStochSlow – Stochastic settings
- InpSL and InpTP – Stop‑loss and take‑profit in points
- InpDuration – How long to hold a position (in bars)
- InpAverBodyPeriod – Sensitivity for detecting "long" candles
//--- Input parameters
input int InpAverBodyPeriod=12;     // period for calculating average candlestick size
input int InpStochK        =47;     // period %K
input int InpStochD        =9;      // period %D
input int InpStochSlow     =13;     // smoothing period %K
input ENUM_STO_PRICE InpStochApplied=STO_LOWHIGH; // calculation type
input ENUM_MA_METHOD InpStochMA     =MODE_SMA;    // smoothing type

//--- trade parameters
input uint InpDuration=10;          // position holding time in bars
input uint InpSL      =200;         // Stop Loss in points
input uint InpTP      =200;         // Take Profit in points
input uint InpSlippage=10;          // slippage in points
//--- money management parameters
input double InpLot=0.1;            // lot
First: A Basic Test
The first step is to run the default EA in the Strategy Tester. This gives you a baseline to compare against later when tuning settings. It also shows the performance of the EA at default so you can decide whether to work with default settings or alter them. This is the simplest approach if you are not going to edit the code.
Launch the Strategy Tester (Ctrl+R) and set:
- Expert Advisor: BullishBearish MeetingLines Stoch
- Symbol: EURUSD (or another liquid pair)
- Period: H1
- Model: Every tick
- Deposit: 10,000 USD
- Date range: Last 6–12 months
Click Start. After the test finishes, check the Results tab. Pay attention to net profit, profit factor, and total trades. The default EA often generates few trades—candlestick patterns like Three Black Crows and Three White Soldiers are relatively rare.
Save the report as you wish, for example BullishBearish_Default_Report.html, for later comparison.
First Way: Optimizing the Settings
Before writing any code, there is a simpler path worth exploring: input optimization. Every built-in EA exposes parameters that can be tuned without opening MetaEditor. The Strategy Tester can automatically test thousands of combinations to find the values that performed best on historical data.
For this EA, the most impactful parameters are:
- InpStochK, InpStochD, InpStochSlow – Stochastic settings
- InpSL and InpTP – Stop‑loss and take‑profit in points
- InpDuration – Position holding time in bars
- InpAverBodyPeriod – Sensitivity for detecting long candles
To give you a starting point, I ran three manual variations of the Stochastic parameters while keeping all other settings at their defaults. Each test simply added 10 to the original K, D, and Slow values. The results are shown in Table 1.
| Metric | Default (K=47, D=9, Slow=13) | Test 1 (K=57, D=19, Slow=23) | Test 2 (K=67, D=29, Slow=33) |
|---|---|---|---|
| Total Net Profit | -245.30 | -148.10 | -250.70 |
| Profit Factor | 0.69 | 0.79 | 0.64 |
| Total Trades | 75 | 75 | 67 |
| Win Rate (%) | 40.00% | 46.67% | 40.30% |
| Max Balance Drawdown | 366.70 (3.66%) | 313.50 (3.14%) | 291.60 (2.92%) |
| Max Consecutive Losses | 14 (-203.10) | 5 (-93.80) | 7 (-140.10) |
| Average Profit Trade | 18.34 | 16.12 | 16.66 |
| Average Loss Trade | -17.68 | -17.81 | -17.51 |
Table 1. Manual variation of Stochastic input parameters on the default EA
Test 1 (K=57, D=19, Slow=23) performed best among the three tests. Net loss improved by nearly 40% compared to the default, profit factor rose from 0.69 to 0.79, and the maximum consecutive loss streak was cut from 14 down to just 5. Test 2 (K=67, D=29, Slow=33) reversed most of those gains. This shows that parameter tuning is not linear and requires systematic testing.
You can continue this exploration yourself. Try varying only one of the three Stochastic parameters at a time while keeping the other two at their defaults. Test ranges like K from 30 to 60, D from 5 to 15, and Slow from 8 to 20. Once you find promising Stochastic values, fix them and move on to optimizing SL and TP. The Strategy Tester's Optimization tab can automate this process—just remember to validate any optimized settings on a different date range to guard against overfitting.
With that option covered, let's move to the second way: opening the source code and changing the logic itself.
Second Way: Simple Code Changes
If input optimization isn't enough, you can change the code. For this article, we'll focus on two useful modifications. This is enough to demonstrate the principle without overwhelming you.
Modification 1: Make Stochastic Thresholds Adjustable
Currently, the EA uses hard‑coded values 30 and 70 for oversold and overbought thresholds inside the CheckConfirmation() function. Open the function and you will see the literal numbers in the conditional checks:
//--- check the Buy signal
if(ExtSignalOpen==SIGNAL_BUY && (signal<30))
  {
   ExtConfirmed=true;
   ExtPatternInfo+="\r\n   Confirmed: StochSignal<30";
  }

//--- check the Sell signal
if(ExtSignalOpen==SIGNAL_SELL && (signal>70))
  {
   ExtConfirmed=true;
   ExtPatternInfo+="\r\n   Confirmed: StochSignal>70";
  }
This locks the EA into a single interpretation of what constitutes an extreme reading. The number 30 means the EA will only buy when the Stochastic signal line has dropped below that level, and 70 means it will only sell above it. On higher timeframes and with certain symbols, thresholds of 20 and 80 often produce more statistically reliable signals because they demand a deeper extreme before triggering—only the most pronounced reversals qualify. By externalizing these values as input parameters, you gain the ability to test which levels work best for your specific market rather than relying on a fixed assumption that may not hold across all conditions.
Step 1 — Add input parameters. Place these two lines in the input block, after the existing Stochastic settings. The input keyword is what makes a variable appear in the EA properties panel and the Strategy Tester optimization grid. Without it, the value would be locked inside the code just like the original 30 and 70:
//--- Adjustable stochastic thresholds
input uint InpStochOversold=20;     // Oversold threshold
input uint InpStochOverbought=80;   // Overbought threshold
Step 2 — Replace the hard-coded values in CheckConfirmation(). Swap the literal 30 for InpStochOversold and the literal 70 for InpStochOverbought. Notice that we also update the log message using IntegerToString(). This ensures that when the EA prints a confirmation message to the Experts tab, it shows whichever threshold value is currently active rather than a misleading hard-coded number. This is a small detail but critical for debugging—if you change the input to 25 and the log still says "StochSignal<30," you will be working with incorrect information during testing:
//--- check the Buy signal
if(ExtSignalOpen==SIGNAL_BUY && (signal < InpStochOversold))
  {
   ExtConfirmed=true;
   ExtPatternInfo+="\r\n   Confirmed: Stoch < " + IntegerToString(InpStochOversold);
  }

//--- check the Sell signal
if(ExtSignalOpen==SIGNAL_SELL && (signal > InpStochOverbought))
  {
   ExtConfirmed=true;
   ExtPatternInfo+="\r\n   Confirmed: Stoch > " + IntegerToString(InpStochOverbought);
  }
After this change, the oversold and overbought levels appear in the EA properties panel and can be optimized in the Strategy Tester like any other parameter. The default values are set to 20 and 80, which you can adjust freely.
Modification 2: Add a Moving Average Filter
The original EA is a pure reversal strategy. When a Three Black Crows pattern forms and the Stochastic reads above 70, it sells. When Three White Soldiers appear and the Stochastic is below 30, it buys. The problem is that these conditions can occur during strong trending markets—a three-bar pullback against the trend can still produce the pattern and push the Stochastic into extreme territory. Without directional context, the EA takes trades that fight the prevailing order flow, which lowers the win rate over time.
A Moving Average filter solves this by restricting entries to the trend direction. When enabled, a buy signal is only valid if price is above the MA, and a sell signal requires price below the MA. This eliminates counter-trend entries that the original logic has no mechanism to detect.
The implementation touches four separate locations in the source code. Each step builds on the previous one—skip any, and the EA will fail to compile or the filter will not function. Follow each step below.
Step 1 — Add input parameters. Place these in the input block, after the Stochastic threshold parameters from Modification 1. The boolean InpUseMAFilter acts as a master switch, allowing you to toggle the entire filter on and off without removing any code. The InpMAPeriod and InpMAMethod parameters control the lookback period and smoothing algorithm of the Moving Average, respectively. Exposing the method as an input lets you test whether a simple moving average, exponential, or smoothed variant works best for your market:
//--- Moving Average filter
input bool InpUseMAFilter=true;      // Enable MA trend filter
input int InpMAPeriod=50;             // MA period
input ENUM_MA_METHOD InpMAMethod=MODE_EMA; // MA smoothing method
Step 2 — Declare a global handle. Locate the line where ExtStochHandle is declared near the top of the file in the global variables section. Add the MA handle declaration below it. In MQL5, every indicator you use must have a handle—an integer that uniquely identifies that indicator instance. The handle is what you pass to CopyBuffer() later to retrieve actual values. Declaring it globally means every function in the EA can access it, which is necessary because OnInit() creates it, CheckConfirmation() reads from it, and OnDeinit() releases it:
//--- indicator handles
int ExtStochHandle = INVALID_HANDLE;
int ExtMAHandle    = INVALID_HANDLE;   // handle for the Moving Average
Step 3 — Initialize the MA indicator in OnInit(). After the existing Stochastic handle creation block, add the iMA() call. The function iMA() is the built-in MQL5 constructor for a Moving Average indicator. Its parameters specify the symbol, timeframe, period, horizontal shift, smoothing method, and applied price. We use PRICE_CLOSE as the applied price because closing prices represent the final agreed value for each bar and are the standard reference for trend determination. The zero shift parameter means we are reading the MA value directly at each bar without offsetting it forward or backward. If the handle creation fails, the EA returns INIT_FAILED and refuses to run—this prevents silent failures where the filter would simply never trigger because it has no data:
ExtMAHandle = iMA(_Symbol, _Period, InpMAPeriod, 0, InpMAMethod, PRICE_CLOSE);
if(ExtMAHandle == INVALID_HANDLE)
  {
   Print("Failed to create iMA handle");
   return INIT_FAILED;
  }
Step 4 — Release the handle in OnDeinit(). Add the following line next to the existing IndicatorRelease() call for the Stochastic handle. Every indicator handle you create consumes system resources. If you fail to release it when the EA is removed, those resources remain allocated until the terminal is restarted. Over repeated attach-and-detach cycles, unreleased handles accumulate and can degrade terminal performance. This single line prevents that resource leak:
IndicatorRelease(ExtMAHandle); Step 5 — Add the MA value retrieval function. Place this function alongside the existing StochSignal() function near the end of the file. This function encapsulates the logic for reading from the MA indicator buffer. CopyBuffer() is the universal MQL5 function for extracting data from any indicator handle. Its parameters specify which handle to read from, which buffer index (0 is the main line for iMA), the starting bar index, the number of bars to copy, and the destination array. We request one value from bar index 1—the most recently closed bar—because using bar 0 would mean reading from the current forming bar, whose close price can still change. If the copy operation fails, the function returns EMPTY_VALUE, which the calling code in CheckConfirmation() detects and treats as a failure:
//+------------------------------------------------------------------+
//| Moving Average value at the specified bar                        |
//+------------------------------------------------------------------+
double MAValue(int index)
  {
   double buffer[];
   if(CopyBuffer(ExtMAHandle, 0, index, 1, buffer) < 1)
      return EMPTY_VALUE;
   return buffer[0];
  }
Step 6 — Integrate the filter into CheckConfirmation(). In CheckConfirmation(), first read the Stochastic and MA values from bar 1. If either value is missing, return false. Then apply the MA filter if enabled: buy only if Ask is above the MA, sell only if Bid is below the MA. If the filter rejects the signal, log the reason and return. If it passes, apply the adjustable Stochastic thresholds. The order matters: MA filtering should run before oscillator confirmation.
//+------------------------------------------------------------------+
//| CheckConfirmation (modified)                                     |
//+------------------------------------------------------------------+
bool CheckConfirmation()
  {
   ExtConfirmed = false;
   if(!ExtPatternDetected) return true;

   double stochSignal = StochSignal(1);
   double maVal       = MAValue(1);
   if(stochSignal == EMPTY_VALUE || maVal == EMPTY_VALUE)
      return false;

   //--- Modification 2: MA trend filter check
   if(InpUseMAFilter)
     {
      double currentPrice = (ExtSignalOpen == SIGNAL_BUY)
                            ? SymbolInfoDouble(_Symbol, SYMBOL_ASK)
                            : SymbolInfoDouble(_Symbol, SYMBOL_BID);
      if((ExtSignalOpen == SIGNAL_BUY  && currentPrice < maVal) ||
         (ExtSignalOpen == SIGNAL_SELL && currentPrice > maVal))
        {
         ExtPatternInfo += "\r\n   Rejected by MA trend filter";
         return true;
        }
     }

   //--- Modification 1: Stochastic confirmation with adjustable thresholds
   if(ExtSignalOpen == SIGNAL_BUY && stochSignal < InpStochOversold)
     {
      ExtConfirmed = true;
      ExtPatternInfo += "\r\n   Confirmed: Stoch < " + IntegerToString(InpStochOversold);
     }
   if(ExtSignalOpen == SIGNAL_SELL && stochSignal > InpStochOverbought)
     {
      ExtConfirmed = true;
      ExtPatternInfo += "\r\n   Confirmed: Stoch > " + IntegerToString(InpStochOverbought);
     }
   return true;
  }
Both modifications are now fully integrated.
Saving and Loading Your Custom EA
Before you can test the changes, you must compile the modified source code. In MetaEditor, press F7 or click the Compile button in the toolbar. The compiler checks your code for syntax errors and generates an executable .ex5 file. If errors appear in the Errors tab at the bottom of MetaEditor, double-click each error message to jump directly to the problematic line. Common issues include missing semicolons, mismatched brackets, or referencing a variable before declaring it. Fix any errors and compile again until the process completes cleanly.
Once compilation succeeds, the EA appears in the Navigator panel under Expert Advisors. You can now attach it to any chart by dragging it from the Navigator or double-clicking its name. All the new input parameters—the Stochastic thresholds and the MA filter settings—will be visible in the properties dialog that opens when you attach the EA. To transfer the customized EA to another MetaTrader 5 installation, copy both the .mq5 source file and the compiled .ex5 file from your Experts folder to the corresponding folder of the target terminal. The path follows the same structure as the original file location shown earlier.
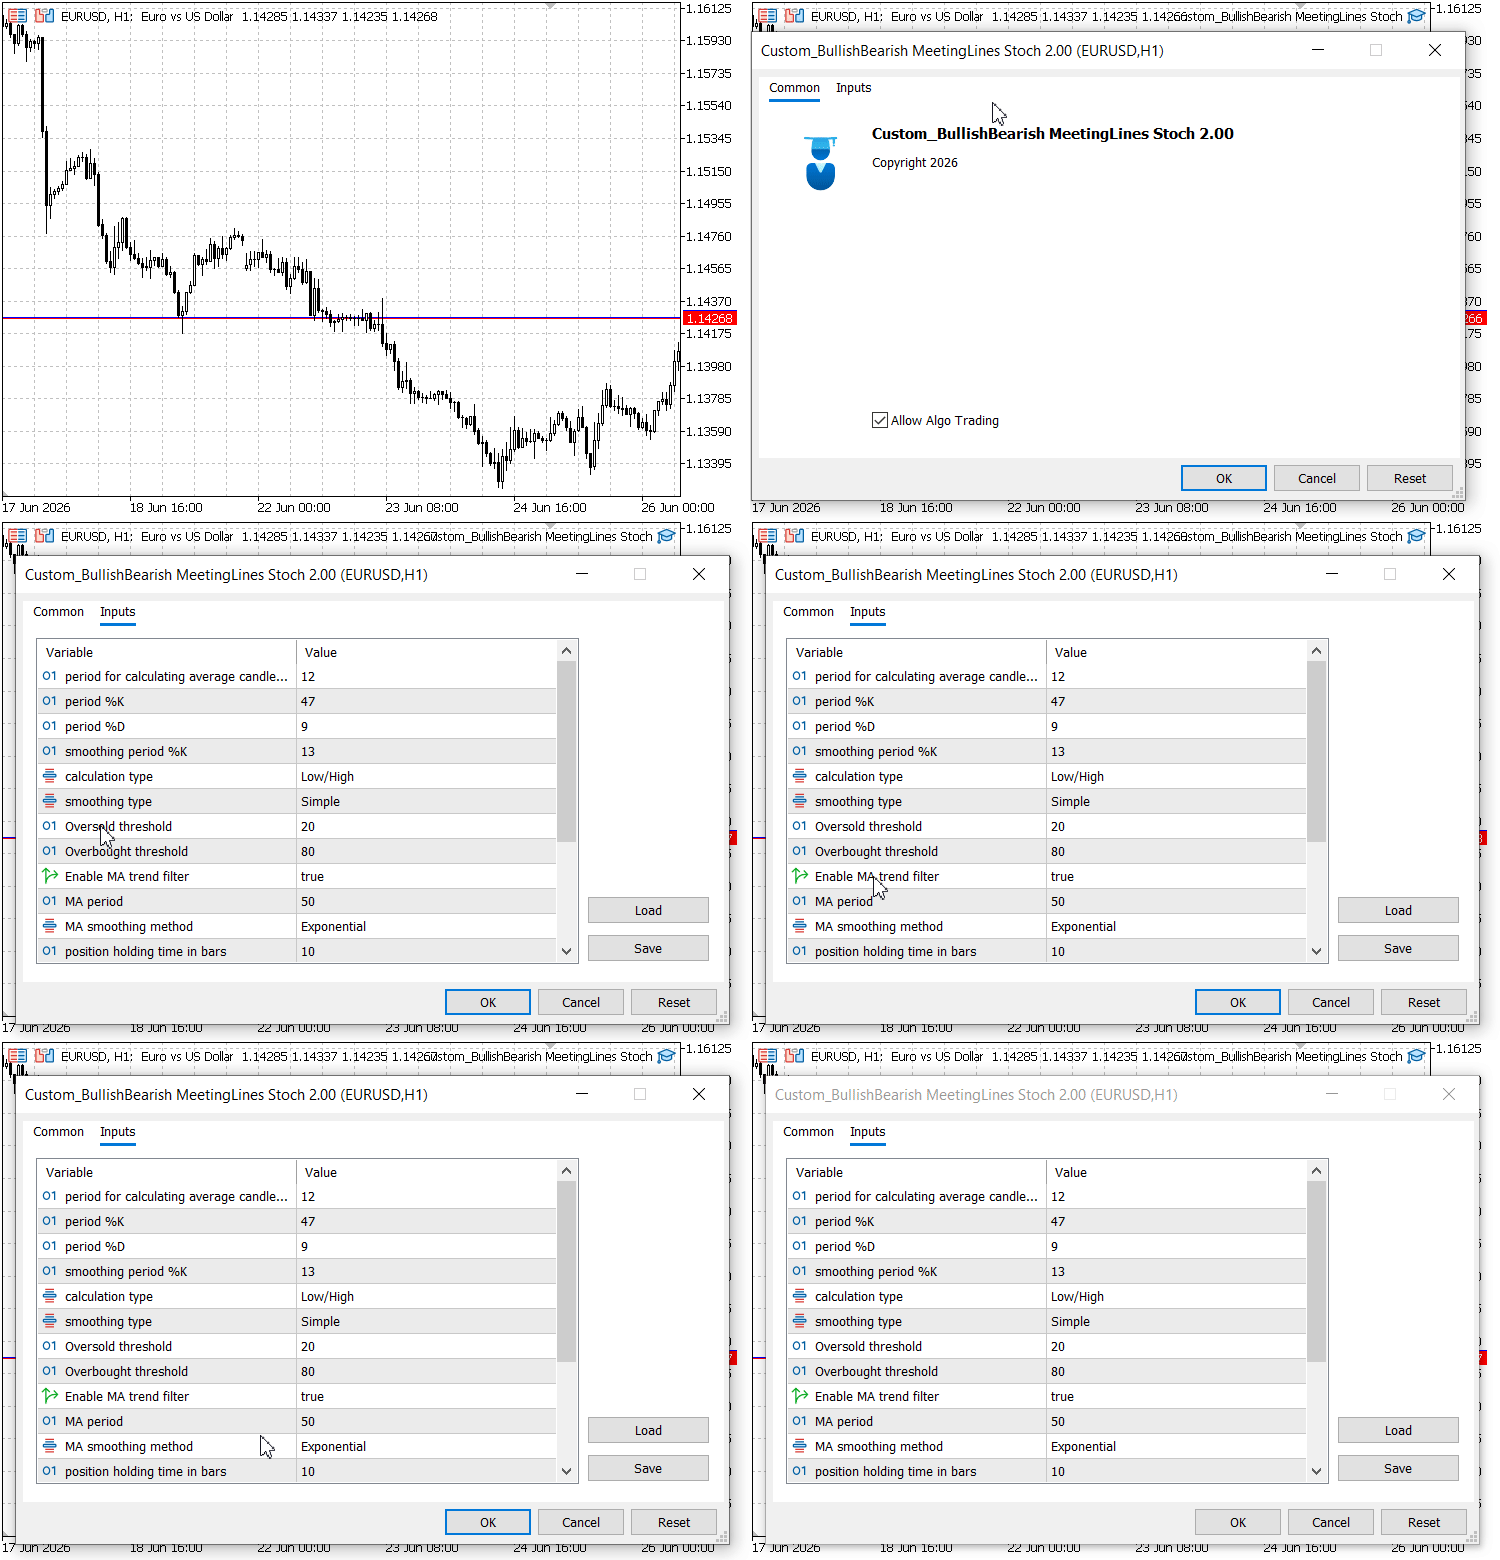
Fig. 3. Launching the Custom EA on MetaTrader 5
What Changed in the Tests
To verify that each modification produces a measurable effect, four backtests were run on EURUSD H1 from 1 January 2023 to 31 December 2025, with a starting deposit of 10,000 USD. The tests used the "Every tick" model on a MetaQuotes-Demo account with default floating spread and no commission. All trade management parameters—stop-loss, take-profit, lot size, and holding duration—remained identical across every run. A parity test confirmed that the custom EA with the MA filter disabled and thresholds set to 30/70 replicates the default EA exactly: both produced a net loss of -245.30, 75 trades, a 40% win rate, and identical drawdown. This validates that the code changes introduce no unintended side effects.
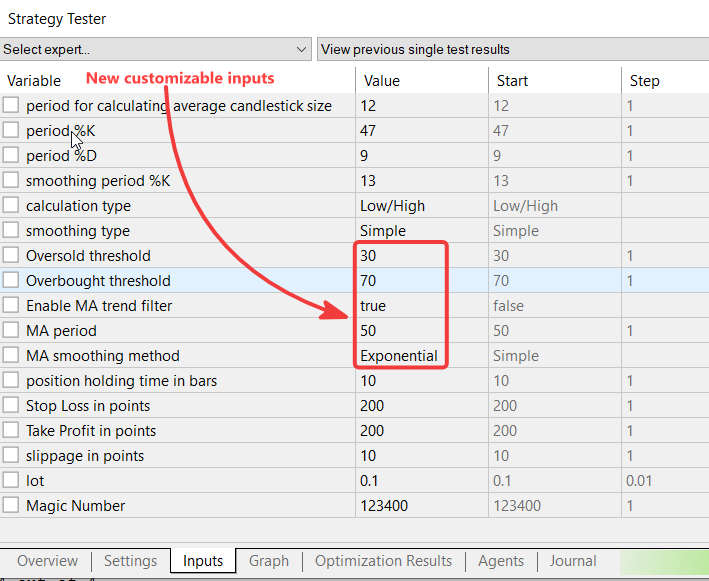
Fig. 4. New Customizable Input Settings
The table below isolates each feature. The first column is the default EA baseline. The second column enables only the Moving Average filter while keeping the original 30/70 Stochastic thresholds. The third column tightens the thresholds to 20/80 while leaving the MA filter off. The fourth column activates both modifications together.
| Metric | Default EA (Stoch 30/70, MA Off) | Custom EA (Stoch 30/70, MA On) | Custom EA (Stoch 20/80, MA Off) | Custom EA (Stoch 20/80, MA On) |
|---|---|---|---|---|
| Total Net Profit | -245.30 | -184.30 | -193.60 | -112.70 |
| Profit Factor | 0.69 | 0.64 | 0.62 | 0.59 |
| Total Trades | 75 | 49 | 45 | 24 |
| Win Rate (%) | 40.00% | 38.78% | 35.56% | 33.33% |
| Max Balance Drawdown | 366.70 (3.66%) | 211.00 (2.11%) | 254.40 (2.54%) | 149.60 (1.49%) |
| Max Consecutive Losses | 14 (-203.10) | 11 (-162.60) | 9 (-142.90) | 7 (-109.50) |
| Average Profit Trade | 18.34 | 17.36 | 20.06 | 20.08 |
| Average Loss Trade | -17.68 | -17.14 | -17.74 | -17.08 |
Table 2. Four-configuration comparison isolating the effect of each modification
Column 2 — MA filter alone. Enabling the 50-period EMA filter with the original 30/70 thresholds cut total trades from 75 to 49, a 35% reduction. The EA rejected 26 signals where a valid candlestick pattern formed and the Stochastic confirmed, but price was on the wrong side of the Moving Average. Net loss fell from -245.30 to -184.30, and the maximum drawdown nearly halved from 3.66% to 2.11%. The longest losing streak shortened from 14 to 11, and the total loss during that streak dropped from -203.10 to -162.60. However, the profit factor decreased from 0.69 to 0.64, and the win rate declined slightly, indicating the filter removed some trades that would have been winners as well as losers.
Column 3 — Stricter thresholds alone. With the MA filter off and thresholds tightened to 20/80, total trades fell further to 45. The EA demanded deeper oversold and overbought readings before confirming, eliminating 30 signals the original thresholds would have accepted. Net loss improved to -193.60 and drawdown to 2.54%. The consecutive loss streak dropped to 9. The average profit per winning trade rose from 18.34 to 20.06, meaning the remaining entries were individually stronger. The average loss remained virtually unchanged. Again, profit factor and win rate declined, confirming that the stricter thresholds made the EA more selective but not necessarily more efficient at converting gross profit to net profitability.
Column 4 — Both modifications combined. Activating the MA filter and the 20/80 thresholds together reduced trades to just 24—less than a third of the original 75. Net loss shrank to -112.70, a 54% reduction from the baseline. Maximum drawdown fell to 1.49%. The longest losing streak fell to 7 trades with a total loss of only -109.50. The average profit per winning trade held above 20.00. However, the profit factor dropped further to 0.59, and the win rate fell to 33.33%, which is an expected consequence of increasing selectivity: fewer trades mean each individual result has a larger relative impact, and the filter does not guarantee that every remaining trade is a winner.
With only 24 trades over three years, the strictest configuration does not provide enough data for statistically robust conclusions. The results should be treated as exploratory rather than definitive, and any apparent patterns need confirmation on out‑of‑sample data before being trusted.
The trades that the MA filter rejected in the MA-filter-on configurations (columns 2 and 4)—signals that passed the Stochastic check but failed the trend alignment test—represent the most valuable data point. Those were trades the original EA would have taken without question. The custom EA logged "Rejected by MA trend filter" and stayed flat. The reduction in net loss and drawdown after removing them indicates the filter rejected many harmful signals, even though some potentially profitable opportunities were also lost.
To provide a broader view, I ran six additional tests with the MA filter always enabled, varying the MA period (20, 100, 400) and the Stochastic thresholds (30/70 and 20/80). The results are shown in Table 3.
| Metric | MA 20 Stoch 30/70 | MA 20 Stoch 20/80 | MA 100 Stoch 30/70 | MA 100 Stoch 20/80 | MA 400 Stoch 30/70 | MA 400 Stoch 20/80 |
|---|---|---|---|---|---|---|
| Total Net Profit | -245.30 | -193.60 | -120.10 | -6.60 | -120.10 | -3.10 |
| Profit Factor | 0.68 | 0.61 | 0.65 | 0.95 | 0.65 | 0.98 |
| Total Trades | 73 | 43 | 32 | 13 | 32 | 17 |
| Win Rate (%) | 39.73% | 34.88% | 37.50% | 46.15% | 37.50% | 47.06% |
| Max Balance Drawdown | 346.70 (3.46%) | 254.40 (2.54%) | 142.40 (1.42%) | 40.00 (0.40%) | 142.40 (1.42%) | 83.90 (0.84%) |
| Max Consecutive Losses | 14 (-203.10) | 9 (-142.90) | 8 (-103.90) | 2 (-40.00) | 8 (-103.90) | 3 (-60.10) |
Table 3. Cross‑parameter variation across different MA periods and Stochastic thresholds
Several patterns emerge from the third table. First, longer MA periods consistently reduce the number of trades. The 20‑period EMA allowed 43–73 trades, while the 100‑period and 400‑period EMAs permitted only 13–32 trades. Second, the combination of a long MA period with strict Stochastic thresholds brought the EA closest to breakeven: the 100‑period EMA with 20/80 thresholds produced a net loss of just -6.60 and a profit factor of 0.95, while the 400‑period EMA with the same thresholds yielded -3.10 and a profit factor of 0.98. Drawdown was dramatically lower in these configurations—0.40% and 0.84% respectively—compared to the default EA's 3.66%. However, the trade counts in these near‑breakeven runs (13 and 17 trades over three years) are too small to draw reliable conclusions. They suggest a direction worth exploring rather than a proven setting.
Third, the MA period matters more than the Stochastic thresholds for risk control. Moving from a 20‑period to a 100‑period EMA reduced drawdown by roughly 80–85%, regardless of whether the thresholds were 30/70 or 20/80. Comparing the MA 100 columns side by side, the 20/80 thresholds produced a smaller net loss (-6.60 vs -120.10) and a higher profit factor (0.95 vs 0.65), confirming that the thresholds do have a meaningful effect when combined with a sufficiently long trend filter. You can reproduce these tests on your own terminals—the input values are listed in the table headers and can be entered directly into the EA properties panel. The attached spreadsheet contains the full backtest reports for all tables.
Conclusion
This article walked you through a complete, repeatable workflow for testing and customizing any built-in MetaTrader 5 program. We started by locating the source code and making a safe working copy. We established a baseline in the Strategy Tester, explored input parameter tuning with real test data, and then moved to code-level modifications when the existing parameters could not express the logic we needed. The result is a customized Expert Advisor with adjustable Stochastic thresholds and an optional Moving Average trend filter—features the original EA simply did not have.
The parameter tuning exercise in Table 1 showed that even simple manual adjustments can produce meaningful improvements. Test 1 (K=57, D=19, Slow=23) delivered a 40% reduction in net loss, a higher profit factor, and a dramatically shorter losing streak—all without touching a single line of code. This proves that input optimization is a valid first step that every trader should explore.
The code modifications built on that foundation. They did not turn the EA into a profitable strategy on EURUSD H1 over the tested period. However, they did measurably reduce trade frequency, net loss, drawdown, and the length of losing streaks. The cross-parameter tests in Table 3 revealed that longer MA periods combined with stricter Stochastic thresholds can bring the EA close to breakeven, though the small trade counts mean those results are exploratory rather than conclusive.
The tests also highlighted important lessons. Externalizing hard-coded values into input parameters opens the door to systematic testing. A simple Moving Average filter can prevent counter-trend trades that the original logic had no way to avoid. At the same time, increased selectivity does not guarantee profitability—profit factor and win rate both declined in our tighter configurations, and the small number of trades in the strictest configurations limits the statistical strength of the conclusions. Input optimization alone, without addressing structural weaknesses, can lead to overfitting, so any optimized settings must be validated on out-of-sample data.
All tests were conducted on a demo account. The numbers are real, but they are specific to EURUSD H1 over the 2023–2025 period with default spread and no commission. Different symbols, timeframes, and execution conditions will produce different outcomes. The value of this article is the methodology you now have to develop and test your own ideas. Use the attached source file and the backtest reports to continue experimenting, and share your findings in the comments section. Until next time.
Attachments:| File Name | Type | Description |
|---|---|---|
| Custom_BullishBearish MeetingLines Stoch.mq5 | Expert Advisor | Modified EA with adjustable Stochastic thresholds and MA trend filter |
| Backtest_Reports.zip | ZIP Archive | Full Strategy Tester reports (XLSX) for all configurations in Tables 1, 2, and 3 |
Warning: All rights to these materials are reserved by MetaQuotes Ltd. Copying or reprinting of these materials in whole or in part is prohibited.
This article was written by a user of the site and reflects their personal views. MetaQuotes Ltd is not responsible for the accuracy of the information presented, nor for any consequences resulting from the use of the solutions, strategies or recommendations described.

 Adaptive Spread Monitoring and Order Gating in MQL5
 Comparing Trade Return Distributions with Mann-Whitney U in MQL5
 Ordinal Pattern Transition Networks in MQL5
 Defining your Edge (Part 1): Using a Discrete Fourier Transform and a Spiking Neural Network in a Trading Robot

- Free trading apps
- Over 8,000 signals for copying
- Economic news for exploring financial markets
You agree to website policy and terms of use