

Master MQL5 — From Beginner to Pro (Part VII): Principles of Debugging MQL Applications
 1 070
1 070
 2
2
Introduction
The previous article in this series discussed the principles of building Expert Advisors in MQL5. I was planning to devote this article to reliable Expert Advisors for the Market that handle recoverable errors, including server responses. And I even started writing it.
However, after reading the previous articles, people started programming—and sending me questions via private message. Of course, these were the kinds of questions beginners usually ask, and of course, I was ready to answer them (and still am). And as I was answering these questions, it struck me quite clearly that before moving on to more advanced programming concepts, I needed to explain how learners can fix errors in their own code or in someone else’s. So I decided that “reliable Expert Advisors” would come next, and for now we need to talk about debugging.
Everyone makes mistakes—some more often than others… If you are new to something, you will make a lot of common mistakes that a professional spots right away and avoids automatically. However, even professionals make mistakes sometimes. Their mistakes are often simply harder to detect and have more serious consequences. And in this sense, programming is no different from any other human activity. However, unlike many other areas of life, programming errors are fairly easy to fix—provided the program code is available and there is enough time.
The process of correcting errors in a program is called debugging. Debugging is almost a mandatory step when writing any program that has more than 100 lines of code. It is impossible to live without making mistakes, but correcting them is our "sacred" right. Therefore, in this article, I will discuss the basics of debugging MQL5 programs using the built-in tools in MetaEditor. I do not think pros will find any major revelations here—after all, this series is for beginners. But if I miss something or get something wrong—as always, everyone is welcome to comment.
Examining Error Messages
The simplest types of errors are typos and syntax errors. For example, if you are rewriting an indicator written in MQL4, you will likely have to fix a few function calls like `iMA` or `ObjectFind`, since these names exist in both versions of the language but use different numbers of parameters and often return values with different meanings. These cases are very straightforward, because the compiler automatically detects them and immediately displays detailed information in the relevant window. For example, try compiling the following code:
//+------------------------------------------------------------------+
//|                                            ErrorsResearching.mq5 |
//|                                       Oleg Fedorov (aka certain) |
//|                                   mailto:coder.fedorov@gmail.com |
//+------------------------------------------------------------------+
#property copyright "Oleg Fedorov (aka certain)"
#property link      "mailto:coder.fedorov@gmail.com"
#property version   "1.00"
#property indicator_chart_window

int g_someInt; // No issues here

//+------------------------------------------------------------------+
//| Custom indicator initialization function                         |
//+------------------------------------------------------------------+
int OnInit()
 {
//--- indicator buffers mapping
  g_some_Int = 5; // There is an error here. The variable name is specified incorrectly
//---
  return(INIT_SUCCEEDED);
 }
//+------------------------------------------------------------------+
//| Custom indicator iteration function                              |
//+------------------------------------------------------------------+
int OnCalculate(const int rates_total,
                const int prev_calculated,
                const datetime &time[],
                const double &open[],
                const double &high[],
                const double &low[],
                const double &close[],
                const long &tick_volume[],
                const long &volume[],
                const int &spread[])
 {
//---

//--- return value of prev_calculated for next call
  return(rates_total);
 }
//+------------------------------------------------------------------+
Example 1. Code that causes a compilation error
The result of compiling this example is shown in Figure 1. The compiler will report an error because the variable name inside the function is specified incorrectly.
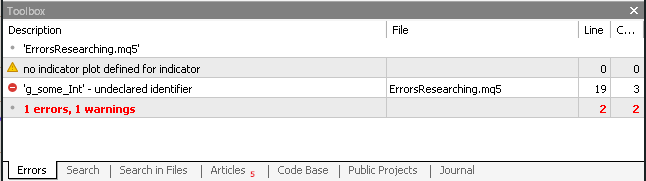
Figure 1. Error message (undeclared variable)
It makes sense to take a closer look at the window shown in Figure 1, even though its elements are obvious. The first column provides a description of the error. In addition, a hint is displayed on the left indicating which category the error belongs to. In this case:
- warnings are marked with a yellow triangle; in principle, lines marked this way can be ignored, but in some cases their presence may cause the program logic to fail, so they should still be analyzed carefully;
- errors are marked with a red “stop” sign; these make compilation impossible;
- neutral messages are marked with gray dots; these are not errors, but simply convey some information.
The column following the error description shows the name of the file in which the error occurred, and the last two columns show the line and column numbers of the error, respectively. All of this together provides the exact location where the compiler “sees” the problem. In most cases, double-clicking the corresponding line is enough to go to that location.
Sometimes the compiler may generate two or more messages for a single error. For example, if the assignment operation in Example 1 is moved to the global scope, as shown in Example 2:
#property indicator_chart_window

int g_someInt; // No issues here
g_someInt = 5; // There is an error here. Operations cannot be performed
               // (except for initialization) in the global scope
Example 2. Attempt to assign a value in the global scope
The result of attempting to compile Example 2 is shown in Figure 2.
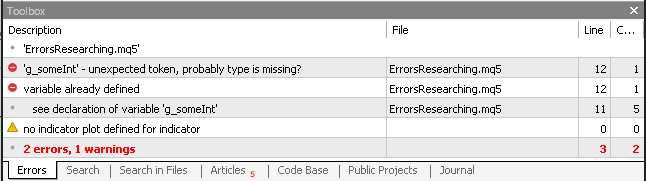
Figure 2. A single error can trigger multiple messages
In this case, the compiler attempts to interpret our variable as a new declaration. However, not only does this declaration omit the variable type, but a variable with that name already exists (declared in the line above). It is clear that in this case, you just need to move the assignment statement back inside any function, and both errors will disappear.
This example offers a clear hint: errors should most often be corrected one at a time, from top to bottom, and you should try to compile after each correction. Of course, this rule is not strict. So, if your compiler generates several messages of the same type—such as unknown variables or undeclared functions—you can, of course, fix them all at once.
And to wrap up this section, I will provide a very brief glossary of key terms for those who do not yet know English well enough to easily understand error messages. This glossary is intended solely to help you make sense of compiler messages when you are just starting out; it probably will not eliminate the need to use regular dictionaries, but it can be helpful for beginners who have not yet gotten around to learning the language thoroughly.
| English | Russian | Description |
|---|---|---|
| unexpected | неожиданный | This usually happens when an action or an important character—such as a semicolon at the end of a statement—is omitted. For example, in Example 2, the compiler assumes that the data type was omitted when the variable was declared. |
| undeclared | неописанный | This usually happens when a programmer makes a mistake in a variable name or forgets to declare a function that is called somewhere else. |
| unbalanced | несбалансированный | Usually refers to brackets. Suppose there is an opening bracket but no closing one, or vice versa. |
| missing | отсутствует | The compiler could not find something important. |
| already | уже́ | Usually in the context of "already exists." |
| wrong | ошибочный, неправильный | This error most commonly occurs in messages indicating an incorrect number of parameters when calling a function. |
| invalid | некорректный, недопустимый | For example, the following code int array_variable[]; array_variable = 5;will cause an "invalid array access" error—that is, invalid access to an array—because I tried to assign a number not to an array element, but directly to the variable. |
Table 1. A Brief Glossary of English Words in Error Messages
Runtime Errors
Now that we have sorted out the compilation errors, the main debugging work is just beginning, because next we need to check whether our program is working correctly. Very often, through inattention, a programmer either skips some important step when designing an algorithm, changes the wrong variable because of “copy-paste,” or performs the actions in the wrong order…
In fact, the sample code in the last row of Table 1 contains two errors. Even if you add square brackets and the element number to the second line of this code, the program still will not work. The thing is, the array array_variable is declared as dynamic, but its size is not specified anywhere, so nothing can be written to it.
Unfortunately, the compiler will let this error pass, since, formally speaking, everything conforms to the language syntax. However, at runtime the program will display an error message: "The array index is outside the valid range" ("array out of range"). You can view these messages (as well as all other messages from your program) on the "Experts" tab of the terminal (Figure 3).

Figure 3. Runtime Error Message
By the way, "out of range" errors (like the one in this example) occur very frequently. The most common cases are:
- price data for a certain period has not been loaded yet, but the program is trying to read them;
- The array index is specified incorrectly; for example, a programmer might forget that the last index of an array is one less than its length, as in the third (commented-out) line of the following example:
int testArray[3]={3,4,5};
int size = ArraySize(testArray);
// Print (testArray[size]); // Error! The program is attempting to access a nonexistent array element
Print (testArray[size-1]); // Everything is fine
Example 3. A typical case of a possible incorrect array index error
Not every algorithmic error results in critical program error messages. Often, the indicator simply “does not draw,” or it plots something completely different from what was intended; the Expert Advisor does not trade even when trading situations are clearly visible in the historical data; the script “freezes” so badly that you have to restart the terminal… And then you have to track down the errors. The most typical methods I use to find them are described below.
Where Debugging Begins
This section contains recommendations that seem so obvious to experienced programmers that they require no explanation whatsoever. However, beginners (judging by the people I have spoken with in person or on forums) repeatedly make the same mistakes, keep getting lost in the same places, and ask the same question in different ways: “Where do I start?” And so…
Start at the beginning. If this is your code, then of course you know it better than anyone else. If it is someone else’s code, try to understand what it does. But at first, do not get bogged down in the specifics. Take your first look from a bird’s-eye view.
- Remember that in Expert Advisors and indicators, everything starts with the OnInit function, while in scripts and services, it starts with OnStart. Each of these functions runs exactly once—when the program starts (although services typically include an infinite loop that handles certain events during trading).
- In indicators, the OnCalculate function is called on every tick; in Expert Advisors, the OnTick function is called. In addition, a timer can be set up in Expert Advisors or indicators, and is handled by the OnTimer function at regular intervals.
- These five functions (OnInit, OnStart, OnCalculate, OnTick, OnTimer) are entry points. Any analysis of someone else's code should start with these. If they contain comments, that's a big plus—just take a look at them. There is a good chance that comments are used to highlight the main logic blocks. If there are no comments, try to quickly see which functions are being used, and try to figure out what they do based on their names. If the code is well-structured and the author does not put everything into a single function—you are in luck. If not, that's okay too, although debugging may take longer. In any case, try to understand the steps involved in executing the algorithm—the relatively large blocks, such as “calculating parameters,” “checking conditions” (for example, whether to draw or not), “iterating through all bars”—and so on. Obviously, this list is far from complete, and it depends heavily on the task at hand.
- Look at the list of additional functions defined in this file using the dedicated button on the toolbar (
 ) or the <Alt>+<M> keyboard shortcut, and try to figure out what they are for based on their names;
 - It can be extremely helpful for beginners to add comments with the names of the blocks at key points (if such comments are missing). It is also very helpful to draw a flowchart of the algorithm (for example, using the DRAKON language or any other tool you find convenient). I will say it again: at this stage, it is best to draw the diagram using relatively large blocks.
- If you have added an indicator buffer to an indicator and the indicator suddenly stops drawing altogether, check the following:
- When mapping indicator buffers to arrays (calls to the SetIndexBuffer function), make sure the numbering has not been thrown off; that is, all numbers are consecutive, with no gaps, starting from 0;
- The indicator_buffers property accurately reflects the total number of buffers, while the indicator_plots property accurately describes the number of buffers visible on the screen;
- The indicator_type, indicator_color, etc. properties are also numbered correctly; however, their numbering starts at 1, and you have described each displayed buffer, whether using properties or built-in functions.
Using Debug Output
The oldest method of finding errors is to print out messages using the Print function (or PrintFormat, whichever you prefer) at key points in the program.
A long time ago, this was the only way to figure out why a program was not working as it should. But even today, this debugging method remains popular because it is simple and fast, and it also lets you save your output as a document that you can review even while riding public transportation or sitting on a park bench.
It goes without saying that such messages should be informative and clearly let the programmer know exactly where they are in the program and what exactly is happening there. People often include special combinations of characters in them—ones not typically found in everyday use (such as "~~" or something similar)—to indicate the type of message or its source. The basic principle behind their use is very simple: messages are placed in key places in the code, and programmers can use them to monitor the situation in the running program.
Let's try using messages to understand and fix the problems in the following code:
void OnStart()
 {
//---
  int i;
//---
  Print("Program starting, 'i' hasn't initialized");
  for(i=0;i<3;i++);
   {
    Print("In the cycle 'i="+i+"'");
   }
  Print("After cycle 'i="+i+"'");
 }
Example 4. Code for a program that works incorrectly.
As an exercise, try to figure out how many messages this program will display—and exactly which ones. I recommend answering these questions before you start reading the explanation below.
It is likely that when this code was written, the program was intended to print five messages: two outside the loop and three inside. But will that work in this case? Let's check:
Program starting, 'i' hasn't initialized
In the cycle 'i=3'
After cycle 'i=3'
Example 5. Program output from Example 4.
The result was unexpected… Why only three messages? Why is the number '3' printed inside the loop, even though the numbers should be from 0 to 2? Should the number in the second line be equal to the number in the third line? Let's start thinking.
- All three stages of our program are executed: before the loop, inside the loop, and after the loop—and that is encouraging.
- The first stage runs without any errors.
- In the third stage, we get the expected result, so we can assume that everything is fine with it, too.
- In the second stage, the same number is printed as in the third, which means the loop is working… although not quite correctly.
Based on the above, we can assume that the problem lies somewhere between the for(i=0; …) expression and outputting the data we need. Let's take a closer look at what is there—in between… Actually, there is a curly brace and a semicolon there.
The curly brace is balanced; otherwise, we would have received a compilation error instead of the warnings that were displayed. It is meant to group one or more simple statements into a block, and in this case it does that successfully; everything between the braces is fine: they contain exactly what we need—no more, no less.
A semicolon indicates the end of a statement. In this case… an empty one. It turns out that, in this case, the loop uselessly increments its variable by one three times, and only then is the variable calculated in the loop displayed to the user. It looks like everything should work if we remove that semicolon. Let's check:
Program starting, 'i' hasn't initialized
In the cycle 'i=0'
In the cycle 'i=1'
In the cycle 'i=2'
After cycle 'i=3'
Example 6. Output of the corrected example
It worked! The problem has been solved.
However, after debugging this way, the code ends up littered with lots of messages that the end user has absolutely no use for. If you are not building the app for yourself, you'll probably need to find and delete all those messages once debugging is complete. But it is inconvenient to do this using a regular search (although sometimes it is necessary). Therefore, when experienced programmers need to add debug output to their code, they often combine them with special preprocessor directives.
If our task were to output the successive values of the loop counter, and the other messages were not needed in the finished application, the correct and convenient code would look like this:
#define DEBUG
//+------------------------------------------------------------------+
//| Script program start function                                    |
//+------------------------------------------------------------------+
void OnStart()
 {
//---
  int i;
//---
#ifdef DEBUG
  Print("Program starting, 'i' hasn't initialized");
#endif

  for(i=0;i<3;i++) // NO semicolon!!!
   {
    Print("In the cycle 'i="+i+"'");
   }

#ifdef DEBUG
  Print("After cycle 'i="+i+"'");
#endif

 }
Example 7. Using conditional compilation directives.
In this example, I declared a macro named DEBUG, and then, in the parts of the program that are needed only during debugging, I instructed the preprocessor to include the message output code in the compiled file only if the DEBUG macro exists. The existence of a macro is checked using the #ifdef directive. In other words, anything between #ifdef and #endif will not be compiled if there is no macro named DEBUG in the program. This way, you can enable or disable these sections simply by deleting or adding the first line—in a single location in your project, even if the project contains multiple files.
Well, to wrap up this chapter, I will say that this particular error (from Example 4) could have been found even more easily if we had paid attention right away, during compilation, to the warning the compiler was trying to convey to us:
empty controlled statement found ErrorsResearching.mq5 23 19
Example 8. Compiler warning about an empty controlled statement
This message says that the compiler found an "empty controlled statement." If you see a message like this, there is most likely an extra semicolon at the specified coordinates. Be sure to check!
Using the Interactive Debugger in MQL5 Programs
MetaEditor, like many modern IDEs, includes a built-in interactive debugger. The word "interactive" means that you can interact with the debugger during the debugging process. The basic principle behind this interaction is that the program is compiled in a special mode—for debugging. This mode allows you to monitor the program's execution directly in the editor, line by line, and see how variables change at key points in the program.
However, unless special measures are taken, the program will run too quickly, and we will not see anything. Therefore, in the editor, we insert special markers called "breakpoints" (English: breakpoint). They allow you to pause inside the functions of our program and view the values of variables at the moment of the pause. Once all variable values at the breakpoint are clear, you can either execute the next statement or "resume" execution to the next breakpoint.
During the debugging process itself, everything seems intuitive to me, but just in case, I will describe which buttons to click.
- Breakpoints are usually set either at the very beginning of execution or after a pause.
- To set or remove a breakpoint, place the cursor on any line within the function and use any of the following methods:
-
double-click in the column containing the line numbers of the current program;
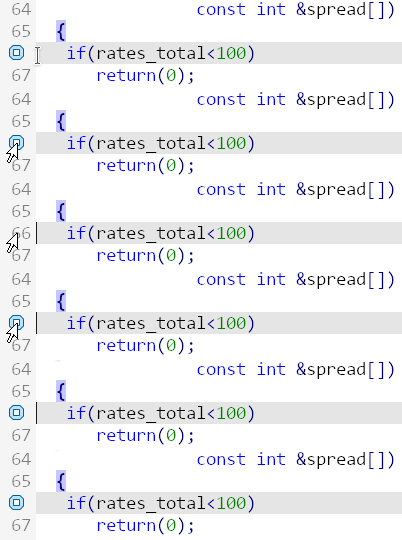
Figure 4. Toggling a breakpoint with a double-click
- the <F9> key;
- Use the context menu of the desired line or select "Debug" in the main menu -> "Toggle Breakpoint" (Figure 5).
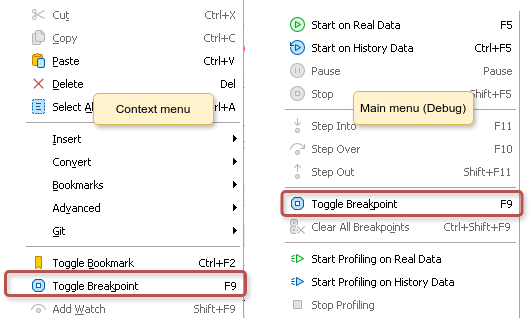
Figure 5. The "Toggle Breakpoint" menu item.
- If you have set several breakpoints but no longer need them, you can delete them all at once using the "Debug" menu (in Figure 5, the item you need is in the menu on the right, directly below the red frame) or by pressing the <Ctrl>+<Shift>+<F9> key combination.
You can work with the program in debug mode using the toolbar section shown in Figure 6.
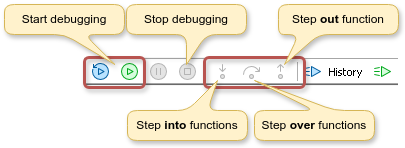
Figure 6. A section of the toolbar intended for debugging.
The left button (  ) starts debugging on historical data, while the right button (
  ) starts debugging on live market data. The blue button opens the Strategy Tester, and the green button opens a new chart directly in the terminal. Here are some differences between the modes:
- if you need to understand how the program being debugged works, that is, to perform step-by-step debugging on the zero bar, there is no fundamental difference between the buttons, although, of course, there is still a huge difference between the tester and the terminal;
- in the tester, you cannot use any analysis tools other than the running program;
- However, parameter optimization for the program is available there;
- You can see, step by step, how the program behaves over a long period of time;
- the terminal data loads faster during initial loading;
- It is usually convenient to debug programs on live market data if they do not trade, especially indicators and scripts;
- But it is better to debug automated trading on historical data, if only to avoid incurring losses.
No matter which debugging mode you choose, once the program starts, the buttons for step-by-step code execution (on the right side of the panel), outlined in Figure 5, will become available. Each of them executes the next step of the program, but does so in a different way.
- The leftmost button (
 ) performs the next step by stepping into each function whose source code is available (not standard terminal functions).
 - The middle button (
 ) executes each function in a single step, as if stepping over it from the outside, regardless of whether it is a built-in terminal function or a user-defined one.
 - The button on the far right in this group (
 ) lets you finish the current function in one step and return to the point from which the function was called.
The button (  ) ends the current debugging session.
The button (  ) pauses the running program at some unpredictable point (usually at the beginning of the OnCalculate function or other functions called periodically by the terminal).
In the bottom panel of the debugging window, the entire call stack is shown on the left: the last functions that were called before the current one was reached. On the right is a list of all the variables in this function. The values in this window will update automatically as soon as they change in the program.
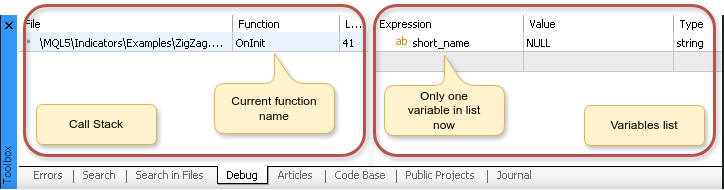
Figure 7. Bottom panel in debugging mode: list of variables and call stack
You can also add expressions to be evaluated to the right side of this panel, such as variable names (for example, global variables) or operations such as arithmetic, logical, or bitwise operations. To add an expression to the list, you can:
- select it in the program text and press <Shift>+<F9>;
- right-click the selected expression and choose "Add Watch" from the context menu (English: "Add Watch");
- double-click an empty row in the list of variables and enter the expression directly.
To view the contents of an array or structure, double-click it. However, it is better not to try to expand arrays such as high or time in indicators: sometimes this can cause even a powerful computer to freeze for quite a while. It is better to simply enter the array name with an index on a separate line, for example, time[i].
If you need to display a specific member of a structure or class, autocomplete works great: you can put a period at the end of the name or press <Ctrl>+<Space> — the usual pop-up hint should appear. But adding function calls, unfortunately, is not possible.
As an exercise, I suggest taking a closer look at a standard indicator, such as ZigZag. Open the file "Indicators -> Examples -> ZigZag.mq5" and perform each action described in the following sections in your editor.
-
The first thing we need to do is figure out what user-defined functions this indicator has. To jump to a function, simply click its name in the list (Figure 8).
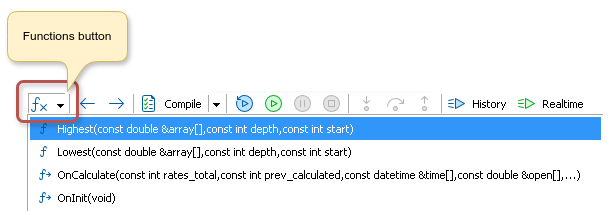
Figure 8. List of functions in the ZigZag indicator
-
Let's set the breakpoints. Let's start with the OnInit function, where we will set a breakpoint at the beginning (at the time of writing, this is line 41 for me), and in OnCalculate—at the beginning (line 66) and where the search for extrema begins (line 118)—to see how the buttons (
 ) and (
  ) work differently.
 -
Now we can run our program. In this case, any of the buttons on the left will work. Let's say we click the green one (
 ).
). -
As soon as we hit the first breakpoint in the OnInit function, we can quickly scan through it, make sure it is straightforward—everything is clear—and then safely click the button (
 ) to move on to the next function.
 - The next stop is in the OnCalculate function, on the first line, if you followed the recommendations. It is worth taking a closer look at this function because it contains many solutions that are useful for indicator developers. So feel free to explore, and use the buttons (
 ) or (
  ) to move on to the next step.
 - To explore the for, while, and do … while loops, you can run through them a couple of times from start to finish, step by step, and then use breakpoints after completion of each loop and continue executing the loops using the (
 ) or (
  ) buttons until you reach line 118.
 - Step through the following loop at least once using the button (
 ) (Step Into), and note how the entries in the call stack (shown in Figure 7, on the left) change.
 - Make the second pass through the loop using the button (
 ) (Step Over) to see the difference.
 - The rest of the indicator's code will not introduce anything new in terms of debugging techniques, so use the techniques you have already learned to figure out what is happening.
- To end debugging, you can click the
 button (End Debugging).
Profiling
If you have several programs running on a chart, and there are many such charts, it is important that each program runs quickly. However, sometimes a programmer uses inefficient algorithms, and even though the task is solved, the program can still be impractically slow. This is especially true for low-spec machines, such as older netbooks, which can still sometimes be found among traders in perfectly working condition.
Profiling is used to identify which function is preventing the program from running properly (or, more precisely, to determine how time is distributed among the functions). During this process, MetaEditor measures the execution time of each function in our program and, if that time is at all significant, displays it in the form of a dedicated diagram.
Let's try profiling the operation of that same ZigZag indicator. To do this, you can use either the corresponding toolbar (Figure 9) or the "Debug" menu (Figure 10). The profiling procedure is not needed very often, so the developers did not provide a keyboard shortcut for it.

Figure 9. Profiling control panel.
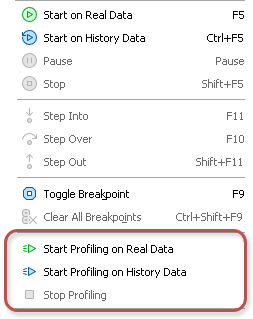
Figure 10. The Profiling section in the "Debug" menu.
As with debugging, profiling can be run on either live data or historical data (the green and blue buttons, respectively). The second command (  ) stops the profiling procedure (shown as inactive in Figures 9 and 10).
The whole process is simple and straightforward:
- start the profiling procedure with the "Start" button;
- wait a while so the program has time to run to completion;
- stop the procedure with the "Stop" button;
- examine the charts and fix whatever we can (in the case of ZigZag, there is probably nothing to fix…).
When I profiled the standard ZigZag indicator (on one of those really old netbooks), I ended up with the following table (Figure 11):
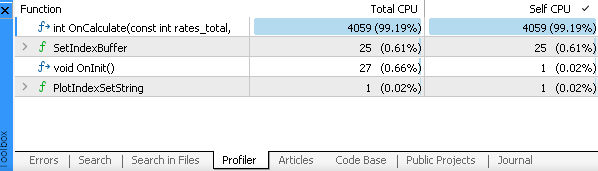
Figure 11. Profiling result for the standard ZigZag indicator.
It turned out that SetIndexBuffer takes up the lion’s share of the time in OnInit, while Highest and Lowest are so fast that they do not even appear in this comparison. As expected, OnCalculate turned out to be the slowest—after all, this is where most of the work actually takes place, and it is called much more often than OnInit. It is possible that the performance of this function could be significantly improved.
The developers at MetaQuotes have optimized the code of this indicator very well, but… Maybe you will be the one to come up with a faster algorithm?
Conclusion
Application debugging is one of the most challenging stages of the software development lifecycle. In some projects, it can take up to 70% of the time, and sometimes even more. Even projects that run successfully and have thousands of users may contain errors. So what can we say about beginners' code? But I hope that the debugging techniques described in this article will help beginner programmers find their own errors more easily and effectively study other people's algorithms.
Translated from Russian by MetaQuotes Ltd.
Original article: https://www.mql5.com/ru/articles/18075
Warning: All rights to these materials are reserved by MetaQuotes Ltd. Copying or reprinting of these materials in whole or in part is prohibited.
This article was written by a user of the site and reflects their personal views. MetaQuotes Ltd is not responsible for the accuracy of the information presented, nor for any consequences resulting from the use of the solutions, strategies or recommendations described.



 Making Custom Indicators for Beginners (Part 2): Fisher-style Indicator
 Ebola Optimization Search Algorithm (EOSA)
 Automating Chart Patterns in MQL5 (Part 2): The Double Top and Double Bottom
 The Mathematics of Volatility: Why the GRI Indicator Deserves to Return to Your Trading Terminal

- Free trading apps
- Over 8,000 signals for copying
- Economic news for exploring financial markets
You agree to website policy and terms of use