

Building a Trade Analytics System (Part 4): Summary Metrics and Dashboard
 2 200
2 200
 0
0

Introduction
In the previous parts of this series, we built a pipeline for closed trades in MetaTrader 5. An Expert Advisor detects a closure, extracts trade details, and sends them to the server as JSON. The backend validates the payload and stores it in an SQLite database. Closed trades are now captured reliably outside the terminal.
Storage alone, however, provides little value if the data cannot be interpreted. Currently, the system maintains an unorganized collection of trades and lacks a clear mechanism for performance evaluation. By implementing aggregation and summarization, we can turn this raw information into actionable trading insights.
In this series, we set out to build a trade analytics system for MetaTrader 5. We have already established the data capture, transmission, and storage layers. This final part focuses on using that stored data to compute meaningful performance metrics and to present them in a simple, accessible way.
The goal here is practical. We will extend the existing analytics endpoint to calculate summary statistics from the stored trades and return them as JSON. In addition, we will update the API root to render a minimal web page that displays these statistics for quick inspection in a browser. This completes the system by connecting stored data to a clear and usable representation.
Prerequisites
Before proceeding, make sure you are comfortable with the following:
- Basic Python and Flask development. You should understand routes, request handling, JSON responses, and simple database queries.
- Familiarity with the previous parts of this series. This part builds on the existing Expert Advisor, Flask backend, and SQLite database created earlier.
- Basic understanding of MetaTrader 5 and MQL5. You do not need to modify the bridge EA heavily in this part, but knowing how the trade data reaches the backend will help.
- Basic HTML and CSS knowledge. We will create a simple browser page to display summary statistics. Advanced frontend experience is not required.
- A working local setup. The Flask backend should run correctly, and the SQLite database should already contain or be ready to receive trade records.
Recap of the Current System
An Expert Advisor runs inside MetaTrader 5 and listens for closed trade events. Once a position is finalized, the EA extracts the required trade information, formats it as JSON, and transmits it to the backend over HTTP. Capturing only completed trades keeps the backend workflow simpler and avoids processing incomplete position data. The complete implementation of this bridge Expert Advisor, developed earlier in Part 2 of the series, is included in the attached tradeAnalyticsBridge.mq5 source file.
Each closed-trade record contains identifiers and performance fields: symbol; order, deal, and position tickets; position type and reason; lot size; entry price; stop-loss and take-profit levels; profit; open and close times; and magic number. These fields provide a complete snapshot of each trade and are sufficient for computing meaningful performance metrics.
Once the data is collected, it is formatted as JSON and sent to the server using HTTP. Specifically, the Expert Advisor issues a POST request to the API endpoint. This allows the backend to receive structured data in a consistent format that can be easily parsed and processed.
At the backend, a Flask application receives the incoming request, validates the payload, and converts the data into appropriate types where necessary. The processed data is then stored in an SQLite database. Each trade is recorded as a row in the trades table, making the data persistent and accessible for future queries and analysis.
Role of the Bridge Expert Advisor
The bridge Expert Advisor connects MetaTrader 5 to the Flask backend. It detects closed positions, extracts their details, and sends trade records to the backend for storage and analysis.
Without it, the backend would have no direct access to completed trading activity occurring inside the terminal. The Expert Advisor makes it possible to export finalized trade records such as: symbol; position type; lot size; entry price; profit; timestamps; and ticket identifiers outside MetaTrader 5 in a structured format.
The EA operates in an event-driven manner using the OnTradeTransaction event handler. Whenever a position is closed, the EA detects the corresponding trade event, reads the associated deal information from the trading history, and extracts the required values. These include: the order ticket; deal ticket; position ticket; symbol; position type; position reason; stop loss; take profit; profit; open time; close time; and magic number.
After collecting the required fields, the EA formats the data as JSON and sends it to the backend using an HTTP POST request through WebRequest. This allows the Flask application to receive the trade information in a consistent structure that can be validated, converted, and stored in the SQLite database.
To use the bridge EA, it must be attached to a MetaTrader 5 chart with WebRequest permissions enabled for the backend URL. Once active, the EA automatically listens for closed positions and transmits their records to the backend whenever a trade is finalized.
The complete implementation of this component, developed earlier in Part 2 of the series, is included in the attached tradeAnalyticsBridge.mq5 source file.
Making Sense of Stored Trade Data
At this stage, the system is able to capture and store closed trade data. While this is an important step, the stored data on its own does not provide clear insight into trading performance.
Looking at individual trade records one by one is not practical, especially as the number of trades increases. A trader is rarely interested in a single trade in isolation. Instead, the focus is usually on overall performance, such as how many trades were taken, how many were profitable, and whether the strategy is producing consistent results.
To make this possible, the stored data needs to be aggregated. This involves combining individual trade records and computing summary values that describe overall performance. In this part of the series, we will use the stored trade data to compute a set of simple performance metrics that provide a clearer view of trading activity.
The following metrics will be implemented:
- Total Trades: The total number of closed trades stored in the database.
- Total Profit: The sum of profit across all trades.
- Winning Trades: The number of trades where profit is greater than zero.
- Losing Trades: The number of trades where profit is less than zero.
- Win Rate: The ratio of winning trades to total trades.
- Average Profit per Trade: The total profit divided by the number of trades.
- Average Trade Duration: The average time between trade opening and closing.
- Maximum Trade Duration: The longest recorded trade duration.
- Minimum Trade Duration: The shortest recorded trade duration.
These metrics are computed directly from the stored trade data and provide a compact summary of performance without introducing unnecessary complexity.
Designing the Analytics Logic
At this stage, the structure of the backend does not need to change. The endpoints introduced earlier remain sufficient for computing and presenting trade statistics. The goal here is to extend the existing logic rather than introduce new routes.
The analytics endpoint already exists and is defined to return a response at "/api/v1/analytics/summary". In its current form, it contains placeholder logic. In this part, that placeholder will be replaced with calculations that operate on the stored trade data. The endpoint will query the stored records, compute the summary metrics outlined in the previous section, and return the results as a JSON response.
This endpoint continues to serve as the machine-readable interface. Any external system, script, or tool can request this route and receive structured data. Keeping this endpoint unchanged ensures that the API remains consistent and reusable.
For displaying the results in a browser, we will use the existing API root at "/api/v1". Instead of returning a simple message, this route will render a minimal HTML page that presents the same summary metrics in a readable format. This avoids introducing additional endpoints while still providing a way to view the results directly.
This approach creates a clear separation of responsibilities. The analytics endpoint focuses on computing and returning data, while the API root is responsible for presenting that data in a simple visual form. The logic remains centralized, and the overall design stays compact and easy to maintain.
Implementing Summary Metrics
We will now implement the summary metrics inside the existing analytics endpoint. Open the app.py file and locate the following route:
@app.route("/api/v1/analytics/summary", methods=["GET"])
def analytics_summary():
This route already returns basic information, but the logic is still minimal. We will extend it to compute the full set of performance metrics described earlier. The first step is to retrieve all stored trade records from the database:
trades = Trade.query.all()
This returns a list of Trade objects, each representing a closed trade. From this collection, we can compute aggregate values.
Computing Core Metrics
The first step is to determine how many trades exist in the database. This is done by counting the number of Trade objects returned from the query. In addition, we compute the total profit by summing the profit field across all trades. These two values provide a basic overview of trading activity and overall performance.
total_trades = len(trades)
total_profit = sum(trade.profit for trade in trades)
A trade is considered a winning trade if its profit is greater than zero, and a losing trade if its profit is less than zero. This classification allows us to measure how frequently trades result in gains or losses.
To perform this classification, we iterate through the list of trades and count how many satisfy each condition. The following code uses generator expressions to compute these counts efficiently:
winning_trades = sum(1 for trade in trades if trade.profit > 0)
losing_trades = sum(1 for trade in trades if trade.profit < 0)
Each expression evaluates the profit value of every trade and increments the count when the condition is met. The result is two separate values representing the number of winning and losing trades. These values will be used later to compute additional performance metrics such as the win rate.
The win rate provides a quick measure of how frequently trades result in profit. It is calculated as the ratio of winning trades to the total number of trades. This value helps summarize performance in a single figure and is commonly used to assess consistency.
To compute the win rate, we divide the number of winning trades by the total number of trades. However, care must be taken when no trades exist in the database. In such a case, dividing by zero would result in an error. To prevent this, we include a simple condition that returns zero when the total number of trades is zero.
The calculation is implemented as follows:
win_rate = (winning_trades / total_trades) if total_trades > 0 else 0
This ensures that the computation remains safe while still returning a valid value. The resulting win rate can be interpreted as a proportion, where a higher value indicates a greater percentage of profitable trades.
In addition to the win rate, it is useful to understand how much each trade contributes on average. This is done by computing the average profit per trade, which provides a simple measure of overall efficiency.
The average profit is calculated by dividing the total profit by the number of trades. Similar to the previous calculation, we must handle the case where no trades exist to avoid division by zero. If there are no trades, the value is set to zero.
The implementation is as follows:
average_profit = (total_profit / total_trades) if total_trades > 0 else 0
Computing Time-Based Metrics
Each trade record contains both an opening time and a closing time. These two values can be used to determine how long a trade was held. This duration is useful when analyzing trading behavior, as it provides insight into how quickly positions are opened and closed.
To compute trade durations, we subtract the opening time from the closing time for each trade. This operation returns a time difference, which is then converted into seconds for consistency and easier computation. The result is a list of duration values, where each value represents the lifespan of a single trade.
The implementation is as follows:
durations = [
    (trade.close_time - trade.open_time).total_seconds()
    for trade in trades
]
This list comprehension iterates through all trades and calculates the duration for each one. The resulting list serves as the basis for further calculations.
Once the durations are available, we compute summary values that describe the overall behavior of trade holding times. These include the average duration, as well as the maximum and minimum durations observed:
average_duration = sum(durations) / len(durations) if durations else 0
max_duration = max(durations) if durations else 0
min_duration = min(durations) if durations else 0
The average duration provides a general measure of how long trades are typically held. The maximum duration highlights the longest trade recorded, while the minimum duration identifies the shortest one. Together, these values offer a concise view of trade timing without requiring detailed inspection of individual records.
Final Endpoint Implementation
Next, we combine the calculations into the final analytics endpoint. It retrieves stored trades, computes summary metrics, and returns them as JSON.
Open the app.py file and locate the analytics route. Replace its contents with the following implementation:
@app.route("/api/v1/analytics/summary", methods=["GET"])
def analytics_summary():
    trades = Trade.query.all()

    total_trades = len(trades)
    total_profit = sum(trade.profit for trade in trades)

    winning_trades = sum(1 for trade in trades if trade.profit > 0)
    losing_trades = sum(1 for trade in trades if trade.profit < 0)

    win_rate = (winning_trades / total_trades) if total_trades > 0 else 0
    average_profit = (total_profit / total_trades) if total_trades > 0 else 0

    durations = [
        (trade.close_time - trade.open_time).total_seconds()
        for trade in trades
    ]

    average_duration = sum(durations) / len(durations) if durations else 0
    max_duration = max(durations) if durations else 0
    min_duration = min(durations) if durations else 0

    summary = {
        "total_trades": total_trades,
        "total_profit": total_profit,
        "winning_trades": winning_trades,
        "losing_trades": losing_trades,
        "win_rate": win_rate,
        "average_profit": average_profit,
        "average_trade_duration": average_duration,
        "max_trade_duration": max_duration,
        "min_trade_duration": min_duration
    }

    return jsonify(summary), 200
This implementation brings together all previously defined calculations into a single response. The route begins by retrieving all stored trades and then computes each metric directly from that data. The results are organized into a dictionary, which is returned as a JSON response.
At this point, the analytics endpoint is fully functional. It provides a concise summary of trading performance that can be accessed through a browser or consumed by other applications. This also prepares the system for the next step, where the same data will be displayed in a simple web interface.
Testing the Analytics Summary Endpoint
After implementing the analytics endpoint, verify it against real stored trades. Ensure the database contains a few closed trades; if it is empty, open and close test trades in MetaTrader 5 and let the bridge EA transmit them to the backend.
In my test, I had already opened and closed several trades, and six trade records had been committed to the SQLite database. This provided enough data to confirm that the endpoint was reading stored records and computing summary values correctly.
Follow these steps to replicate the test.
Start the Flask backend from the project directory:
flask --app app run --host 0.0.0.0 --debug
- Open MetaTrader 5 and attach the bridge EA to one chart only.
- Open a few test trades and close them. Each closed trade should be sent to the backend and stored in the database.
- Confirm that records exist by opening the trades endpoint in your browser:
http://127.0.0.1:5000/api/v1/trades
After confirming that trades are stored, open the analytics endpoint:
http://127.0.0.1:5000/api/v1/analytics/summary The browser should display a JSON response containing the computed summary metrics. In my case, the response confirmed that six trades were available in the database and that the endpoint was able to calculate the statistics from those records.
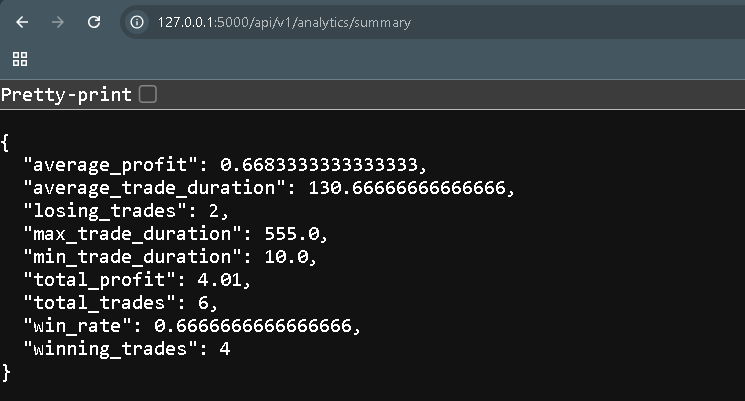
This confirms that the endpoint is working as intended. It retrieves stored trade records, applies the metric calculations, and returns the results in a structured JSON format that can be used by a browser, script, or dashboard.
Building a Simple Web Dashboard for Trade Analytics
The analytics endpoint now returns summary metrics as JSON. This is useful for software clients, but it is not the most convenient way to inspect the results visually. To make the output easier to read in a browser, we will render a simple dashboard using Flask templates.
We will not place HTML directly inside the route. Instead, we will separate the page structure and styling into their own files. This keeps the backend logic cleaner and follows the normal Flask project structure.
Open the terminal inside the backend project directory:
cd mt5TradeAnalyticsBackend
Create a folder named templates:
mkdir templates
Inside this folder, create the HTML file:
touch templates/index.html
Next, create a folder named static for styling files:
mkdir static Inside the static folder, create a CSS stylesheet:
touch static/style.css At this point, the project should contain these new files:
mt5TradeAnalyticsBackend/

    app.py

    templates/
        index.html

    static/
        style.css
Now open app.py and update the Flask import line to include "render_template" and "url_for":
from flask import Flask, jsonify, request, redirect, render_template, url_for
The "render_template" function allows Flask to load an HTML file from the templates folder and pass values into it. These values can then be displayed using Jinja template syntax. "url_for" is used to create dynamic URLs.
Next, locate the current API root route:
@app.route("/api/v1")
def api_root():
    return "<p>MT5 Trade Analytics API v1 is running.</p>"
We will update this route so it computes the same summary metrics and passes them to "index.html":
@app.route("/api/v1")
def api_root():
    trades = Trade.query.all()

    total_trades = len(trades)
    total_profit = sum(trade.profit for trade in trades)

    winning_trades = sum(1 for trade in trades if trade.profit > 0)
    losing_trades = sum(1 for trade in trades if trade.profit < 0)

    win_rate = (winning_trades / total_trades) if total_trades > 0 else 0
    average_profit = (total_profit / total_trades) if total_trades > 0 else 0

    durations = [
        (trade.close_time - trade.open_time).total_seconds()
        for trade in trades
    ]

    average_duration = sum(durations) / len(durations) if durations else 0
    max_duration = max(durations) if durations else 0
    min_duration = min(durations) if durations else 0

    return render_template(
        "index.html",
        total_trades=total_trades,
        total_profit=round(total_profit, 2),
        winning_trades=winning_trades,
        losing_trades=losing_trades,
        win_rate=round(win_rate * 100, 2),
        average_profit=round(average_profit, 2),
        average_duration=round(average_duration, 2),
        max_duration=round(max_duration, 2),
        min_duration=round(min_duration, 2)
    )
This route still uses the existing "/api/v1" endpoint. The difference is that it now returns an HTML dashboard instead of a plain text message.
Now open "templates/index.html" and add the page structure:
<!DOCTYPE html>
<html>
<head>
    <title>MT5 Trade Analytics Dashboard</title>
    <link rel="stylesheet" href="{{ url_for('static', filename='style.css') }}">
</head>
<body>

<div class="container">
    <h1>MT5 Trade Analytics Dashboard</h1>
    <p class="subtitle">Summary statistics computed from stored closed trade records.</p>

    <div class="section">
        <h2>Performance Summary</h2>

        <div class="grid">
            <div class="card">
                <span class="label">Total Trades</span>
                <strong>{{ total_trades }}</strong>
            </div>

            <div class="card">
                <span class="label">Total Profit</span>
                <strong>{{ total_profit }}</strong>
            </div>

            <div class="card">
                <span class="label">Win Rate</span>
                <strong>{{ win_rate }}%</strong>
            </div>
        </div>
    </div>

    <div class="section">
        <h2>Trade Breakdown</h2>

        <div class="grid">
            <div class="card">
                <span class="label">Winning Trades</span>
                <strong>{{ winning_trades }}</strong>
            </div>

            <div class="card">
                <span class="label">Losing Trades</span>
                <strong>{{ losing_trades }}</strong>
            </div>

            <div class="card">
                <span class="label">Average Profit</span>
                <strong>{{ average_profit }}</strong>
            </div>
        </div>
    </div>

    <div class="section">
        <h2>Trade Duration</h2>

        <div class="grid">
            <div class="card">
                <span class="label">Average Duration</span>
                <strong>{{ average_duration }} sec</strong>
            </div>

            <div class="card">
                <span class="label">Maximum Duration</span>
                <strong>{{ max_duration }} sec</strong>
            </div>

            <div class="card">
                <span class="label">Minimum Duration</span>
                <strong>{{ min_duration }} sec</strong>
            </div>
        </div>
    </div>
</div>

</body>
</html>
The values inside double curly braces are placeholders handled by Jinja. When Flask renders the page, each placeholder is replaced with the value passed from the api_root route.
Finally, open "static/style.css" and add basic styling:
body {
    font-family: Arial, sans-serif;
    background: #f5f7fa;
    margin: 0;
    padding: 40px;
}

.container {
    max-width: 1000px;
    margin: auto;
}

h1 {
    margin-bottom: 8px;
    color: #222;
}

.subtitle {
    color: #666;
    margin-bottom: 30px;
}

.section {
    margin-bottom: 32px;
}

.section h2 {
    color: #333;
    margin-bottom: 14px;
}

.grid {
    display: grid;
    grid-template-columns: repeat(3, 1fr);
    gap: 16px;
}

.card {
    background: white;
    padding: 22px;
    border-radius: 10px;
    box-shadow: 0 2px 8px rgba(0, 0, 0, 0.08);
}

.label {
    display: block;
    color: #666;
    font-size: 14px;
    margin-bottom: 8px;
}

.card strong {
    color: #111;
    font-size: 24px;
}
This styling keeps the page simple while making the metrics easier to read. The dashboard is divided into sections for performance, trade breakdown, and duration statistics. Each metric is displayed in a card, which gives the page enough structure without turning it into a full frontend project.
With this update, the backend now provides two views of the same computed statistics. The "/api/v1/analytics/summary" endpoint returns JSON for software clients, while "/api/v1" renders a simple browser dashboard for quick visual inspection.
Testing the Web Dashboard
The dashboard is rendered using the "/api/v1" route, which retrieves the stored trade records, computes the same summary metrics, and passes them to the HTML template for display.
Follow these steps to verify the dashboard:
- Ensure the Flask application is running:
flask --app app run --host 0.0.0.0 --debug
- Open your browser and navigate to:
http://127.0.0.1:5000/ - The root route redirects to:
http://127.0.0.1:5000/api/v1 - The dashboard page should load and display the summary metrics in a structured layout.
If you followed the previous test, the database should already contain several trade records. In my case, six trades were stored, and the dashboard displayed the corresponding values for total trades, profit, win rate, and duration metrics.
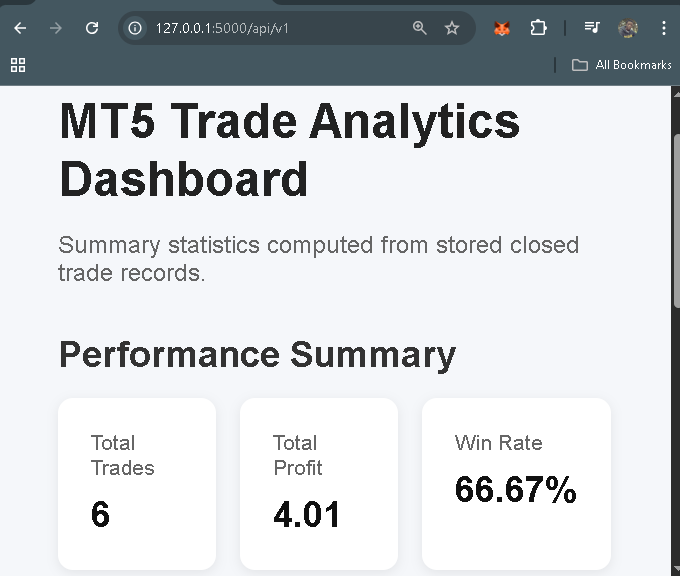
To confirm correctness, compare the values displayed on the dashboard with those returned by:
http://127.0.0.1:5000/api/v1/analytics/summary Both outputs should match, since they are computed from the same stored data.
This confirms that:
- The dashboard route is correctly rendering the HTML template.
- The backend is passing computed values to the template using "render_template".
- The displayed values accurately reflect the stored trade data.
- The system now supports both JSON output for API use and a browser-based view for quick inspection.
At this point, the web dashboard is fully functional and provides a clear visual representation of the computed trade metrics.
Current Limitations
At this stage, the system successfully captures, stores, and summarizes closed trade data, and presents the results through both API endpoints and a simple web dashboard. While this completes the core pipeline, there are still a few limitations in the current implementation.
- The validation logic focuses on required fields and basic type conversion. It does not yet enforce strict value constraints, such as acceptable ranges for prices, lot sizes, or timestamps.
- The API does not implement authentication or access control. All endpoints are publicly accessible, which may not be suitable for deployment beyond a local or controlled environment.
- The system processes each trade request independently without retry or queue mechanisms. If a request fails due to network or server issues, the data may be lost unless handled externally.
- The analytics endpoint computes basic summary metrics only. More advanced statistics, filtering, or time-based analysis are not included in this implementation.
- The web dashboard is intentionally minimal. It provides a static view of the metrics without interactive features, charts, or real-time updates.
- The backend relies on a single SQLite database file. While sufficient for development and testing, this setup may not scale well for high-frequency trading or multi-user environments.
These limitations do not affect the correctness of the current pipeline but highlight areas for improvement. They provide a clear direction for extending the system in future iterations.
Conclusion
In this final part, the focus was on working with the stored trade data and making it usable. The backend was extended to compute summary metrics from the existing records and expose them through both an API endpoint and a simple web dashboard.
The following functionality was implemented and verified in this article:
- "GET /api/v1/analytics/summary" retrieves stored trade records, computes summary metrics, and returns them in JSON format.
- The computed metrics include total trades, total profit, win rate, average profit, and trade duration statistics.
- The endpoint was tested using existing trade records in the database, confirming that the returned values match the stored data.
- "/api/v1" renders a web dashboard using Flask templates, displaying the same metrics in a browser-friendly format.
- The dashboard was verified to reflect the same values returned by the analytics endpoint.
The results can be reproduced by ensuring that a few trades are stored in the database, accessing "GET /api/v1/analytics/summary" to confirm the JSON output, and then opening "/api/v1" to verify the dashboard display.
This completes the implementation for this article. The backend now not only stores trade data but also summarizes and presents it in a usable form. Across the series, this marks the transition from raw trade capture to a complete and working trade analytics pipeline.
Attached Files
This article includes all the files required to reproduce the final implementation of the trade analytics system. The attachments contain the MetaTrader 5 bridge Expert Advisor, the Flask backend source code, the dashboard files, and the SQLite database used during testing.
The table below summarizes the attached files and their purpose.
| File Name | Description |
|---|---|
| tradeAnalyticsBridge.mq5 | The MetaTrader 5 bridge Expert Advisor responsible for detecting closed trades, extracting trade information, and transmitting the data to the Flask backend using HTTP requests. |
| app.py | The main Flask backend source file containing the API routes, validation logic, database persistence logic, analytics summary endpoint, and dashboard rendering logic developed throughout the series. |
| mt5TradeAnalyticsBackend.zip | The complete backend project directory containing the Flask application, templates, static assets, SQLite database, and all supporting files required to run the backend locally. |
The ZIP archive also contains the following important project files:
| Internal File | Description |
|---|---|
| mt5TradeAnalyticsBackend/templates/index.html | The HTML template used to render the browser-based analytics dashboard introduced in this part. |
| mt5TradeAnalyticsBackend/static/style.css | The CSS stylesheet used to provide the dashboard layout and visual styling. |
| mt5TradeAnalyticsBackend/instance/data.db | The SQLite database file containing sample trade records used during testing and dashboard rendering demonstrations in this article. |
These files provide a complete working reference for the final implementation developed throughout the series.
Warning: All rights to these materials are reserved by MetaQuotes Ltd. Copying or reprinting of these materials in whole or in part is prohibited.
This article was written by a user of the site and reflects their personal views. MetaQuotes Ltd is not responsible for the accuracy of the information presented, nor for any consequences resulting from the use of the solutions, strategies or recommendations described.

 Market Microstructure in MQL5 (Part 2): Measuring long memory in MQL5 with Hurst estimators
 Evaluating the Quality of Forex Spread Trading Based on Seasonal Factors in MetaTrader 5
 Engineering Trading Discipline into Code (Part 6): Building a Unified Discipline Framework in MQL5
 From "Best Pass" to Robust Solutions: Exploring the Optimization Surface in MetaTrader 5

- Free trading apps
- Over 8,000 signals for copying
- Economic news for exploring financial markets
You agree to website policy and terms of use