

Evaluating the Quality of Forex Spread Trading Based on Seasonal Factors in MetaTrader 5
 2 017
2 017
 9
9

Introduction
Seasonality is recurring price movements associated with climatic, economic and behavioral factors. It is most prominent in commodity markets, but is also found in Forex and the stock market. Examples of seasonal effects: Christmas rally, summer rise in coffee prices, January effect.
The article considers the creation of an indicator for assessing the seasonality quality using MQL5. It allows analyzing both the seasonality of a single symbol and the spread of two instruments. The indicator helps identify statistically significant seasonal movements, use weighting factors, and generate reports for a given month.
Seasonality and spread trading
Spread trading is the simultaneous opening of long and short positions on related instruments. Profit is generated by changes in relative prices between assets. Unlike arbitrage, spread positions carry risk, but it is lower than trading a single asset because relative prices are more stable.
Spread positions can be:
- intra-market — on different symbols of the same market (for example, currency pairs or metals).
- inter-market — on different but related commodities (for example, "wheat-corn").
- inter-exchange — for the same commodity on different exchanges (for example, wheat on the CBOT and KCBT).
Using seasonal patterns in spread trading reduces the influence of external factors and increases predictability. The SpreadMultiYearComparison indicator for MetaTrader 5 helps identify and analyze such patterns. It is useful for both spread analysis and single asset analysis.
In the indicator, the spread is calculated as the difference between the opening prices of two instruments, with configurable weighting multipliers for each symbol, depending on the relative weight of its quotes within the spread.
Below is a step-by-step algorithm that helps us apply seasonal patterns in practice. Following this process helps identify consistent market patterns, make informed trading decisions, and manage risk effectively.
A step-by-step approach to seasonal trading
-
Pattern analysis: study the indicator chart, identify periods of spread growth/decline that repeat from year to year.
-
Entry point selection: Open a position at the beginning of the month if the spread has historically risen during this period. For example, if you see that the spread tends to widen in a particular month, you might consider buying the spread (buying the first asset and selling the second) at the beginning of that month.
-
Risk management: set stop-loss and take-profit levels, and adjust position size to suit your risk profile.
The SpreadMultiYearComparison indicator is also useful for identifying seasonal patterns in the movement of a single asset. If you see that a certain asset (such as energy) tends to rise in price in December over many years, you can use this information to make a decision to buy that asset in December of the current year.
Sometimes there is no clear trend on the indicator chart. This is especially common during summer holiday periods when markets become quieter and more unpredictable. In this case, you can use the indicator data to trade from the envelope boundaries. For example, you can buy an asset at the lower boundary of the envelope and sell it at the upper boundary.
Seasonality analysis methodology
To identify seasonal patterns, 10-15 years of daily timeframe history is used. Movements on the daily timeframe are analyzed for a selected month of the year. The data is shown for the period of the previous year.
The analysis method is as follows: we select a traded symbol or spread (for example, silver or EURUSD–GBPUSD) and study the history of movements for 15 years or more. We pay special attention to the repetition of behavior in the same months (for example, June, July). If in 75% of years the price has consistently fallen in June, this is a sign of strong seasonality. If the profit remains approximately the same in different years (for example, about +5% per month), then this pattern is considered stable.
Seasonal patterns can also be applied to trading individual instruments, such as the S&P 500 or NASDAQ 100, by following identified trends. Figure 1 shows the seasonality chart for the S&P 500 index. The left column shows the years, and the table displays the profit using the following equation: the quote value on the first day of the month is subtracted from the quote value on the last day of the month.
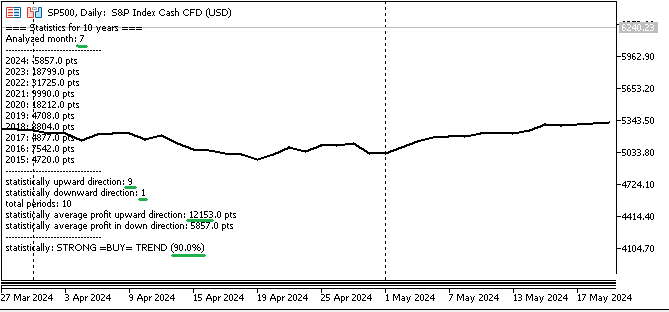
Fig. 1. Probability of July movement of the SP500 index
In the following figure, the yellow line indicates that in July of this year there will likely be an upward slope towards an increase in quotes; the olive-colored curve (above the green arrow) is the average line for all previous years of collecting statistics for this symbol. The green arrow more clearly (for clarity) displays the nature of the change in the curve for July based on average values for the entire research period:
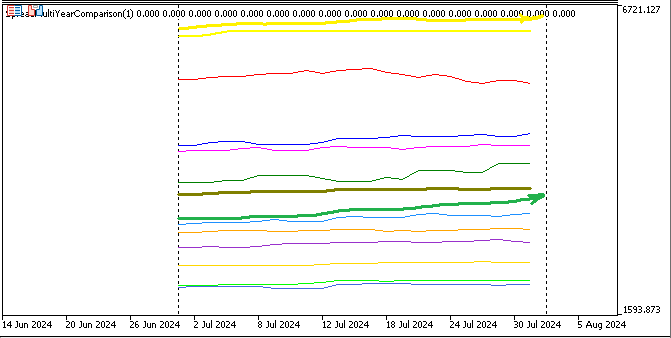
Fig. 1.1. SP 500 index movement probability
The following figures show the seasonal movement of the GBPJPY symbol for August:
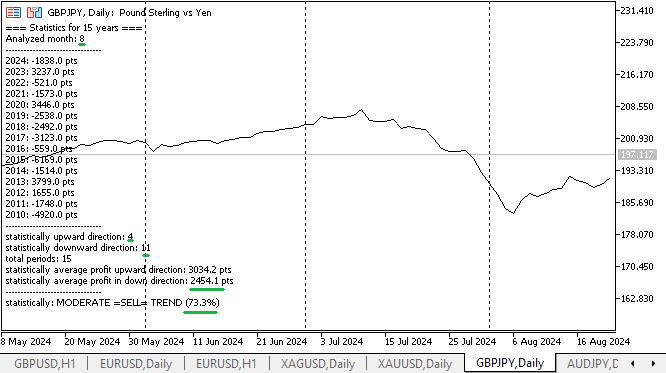
Fig. 2. Probability of changes in GBPJPY August quotes
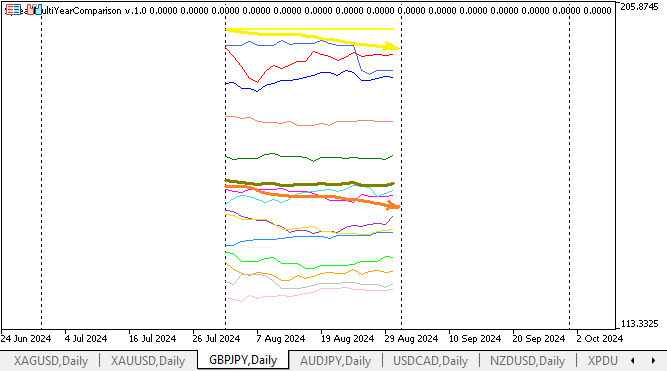
Fig. 2.1. GBPJPY index movement probability in August
The yellow curve will show the symbol's movement in August of this year. The orange arrow (accented movement) and the olive green curve show the movement of GBPJPY over the period of past years of research.
The following graph shows the seasonal pattern of the AUDNZD currency pair movement for August over 15 years of observation:
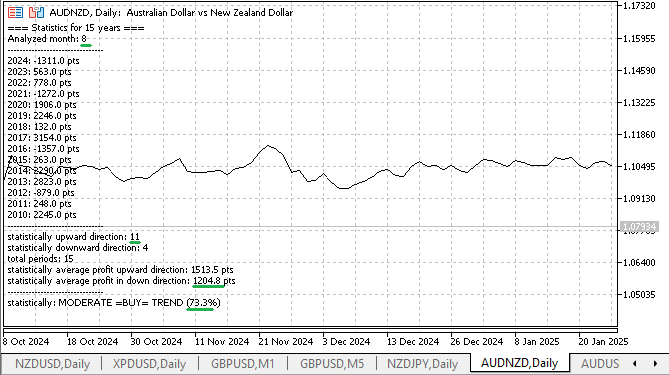
Fig. 3. Probability of changes in the August quotes for AUDNZD
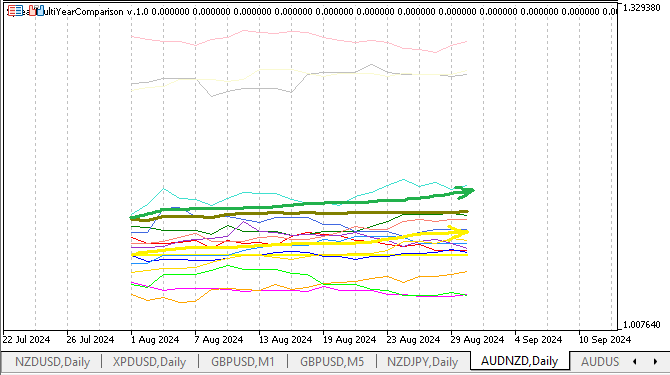
Fig. 3.1. AUDNZD currency pair movement probability in August
The following graph shows the seasonal pattern of the AUDUSD currency pair movement for August over 15 years of observation:
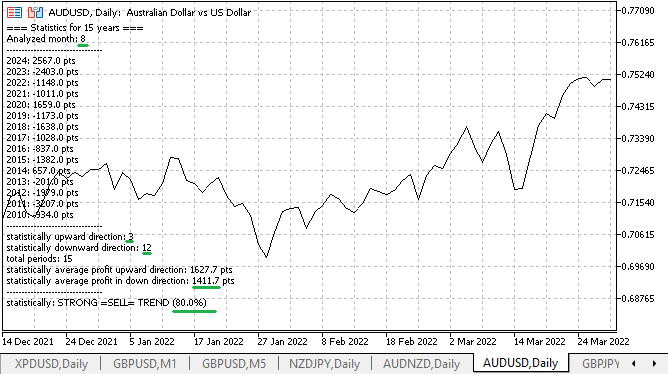
Fig. 4. Probability of changes in the August quotes for AUDUSD
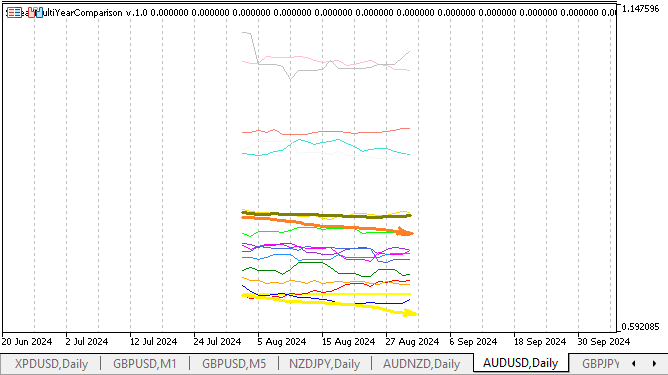
Fig. 4.1. Changes in August quotes for AUDUSD
The following two graphs show the seasonal pattern of GBPUSD movement for the month of April over the 15-year observation period:
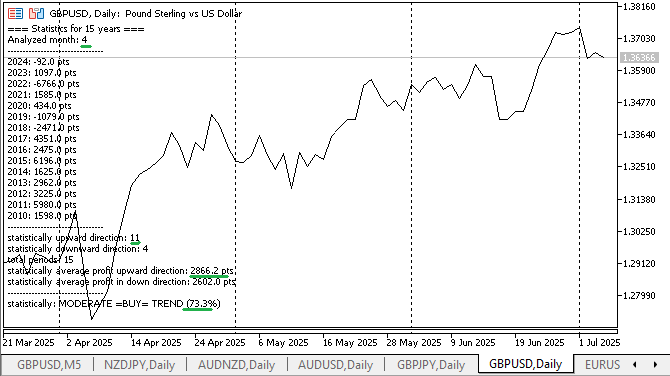
Fig. 5. Probability of changes in April GBPUSD quotes
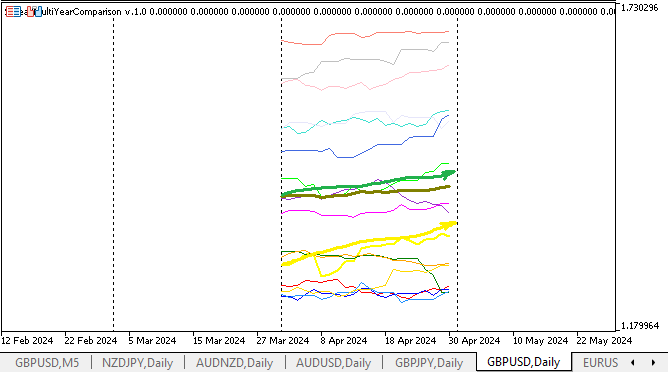
Fig. 5.1. Changes in April GBPUSD quotes
The following two graphs show the seasonal pattern of the NZDUSD currency pair movement for August over the 15-year observation period:
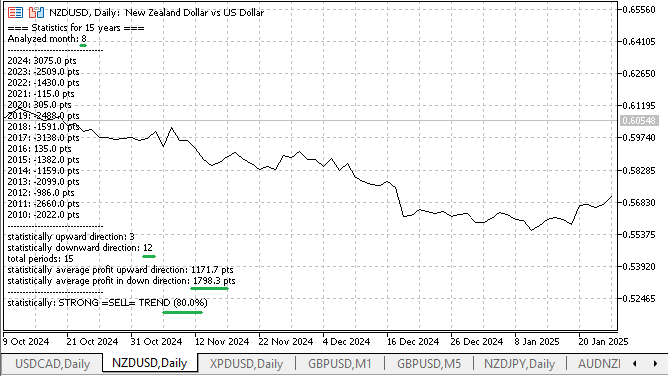
Fig. 6. Probability of changes in NZDUSD August quotes
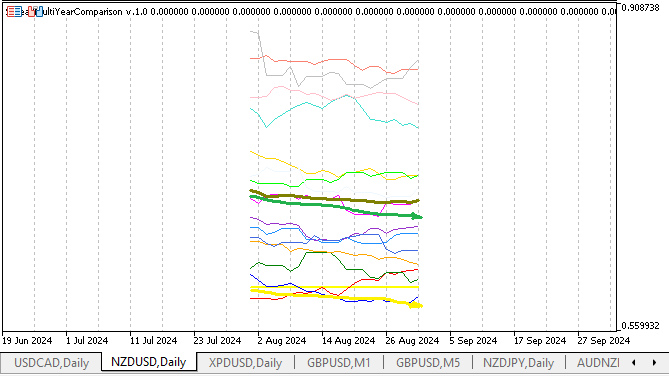
Fig. 6.1. Changes in NZDUSD quotes
The following two graphs show the seasonal pattern of the WTI crude oil price movement for the month of November over the 10-year period of observation:
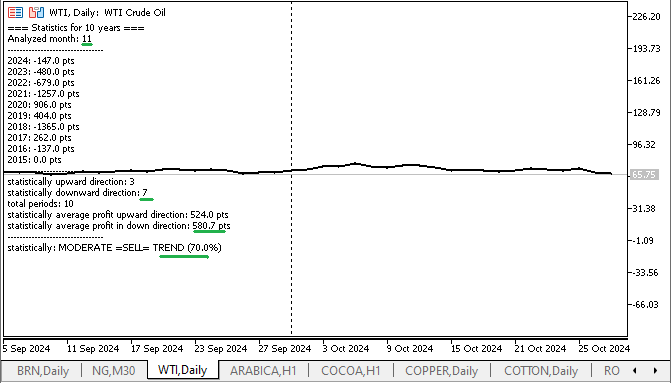
Fig. 7. Probability of changes in WTI crude oil symbol November quotes
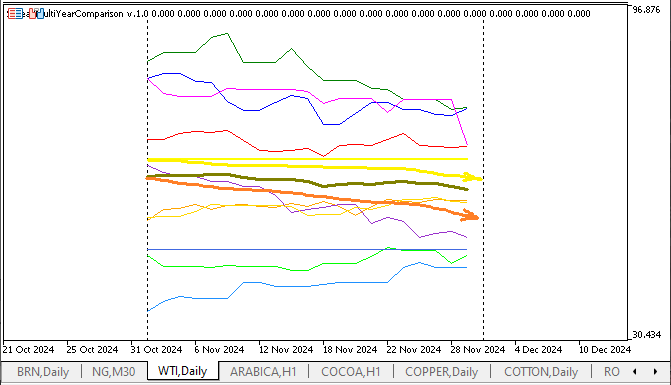
Fig. 7.1. WTI crude oil symbol November quotes
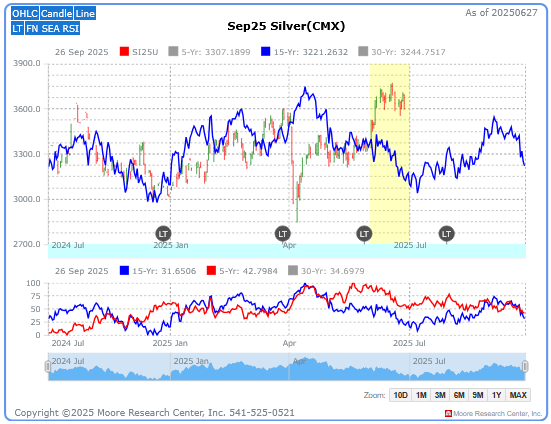
The following two graphs show the seasonal pattern of XAGUSD movement for June over the 15-year observation period. The thick olive-colored curve (above the red arrow) represents the average silver price movement over this period.
In Figure 8.1, the yellow arrow and yellow curve show the price movement for current year's June. As we can see, the seasonal movement of the symbol is not always observed.
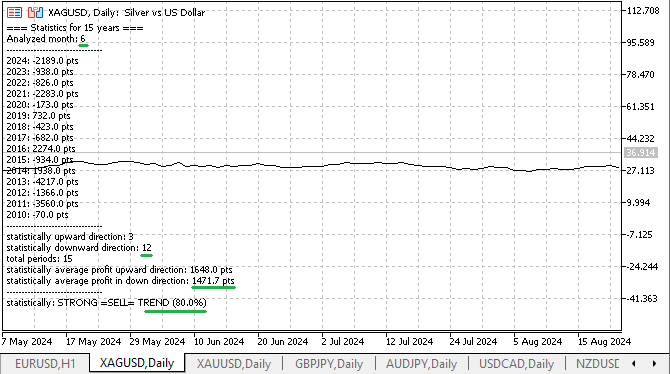
Fig. 8. Probability of changes in XAGUSD silver June quotes
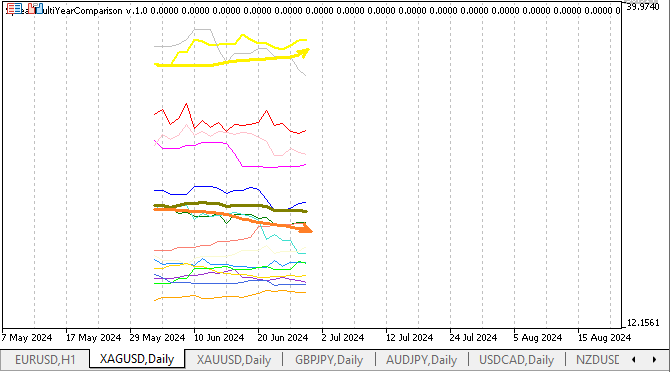
Fig. 8.1. Changes in XAGUSD June quotes
Figure 8.1.1 shows the continuation of the change in Sep25 Silver futures contract quotes for the statistically justified probability for current year's June as a yellow area:
8.1.1. SEP25 SILVER
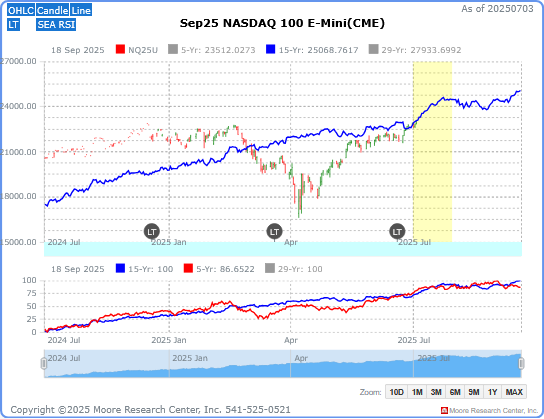
The current chart for the Sep 25 NASDAQ 100 E-Mini (CME) futures contract is shown in Figure 8.1.2 with a forecast upward movement for July.
We will continue monitoring it and generating reports in MetaTrader 5.
8.1.2. Sep25 NASDAQ 100 E-Mini futures contract
This data is presented by Moore Research Center based on the movement of futures contracts by seasonality for the current month of the year.
Seasonal spread trading: Description and graphical representation
The following two graphs show the seasonal pattern of the XAGUSD silver spread movement and gold XAUUSD for January for 15 years of observations (the indicator is launched on silver):
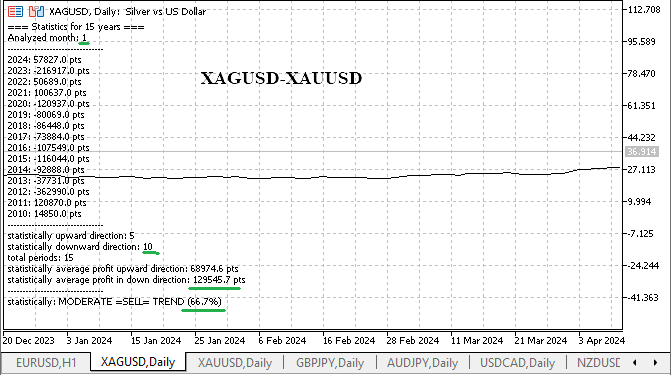
Fig. 9. Probability of January movement in the silver-gold spread (XAGUSD-XAUUSD) for 15 years of observations
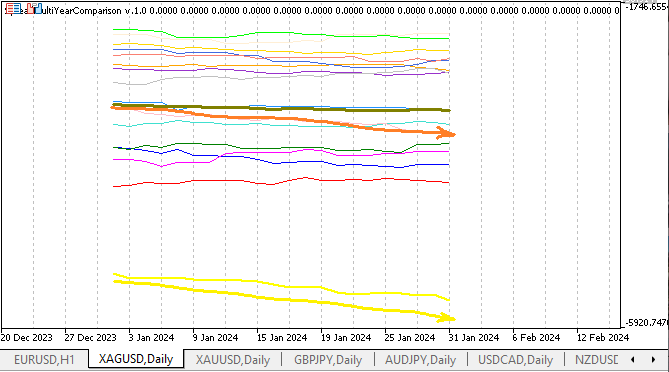
Fig. 9.1. Changes in January quotes for the XAGUSD-XAUUSD spread
In the above figures 9 and 9.1 (I have not specifically selected the periods and months), we see that the development and movement of the spread of these metals, as well as the average curve in olive color, and the orange arrow, and the curve of the current year's spread movement in yellow are moving in the direction of lowering the spread prices. This suggests that the spread has shown a statistically supported medium-term seasonal pattern over the 15-year observation period. We can set the coefficients in the indicator: silver: "1" to gold: "2".
The following two graphs show the seasonal nature of the EURUSD - GBPUSD currency pairs movement for the month of December over 15 years of observations (we place the indicator on the first symbol of the spread—EURUSD):
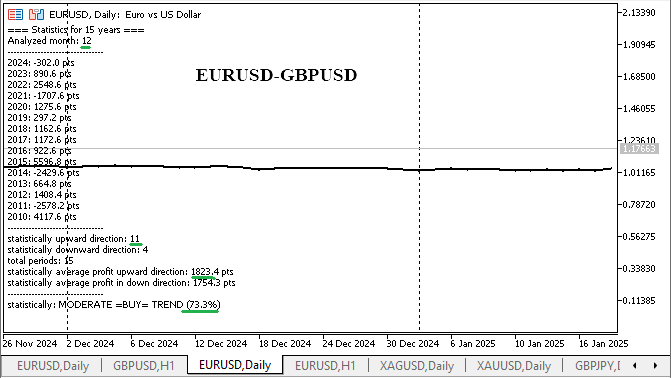
Fig. 10. Probability of December EURUSD-GBPUSD spread movement
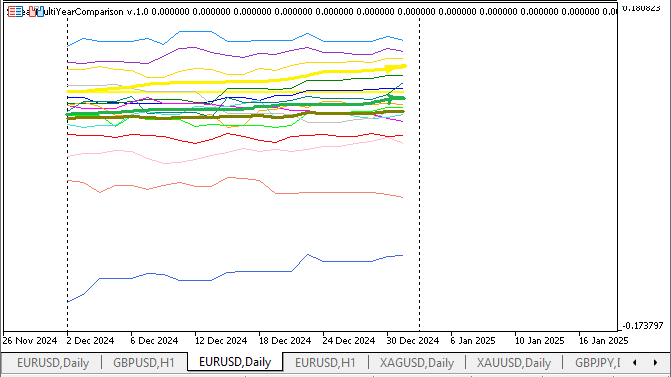
Fig. 10.1. Changes in the December movement of EURUSD-GBPUSD
The olive upward curve shows the average spread movement for the selected month over the observation period, with a green arrow highlighting this movement. The yellow arrow and the future rising yellow curve represent the expected spread movement in December of the current year.
The following two graphs show the seasonal pattern of the GBPUSD-NZDUSD spread movement for April over the 15-year period of observation:
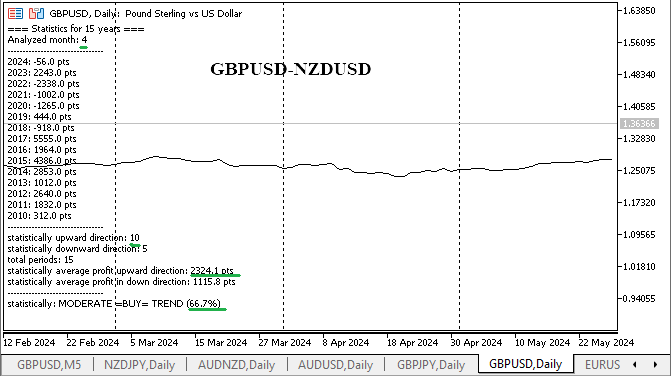
Fig. 11. Probability of GBPUSD-NZDUSD spread movement in April
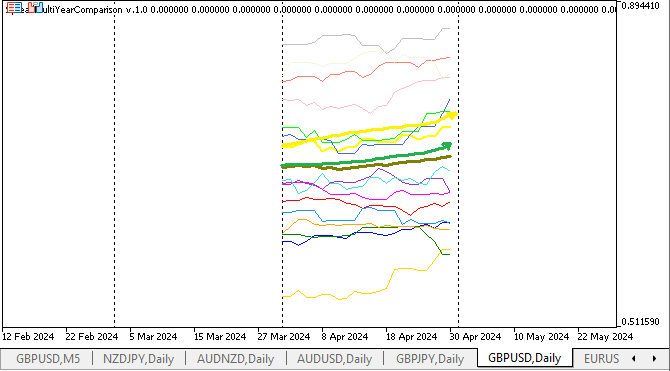
Fig. 11.1. Changes in the April movement of the GBPUSD-NZDUSD spread
As we can see, the graphs of the average movement of the GBPUSD-NZDUSD spread based on average values (the olive-colored curve, the thick line) and the graphs of the spread movement in the current year (the yellow curve and the yellow arrow) match (I have not specifically selected the months of spread price movements that matched the current year's spread movement). Namely, the graphs move from bottom to top in the direction of increasing spread.
The following two graphs show the seasonal pattern of the GBPUSD - XAGUSD spread movement for June over the 15-year period of observation:
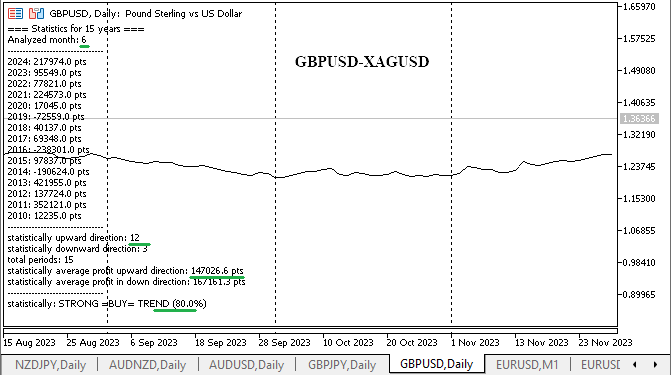
Fig. 12. Probability of GBPUSD-XAGUSD spread movement in June
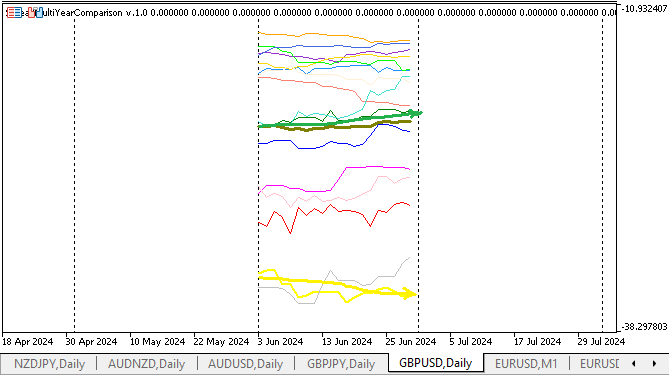
Fig. 12.1. Changes in the June movement of the GBPUSD-XAGUSD spread
As we can see, the seasonal movement of this GBPUSD-XAGUSD spread is not confirmed for the current year's June. The green arrow indicates the direction of the spread movement for these symbols based on the average value over 15 years of observations, and the curve itself is olive.
The following two graphs show the seasonal pattern of the WTI-BRN oil spread movement for the month of July over 15 years of observation:
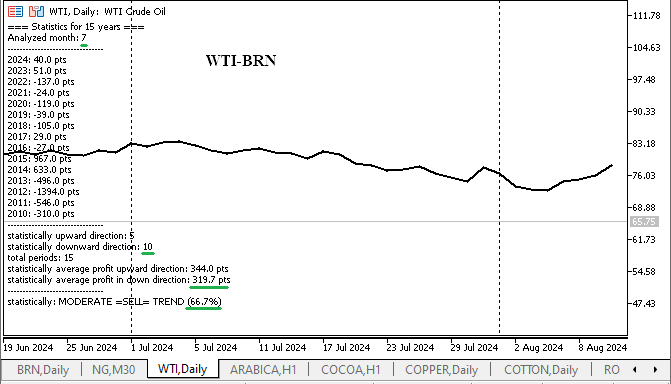
Fig. 13. Probability of July WTI-BRN spread movement
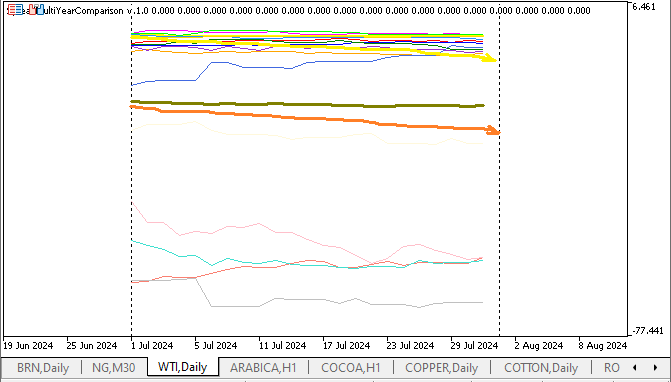
Fig. 13.1. Changes in July WTI-BRN movement
A seasonal decline in the price of the WTI-BRN oil spread is also expected here during this year's July. The yellow line shows us the current year's curve change. The orange arrow shows the downward direction, according to the average value over the spread movement observation period. The chart tells us that historically in July, WTI crude oil falls more than BRENT crude oil, therefore, the WTI-BRENT spread can be sold.
Please note the symbol tickers for your broker, since they may differ. Also, we place the indicator on the chart of the first symbol of the WTI spread. Coefficients 1:1.
The assessment of trade quality based on seasonality is carried out using the data of the attached indicator as follows:
- The main thing is that the sample should be valid for at least 10 years, or even 15-20 (there were quotes for spread symbols for the period of non-observation and construction of statistical dependencies). A similar approach can also be used to analyze historical data, after downloading the history of symbol movements from relevant resources, such as CME data from the American Exchange website;
- There were no data with different large scatters of values by year, that is, the order of numbers by value was corresponding and approximately even, like 100...150..90...166...200...150...130...125 etc.
In some years, the analysis samples do not contain months with abnormally high or low values (so-called outliers). This increases the reliability of statistics.
If the quotes for the symbols for a selected month over several years demonstrate movement in the same direction (up or down) with a probability of 70%, and the spread values are in the same order, this indicates the high reliability of the seasonal model and its suitability for use in the current year.
In this article, spreads are calculated as the difference in quotes: the quotes of the second symbol are subtracted from those of the first symbol. In this case, it is possible to use weighting coefficients that take into account the difference in the cost of ticks. For example, if the first symbol is EURUSD with the coefficient of 1, and the second is GBPUSD with the coefficient of 0.8, this reflects the higher tick value of the second asset.
A slight skew in the weights is also acceptable, especially for pairs such as gold and silver, where 1:1 ratio can be used. This approach helps to identify and exploit positive seasonality in spread movements.
Markets are not chaotic. Many assets exhibit recurring seasonal fluctuations due to economic cycles, climate, holidays, and other factors. If an asset consistently rises or falls during a certain time of year, this information can be used to make more informed trading decisions.
The SpreadMultiYearComparison indicator allows visualizing seasonal spread fluctuations based on historical data. It analyzes the difference between the prices of two assets (for example, EURUSD and GBPUSD) over several years and displays it graphically, which helps identify repeating patterns and determine optimal entry points into the market.
Applying the SpreadMultiYearComparison indicator
Parameters: Symbol1, Symbol2, MonthToShow, YearsToShow.
The table below shows the names and values of the indicator external variables:
| EXTERNAL VARIABLES | DESCRIPTION |
|---|---|
| Symbol1 | Main instrument (for example, XAUUSD) |
| Symbol2 | Second instrument (if empty, only Symbol1 is analyzed) |
| MonthToShow | Month for analysis (1–12) |
| YearsToShow | Number of years for statistics (1–15) |
| FillGaps | Whether to fill gaps in data (if 'true', it replaces missing values with the last known ones) |
Key features:
- CalculateAllStatistics() — calculates the difference between the beginning and end of the month, takes into account the number of decimal places for correct calculation of points
- DisplayFullStatistics() — shows a table with profits/losses by year and forms a recommendation ("Strong trend" / "Flat")
- GetRecommendation() — analyzes the percentage of profitable periods and provides a report on the direction of movement of spread symbols
Practical recommendations for setting values for seasonality studies in the indicator
External variables are commented out in the code and are intuitive, the indicator is displayed in an additional window:
//+------------------------------------------------------------------+
//|                  SpreadMultiYearComparison.mq5
//|                     Copyright 2025, Roman Shiredchenko
//+------------------------------------------------------------------+
#property copyright "Copyright 2025"
#property version   "7.1"
#property strict
#property indicator_separate_window
#property indicator_buffers 18
#property indicator_plots   17

//--- Input parameters
input string   Symbol1      = "EURUSD";  // First symbol (required)
input string   Symbol2      = "";        // Second symbol (empty for single symbol analysis)
input double   k_Symbol1    = 1.0;       // Weight coefficient for Symbol1
input double   k_Symbol2    = 1.0;       // Weight coefficient for Symbol2
input int      MonthToShow  = 6;         // Month to analyze (1-12)
input int      YearsToShow  = 15;        // Number of years to analyze (1-15)
input bool     FillGaps     = true;      // Fill gaps in data
The main function of the spread calculation indicator in points for the first symbol for the daily timeframe:
//+------------------------------------------------------------------+
//| Get spread/price value                                           |
//+------------------------------------------------------------------+
double GetSpreadValue(datetime dt)
{
   //--- Get data for first symbol
   int shift1 = iBarShift(Symbol1, PERIOD_D1, dt, false);
   if(shift1 < 0) {
      Print("No data for ", Symbol1, " at ", TimeToString(dt));
      return EMPTY_VALUE;
   }
   double price1 = k_Symbol1 * iOpen(Symbol1, PERIOD_D1, shift1);

   //--- Return first symbol price if second symbol not specified
   if(Symbol2 == "") {
      return price1;
   }

   //--- Get data for second symbol
   int shift2 = iBarShift(Symbol2, PERIOD_D1, dt, false);
   if(shift2 < 0) {
      Print("No data for ", Symbol2, " at ", TimeToString(dt));
      return EMPTY_VALUE;
   }
   double price2 = k_Symbol2 * iOpen(Symbol2, PERIOD_D1, shift2);

   //--- Return price difference (spread)
   return price1 - price2;
}
Practical recommendations for MetaTrader 5
Which instruments to trade based on seasonality. The table shows the month, the symbol traded (spread) and the trading direction:
| Month | Symbol | Direction |
|---|---|---|
| June | SILVER | down |
| July | WTI-BRN spread | down |
| June | GBPUSD-XAGUSD spread | down |
Tips:
- Check the history (at least 10-15 years).
- Use stop loss (seasonality does not guarantee 100% success).
- Combine with other factors (weather, COT reports).
Trading seasonality on the daily timeframe: general principles
1. Setting up the analysis tool
To understand how assets behave at different times of the year, open a chart of one of them and run the SpreadMultiYearComparison indicator. Enter the tickers of the two assets you want to compare and select the number of years of data you want to analyze.
2. Select assets
Look for asset pairs that are related, such as currency pairs, commodities, indices, or stocks. In spread trading, we do not just buy or sell one asset — we open two trades simultaneously: one to buy and one to sell. This helps reduce risk: if one asset moves against the position, the other can partially or fully compensate for the loss. This approach is often referred to as "hedging".
How to look for seasonal opportunities:
1. Looking for repeating months
Look at how the spread has behaved over the last 10-15 years. Find months, in which the price has risen or fallen steadily.
2. Assessing reliability
It is important that there are no large "jumps" in the data and that the quotes are for all the required years. The more "smooth" the statistics, the more reliable the pattern.
3. Determining when to enter and exit
We work on the daily timeframe. The strategy can be enhanced with other indicators to confirm entry/exit.
4. Managing risks
Set a stop loss taking into account volatility. The position size is moderate so as not to overload the deposit.
- Fundamental factors: reports, news, weather.
- Speculations of major players and market sentiment.
- Legislative changes: for example, new restrictions or taxes.
Make sure that:
- quotes for symbols are available for all required years (preferably 15, minimum 10);
- the chart is open on a daily scale;
- both symbols are displayed in the Market Watch;
- after attaching the indicator, right-click → Refresh to load all the data.
How to use the SpreadMultiYearComparison indicator
The presented indicator visualizes the average movement of the spread of symbols on the daily timeframe of the previous year (the curve is olive-colored) and the current year (in yellow) on the chart of the first symbol of the spread.
The results are classified as: strong trend, moderate trend, flat.
Step 1. Launching the indicator
- Specify Symbol1 (for example, XAUUSD)
- If you need a spread, specify Symbol2 (for example, XAGUSD)
- Select MonthToShow (for example, 12 for December)
- Set YearsToShow (for example, 15 years)
- If >=75% of profitable periods → strong trend
- If 60–75% → moderate trend (additional filters needed)
- If <60% → flat (there is no clear trend, quotes of spread symbols are in the range, additional filter is needed, for example Envelopes
- Strong trend (75%+):
- entry in the direction of the trend
- stop loss is the average loss over the past years
- take profit is double the average profit
- trailing stop by equity after reaching average profit
- Flat (<60%) no directional movement:
- trading from the boundaries of the Envelopes indicator
- example: sell at the upper limit, buy at the lower limit
Conclusion
Advantages of the SpreadMultiYearComparison approach:
- Risk reduction: spread trading essentially allows us to reduce risks by opening positions on two assets simultaneously.
- Increased profit probability: Seasonality analysis helps identify times when the market is more likely to move in a particular direction.
- Better trading decisions: The SpreadMultiYearComparison indicator provides visual information to help you make better and more informed trading decisions.
- Flexibility: The approach can be adapted to different assets and trading styles.
- Hedging risks: If one trading symbol goes against the position, the other can offset the loss. For example, we buy XAUUSD, sell XAGUSD - if gold falls, silver may rise. The spread, since the symbol quotes are traded against each other, is usually less volatile than individual symbols, allowing for more stringent risk management.
- All signals can be additionally filtered using custom filters, for example, technical annotations. It is also possible to use the Envelopes indicator considering and trading rebounds from the channel boundaries in the direction of seasonality.
- We can use seasonal trading with technical analysis and work on trading signals in the short term in the direction of seasonality.
Thus, any forecast obtained by averaging historical values should be checked for the probability of its fulfillment. As a rule, only those signals are considered tradable that have a probability of a positive outcome exceeding 70%.
At first glance, it seems that there will be very few such trades, since the seasonal analysis is considered here exclusively for the daily timeframe (D1). Some potential entries are eliminated in this case, but this drawback is compensated by diversification and consideration of a variety of spreads and selected symbols for trading based on seasonality in the month of interest. In particular, for example, seasonality can be seen in the symbols of the "agricultural" group.
Seasonality is not fortune telling, but the analysis of patterns. The SpreadMultiYearComparison indicator is a tool for identifying and evaluating statistically significant seasonal movements. Use seasonal analysis as a "statistical compass" to make more accurate decisions and reduce risks.
In the next article, I propose delving deeper into the Seasonality Index on lower timeframes. We will consider its more complex variations and practical application examples. We will also discuss how to combine seasonal analysis with fundamental and technical analysis to improve trading efficiency.
Translated from Russian by MetaQuotes Ltd.
Original article: https://www.mql5.com/ru/articles/15622
Warning: All rights to these materials are reserved by MetaQuotes Ltd. Copying or reprinting of these materials in whole or in part is prohibited.
This article was written by a user of the site and reflects their personal views. MetaQuotes Ltd is not responsible for the accuracy of the information presented, nor for any consequences resulting from the use of the solutions, strategies or recommendations described.

 Building a Trade Analytics System (Part 4): Summary Metrics and Dashboard
 From "Best Pass" to Robust Solutions: Exploring the Optimization Surface in MetaTrader 5
 Market Microstructure in MQL5 (Part 2): Measuring long memory in MQL5 with Hurst estimators
 MetaTrader 5: Build a Market to Suit Your Strategy — Renko/Range/Volume, Synthetics, and Stress Tests on Custom Symbols

- Free trading apps
- Over 8,000 signals for copying
- Economic news for exploring financial markets
You agree to website policy and terms of use
next interim summarisation will be held in August - we can do it in a more extended format....
NAS100 profit July 900 pips!
and it is better to exit early on the last day of the month on the downward movement against seasonality - the profit from 1000 pips will make up.
I suggest the next months and entry and exit discussion here!
Welcome to the world of seasonal trading!
on the first ticker picture in the article! SP500 July, there is a profit!
AUDNZD for August seasonality has worked out well!