
From Basic to Intermediate: Indicator (II)

In the previous article "From Basic to Intermediate: Indicator (I)", we began a practical discussion on how to create a very simple and lightweight indicator using minimal knowledge. While many might think that achieving results requires extensive coding knowledge, it turns out that even a beginner, with some effort, can create something relatively simple and functional. Moreover, in a rather elegant way, since most of the work is handled by MetaTrader 5. It is up to us to respond correctly to events. Then MetaTrader 5 will know what to do with the remaining information we process during these events.
You might think, «But that code we managed to create doesn't resemble any indicator I've ever seen before. And although we succeed in plotting something on the chart, it's not quite what I expected—I hoped I could do much more».
Alright, my dear reader, you might think all of this doesn't look very impressive, but you must remember that knowledge isn't acquired overnight: it needs to be cultivated. The goal of this series of articles is precisely that: to cultivate and spread knowledge. It's not about following the principle, "Do this because it will only work this way." So, let's see how far we've come in the previous article.
How to implement a moving average with period X
In the previous article, we looked at how to plot information on a chart. We did this in a simple, easy-to-understand manner. However, the article's goal was to show that there is a better way to use the resources available in MetaTrader 5, so we didn’t delve too deeply into specific criteria or possibilities.
Nevertheless, what was shown in the previous article can be done in other ways. But I think many would like to see how a more common moving average system could be implemented. In other words, it would be interesting to be able to create moving averages similar to, say, the famous nine-period exponential moving average, known precisely because it is a very profitable trading model, even though it is difficult to follow despite its extreme simplicity.
So, you might be thinking about how to turn the boring code implemented in the previous article into something more interesting. Achieving this might be much more challenging. Now, I think you’ll have to create something with many more lines of code, not like what was shown in the previous article.
Well, challenge accepted: today we will create a moving average indicator with a minimal amount of code — the less code, the better. But if for many this is a challenge, I find it boring and monotonous. Before we see how to do this, let’s review the code from the previous article:
01. //+------------------------------------------------------------------+
02. #property copyright "Daniel Jose"
03. //+------------------------------------------------------------------+
04. #property indicator_type1           DRAW_LINE
05. #property indicator_color1          clrBlack
06. //+----------------+
07. #property indicator_buffers         1
08. #property indicator_plots           1
09. //+----------------+
10. double   gl_buffer[];
11. //+------------------------------------------------------------------+
12. int OnInit()
13. {
14.    SetIndexBuffer(0, gl_buffer, INDICATOR_DATA);
15.
16.    return INIT_SUCCEEDED;
17. };
18. //+------------------------------------------------------------------+
19. int OnCalculate(const int rates_total, const int prev_calculated, const int begin, const double &price[])
20. {
21.    for (int c = prev_calculated; c < rates_total; c++)
22.       gl_buffer[c] = price[c];
23.
24.    return rates_total;
25. };
26. //+------------------------------------------------------------------+
Code 01
I think you have already practiced with code 01, as it is very simple and interesting, and allows us to understand things that would otherwise be difficult to grasp. Now, down to business: how can we make this code calculate and plot a moving average? To achieve this, we must first make some decisions. They are not mandatory but are useful for practicing how to think about the code we want to implement.
The first decision we need to make is the type of calculation we want to use. Yes, there are differences between moving average calculations. There are weighted and unweighted moving averages. This weighting can be based on volume, price, or time. Understanding this and knowing how to choose is very important. In the case of an exponential moving average, it is weighted by time or by the number of periods it contains. Is VWAP a price value weighted by volume, or the other way around? Who knows the answer? In any case, time will not be taken into account. In the case of an arithmetic moving average, we do not have such weighting, and the value is calculated considering only the data itself, not its change relative to other data. For simplicity, we call these averages "exponential moving average" and "simple moving average."
It is the relationship between one piece of information and another that determines the weighting factors. However, we will not delve into boring mathematical details, as it is unnecessary in this case. But we need to know at least the formula for the type of calculation we are going to implement. How else could we implement something without understanding how it is calculated? Since the arithmetic moving average is very simple to calculate (we only need to add and subtract values over a certain number of periods), we will consider a slightly more complex case: the exponential average, which many consider to be such.
The formula we will adopt is below:
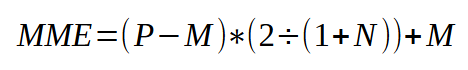
Figure 01
Image 01 shows the expression for calculating an exponential average with any number of periods. In this formula, P represents the current price value. The value M is the previous exponential average value. N is the number of periods used for averaging. With this information, we can proceed to the implementation stage of the calculation. First, I'll clarify a small detail I mentioned recently: the arithmetic mean is calculated by summing X values and dividing the result by the X used.
But when we move to calculating X + 1, i.e., the next period, all we need to do is subtract the first entry’s value from the sum and add the new entry’s value. We then divide the result by X. That's why I said the arithmetic mean is boring, as we only need to add and subtract. However, exponential averaging is thought to require a huge amount of computation. Yet, you'll notice it's almost the same as the arithmetic mean.
Now, let's look at what this expression in image 01 means: to calculate the current EMA (Exponential Moving Average), we need the previous average value. Hmm... it seems we have a problem, because when we start the calculation, we don't have that value yet. That's why we need a small mathematical workaround. The solution is simply to set M to zero. Now we can perform the calculation. To do this, it's enough to look at code 01 and find where it needs to be changed. In this case, only line 22 needs to be modified. But to avoid misunderstandings and to show you that there's no need to complicate the code, I'll present the full code:
01. //+------------------------------------------------------------------+
02. #property copyright "Daniel Jose"
03. //+------------------------------------------------------------------+
04. #property indicator_type1           DRAW_LINE
05. #property indicator_color1          clrBlack
06. //+----------------+
07. #property indicator_buffers         1
08. #property indicator_plots           1
09. //+----------------+
10. double   gl_buffer[];
11. //+------------------------------------------------------------------+
12. int OnInit()
13. {
14.    SetIndexBuffer(0, gl_buffer, INDICATOR_DATA);
15.
16.    return INIT_SUCCEEDED;
17. };
18. //+------------------------------------------------------------------+
19. int OnCalculate(const int rates_total, const int prev_calculated, const int begin, const double &price[])
20. {
21.    for (int c = prev_calculated; c < rates_total; c++)
22.       gl_buffer[c] = (price[c] - (c ? gl_buffer[c - 1] : 0)) * (2. / (1.0 + 9)) + (c ? gl_buffer[c - 1] : 0);
23.
24.    return rates_total;
25. };
26. //+------------------------------------------------------------------+
Code 02
Please note that the only thing we changed in the code is line 22. NOTHING ELSE WAS MODIFIED. However, when executing the code, we see the following:
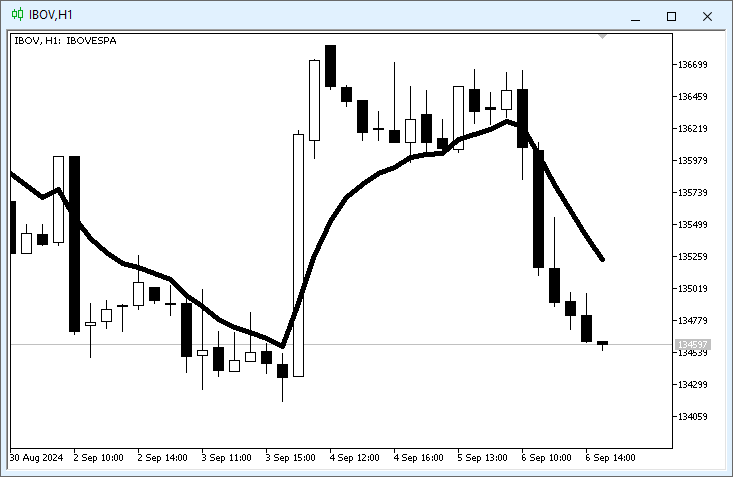
Figure 02
You're probably wondering: «But are we really seeing a nine-period exponential moving average in this image 02? It's hard to believe that so little is required to place an exponential moving average». To verify this, we will use the indicator that comes by default with MetaTrader 5, which will allow us to confirm we are doing everything correctly. It is shown in the following animation:
Animation 01
In this animation, we see the average from image 02 in the background, and in the foreground—the verification indicator. Please note the values we are using. According to these values, the indicator will be placed on the chart as shown in the animation. Everything is perfect. Indeed, code 02 calculates a nine-period exponential average. But how is this possible?
If you've studied the concepts presented in the articles, you'll understand that we are simply using the expression shown in image 01. However, as mentioned earlier, a small adjustment is necessary, as we need to set the first value in the calculation chain to zero. Therefore, at first glance, this expression might seem a bit confusing. But if desired, you can modify the code in line 22 to be more compact. Thus, the Calculate event handler will look like this:
                   .
                   .
                   .
18. //+------------------------------------------------------------------+
19. int OnCalculate(const int rates_total, const int prev_calculated, const int begin, const double &price[])
20. {
21. #define def_N     9
22.
23.    for (int c = prev_calculated; c < rates_total; c++)
24.    {
25.       double M = (c ? gl_buffer[c - 1] : 0);
26.
27.       gl_buffer[c] = (price[c] - M) * (2. / (1.0 + def_N)) + M;
28.    }
29.
30.    return rates_total;
31.
32. #undef def_N
33. };
34. //+------------------------------------------------------------------+
Fragment 01
Fragment 01 does the same thing as code 02, only with a few more lines. Excellent, but before we continue, I must warn you that there is a small issue in this code. However, I do not intend to explain what this problem is—let's pique your curiosity a bit. This way, you will surely try to figure out this issue and can form a clearer opinion about certain aspects of programming, such as the fact that we should not always do things a certain way just because a mathematical expression tells us to do so.
To fix the problem, the code needs to be changed to the one shown below:
01. //+------------------------------------------------------------------+
02. #property copyright "Daniel Jose"
03. //+------------------------------------------------------------------+
04. #property indicator_type1           DRAW_LINE
05. #property indicator_color1          clrBlack
06. //+----------------+
07. #property indicator_buffers         1
08. #property indicator_plots           1
09. //+----------------+
10. double   gl_buffer[];
11. //+------------------------------------------------------------------+
12. int OnInit()
13. {
14.    SetIndexBuffer(0, gl_buffer, INDICATOR_DATA);
15.
16.    return INIT_SUCCEEDED;
17. };
18. //+------------------------------------------------------------------+
19. int OnCalculate(const int rates_total, const int prev_calculated, const int begin, const double &price[])
20. {
21.    for (int c = (prev_calculated > 0 ? prev_calculated - 1 : 0); c < rates_total; c++)
22.       gl_buffer[c] = (c ? ((price[c] - gl_buffer[c - 1]) * 2. / (1 + 9)) + gl_buffer[c - 1] : price[c] * 2. / (1 + 9));
23.
24.    return rates_total;
25. };
26. //+------------------------------------------------------------------+
Code 03
In any case, don't worry; in the appendix, you'll find both codes so you can experiment and try to understand what the problem is, which, when looking at the code, may seem meaningless. Anyway, now I think we can talk about something else. I'm sure you might think: «Dear colleague, what if I want to use an exponential moving average with a different number of periods? Will I have to recompile the code every time I want to use a different period value? That doesn't look very promising». Indeed, the type of implementation we've seen up to this point only addresses a very specific model. However, if you don't grasp each implemented point, it will be difficult for you to understand new emerging concepts.
But given everything that has been explained, I think you're ready to move to the next level of implementation. However, to avoid mixing everything up, let's change the topic.
User interaction
It's extremely rare for someone to want to implement code like the one shown in the previous topic, precisely because we cannot change the number of calculation periods. True, there are cases, such as when calculating VWAP, where the average plotted on the chart does not depend on time. However, that would be a fairly specific case, which does not diminish its merits or the need to explain and understand what will be discussed in this topic.
Next, we will look at how we can allow the user to change some calculation parameters without needing to recompile the code. To do this, we must inform the MQL5 compiler that we want to allow the user or other applications to communicate the internal values implemented in our code. In other words, we will have a type of constant that, for the user, will be a variable. However, from our application's perspective, what we are about to create will be considered a constant. Yes, it is possible to make these changes directly through other applications, as we will see later, although, in principle, this resource is intended to provide more direct interaction with the user.
To begin, we need to adjust code 03, because in its current form it will lead to some confusion. Therefore, for didactic purposes (not for performance enhancement), we will change the code to the one shown below:
01. //+------------------------------------------------------------------+
02. #property copyright "Daniel Jose"
03. //+------------------------------------------------------------------+
04. #property indicator_type1           DRAW_LINE
05. #property indicator_color1          clrBlack
06. //+----------------+
07. #property indicator_buffers         1
08. #property indicator_plots           1
09. //+----------------+
10. double   gl_buffer[];
11. //+------------------------------------------------------------------+
12. int OnInit()
13. {
14.    SetIndexBuffer(0, gl_buffer, INDICATOR_DATA);
15.
16.    return INIT_SUCCEEDED;
17. };
18. //+------------------------------------------------------------------+
19. int OnCalculate(const int rates_total, const int prev_calculated, const int begin, const double &price[])
20. {
21.    double k = 2. / (1 + 9);
22.
23.    for (int c = (prev_calculated > 0 ? prev_calculated - 1 : 0); c < rates_total; c++)
24.       gl_buffer[c] = (c ? ((price[c] - gl_buffer[c - 1]) * k) + gl_buffer[c - 1] : price[c] * k);
25.
26.    return rates_total;
27. };
28. //+------------------------------------------------------------------+
Code 04
Please note that the changes are quite simple, as only line 21 has been added, which creates a constant for adjusting the exponential average calculation. Now, an important point: the value we need to change here is precisely that "9" we see in line 21 of code 04. To do this, simply add a new line to code 04. This way, we can specify which period we want to use for calculating the average. This change can be seen just below:
01. //+------------------------------------------------------------------+
02. #property copyright "Daniel Jose"
03. //+------------------------------------------------------------------+
04. #property indicator_type1           DRAW_LINE
05. #property indicator_color1          clrBlack
06. //+----------------+
07. #property indicator_buffers         1
08. #property indicator_plots           1
09. //+----------------+
10. input uchar user01 = 9;
11. //+----------------+
12. double   gl_buffer[];
13. //+------------------------------------------------------------------+
14. int OnInit()
15. {
16.    SetIndexBuffer(0, gl_buffer, INDICATOR_DATA);
17.
18.    return INIT_SUCCEEDED;
19. };
20. //+------------------------------------------------------------------+
21. int OnCalculate(const int rates_total, const int prev_calculated, const int begin, const double &price[])
22. {
23.    double k = 2. / (1 + user01);
24.
25.    for (int c = (prev_calculated > 0 ? prev_calculated - 1 : 0); c < rates_total; c++)
26.       gl_buffer[c] = (c ? ((price[c] - gl_buffer[c - 1]) * k) + gl_buffer[c - 1] : price[c] * k);
27.
28.    return rates_total;
29. };
30. //+------------------------------------------------------------------+
Code 05
And that's it. Now the user can specify the period of the exponential moving average to be used. However, we still need to explain one small point. When we place this indicator on the chart, we will see the following:
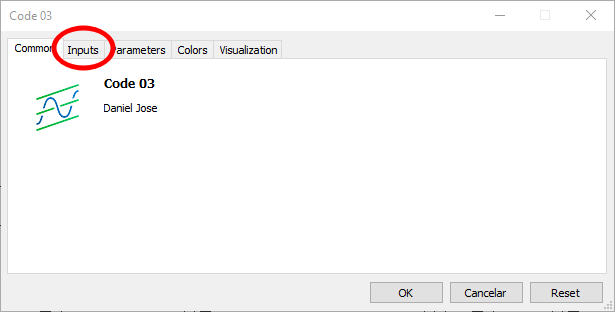
Figure 03
Please note that in this image we are highlighting a new tab. This tab did not exist before, but it was created precisely because of line 10 in code 05. That is, this is a point of interaction with the user, allowing them to configure some constants that we will use in the code. So far, everything is great. However, when selecting the new tab, we encounter the image below:
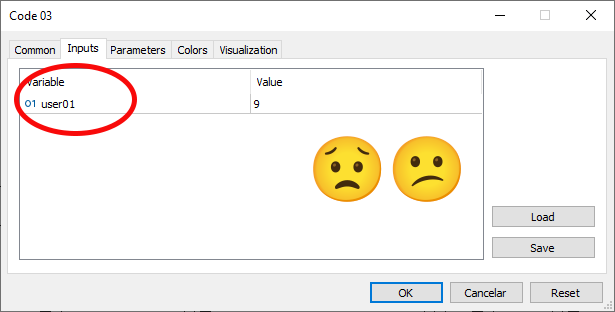
Figure 04
And here lies the problem. Pay attention to the information highlighted in Figure 04. For us, developing this application, it is perfectly clear what this value does. However, when we add more values, things become a bit confusing, and even the person who implemented the code may find it difficult to understand what each value represents. And here, we need to focus on another small detail. This piece of information will be passed to the compiler in a rather unusual way— at least, it seemed a bit strange to me at first, though I got used to it later.
As seen in image 04, the highlighted line matches the one that provides the name for the constant visible in line 10 of code 05. And yes, dear reader, in line 10 we are declaring not a variable, but a constant. In simple cases, we can give a representative name to our code and the application user. However, this is not always applicable, as in most cases, displaying a short text for the user is the most suitable. So, how do we place text in this prominent location in image 04?
This is the most unusual part. For this, we will need to add a string-type comment. Since a comment of this type must be placed after the constant declaration, we must do something like the following:
01. //+------------------------------------------------------------------+
02. #property copyright "Daniel Jose"
03. //+------------------------------------------------------------------+
04. #property indicator_type1           DRAW_LINE
05. #property indicator_color1          clrBlack
06. //+----------------+
07. #property indicator_buffers         1
08. #property indicator_plots           1
09. //+----------------+
10. input uchar user01 = 9;             //Exponential average periods
11. //+----------------+
                   .
                   .
                   .
Code 06
Take a close look at code 06, especially line 10. What was added to this line is what we call a string comment. When we do this in a constant that will be displayed on the tab in image 04, we instruct the compiler to use this text as the string to display to the user. To make this clearer and ensure you truly understand it, see what will happen if we view the same tab shown in image 04, but using what is displayed in code 06. This can be seen in the image below:
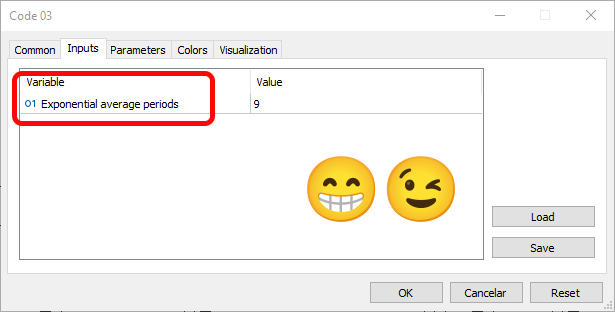
Figure 05
Thanks to image 05, anyone will know what is being configured in the application, which greatly simplifies its use.
Did you notice how easy it is to create an indicator? We need very little to make everything work and fit the elements perfectly for a specific type of interest. To make the indicator more useful and better integrate it into MetaTrader 5, as well as use it for other purposes, a few more things need to be done. But we will address these gradually, so you can understand how everything fits together with the functions of the MQL5 standard library in an indicator. As you can see, we need several functions for the indicator to work. However, the indicator is not yet truly versatile.
Alright, that was the first part. Now we'll look at how to use the second version of OnCalculate. The first version meets certain criteria, but we might need more information. Therefore, we need another version. However, to avoid mixing everything together, we will cover this in another topic.
How to use the second version of OnCalculate
In previous articles, we mentioned that the OnCalculate function is the only overloaded function in the MQL5 standard library. This is because in some cases we can use one version, and in others, another. However, the choice of version affects not only what is displayed in the user interface but also how you must approach the implementation. Without MetaTrader 5's assistance, we must be more careful when implementing. This is because, unlike the first version, the second version provides more data that can be used, and depending on how it's used, one result or another can be achieved.
Given that the second version of OnCalculate is quite complex, we will only examine how the code for the same indicator would look in this enhanced version. It is important to understand that there is a difference between using one version or the other, but the differences are created by you, the programmers. So, this same code 06, discussed in the previous topic, would look like this if using the second version of OnCalculate:
01. //+------------------------------------------------------------------+
02. #property copyright "Daniel Jose"
03. //+------------------------------------------------------------------+
04. #property indicator_type1           DRAW_LINE
05. #property indicator_color1          clrBlack
06. //+----------------+
07. #property indicator_buffers         1
08. #property indicator_plots           1
09. //+----------------+
10. input uchar user01 = 9;             //Exponential average periods
11. //+----------------+
12. double   gl_buffer[];
13. //+------------------------------------------------------------------+
14. int OnInit()
15. {
16.    SetIndexBuffer(0, gl_buffer, INDICATOR_DATA);
17.
18.    return INIT_SUCCEEDED;
19. };
20. //+------------------------------------------------------------------+
21. int OnCalculate(const int rates_total, const int prev_calculated, const datetime &Time[], const double &Open[], const double &High[], const double &Low[], const double &Close[], const long &TickVolume[], const long &Volume[], const int &Spread[])
22. {
23.    double k = 2. / (1 + user01);
24.
25.    for (int c = (prev_calculated > 0 ? prev_calculated - 1 : 0); c < rates_total; c++)
26.       gl_buffer[c] = (c ? ((Close[c] - gl_buffer[c - 1]) * k) + gl_buffer[c - 1] : Close[c] * k);
27.
28.    return rates_total;
29. };
30. //+------------------------------------------------------------------+
Code 07
Please note one point. Unlike the previous case, where we could choose which type of information would be used to calculate the average, in code 07 this is no longer possible. The reason is that we "fix" the calculation on one of the values—in this case, the bar's closing value. All other information will be ignored, as it will not be used. But that's not the only change—remember, we said the user interface would change as well? When we place the indicator presented in code 07 on the chart, we will notice the absence of one of the tabs, as seen in the image below:
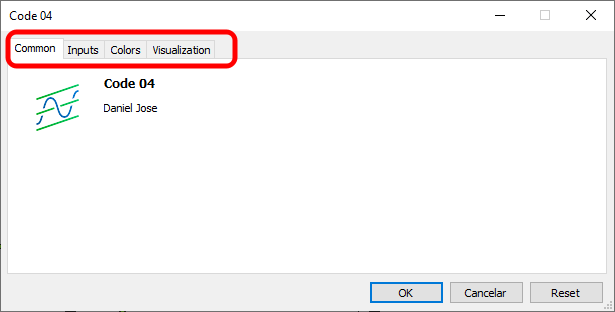
Figure 06
In image 06, we can see that one of the tabs we had before is now missing. The reason is that the indicator's calculation is fixed to a specific type of value. Therefore, the user cannot change the source as they could before. However, this does not rule out using other types of calculations—we can give the user the option to choose the type of input values to be used in the computation. To do this, it is enough to add new inputs.
This part is very interesting. Since it's quite straightforward, the remainder of the article will explain how to do it. Then, we can proceed to create various solutions in an interesting and creative way.
To give the user access to other types of input values, we can use several different methods. I prefer using enumerators. Enumerators are easy to implement and modify, which is why I like them. Essentially, we need a small sequence of steps to make everything sufficiently elegant and intuitive, both for you, who will implement it, and for the users who will use your application.
The first step is to create an enumerator. For simplicity and clarity, we'll create a very basic version. Therefore, we will modify code 07 as follows:
                   .
                   .
                   .
09. //+----------------+
10. enum Enum_TypeInput {
11.             HIGH,
12.             OPEN,
13.             CLOSE,
14.             LOW
15.                     };
16. //+----------------+
17. input uchar user01 = 9;             //Exponential average periods
18. input uchar user02 = HIGH;          //Data type for calculation
19. //+----------------+
                   .
                   .
                   .
Code 08
After executing code 07 with the modifications specified in code 08, we will see the following:
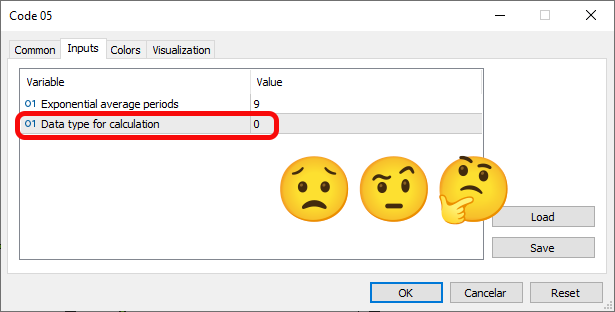
Figure 07
«Wow! But this isn't what I wanted to do. I wanted to show the user the data or types defined in the enumeration in line 10 so they could make a selection based on that enumeration type. Why didn't it work?» Well, the reason lies in the data type expected in line 18. Please note: we declared an enumeration, and that's fine; the problem is that the enumeration is converted to integer values. The compiler didn't understand what we intended to do. To fix this, we simply change the type of the expected value to a constant. We will also change the type from HIGH to CLOSE, which will be the most common in most cases. Thus, code 08 will be modified to this:
                   .
                   .
                   .
16. //+----------------+
17. input uchar             user01 = 9;             //Exponential average periods
18. input Enum_TypeInput    user02 = CLOSE;         //Data type for calculation
19. //+----------------+
                   .
                   .
                   .
Code 09
After applying this modification from code 08 to 09, we can see the following result when running the code in the terminal, just below:
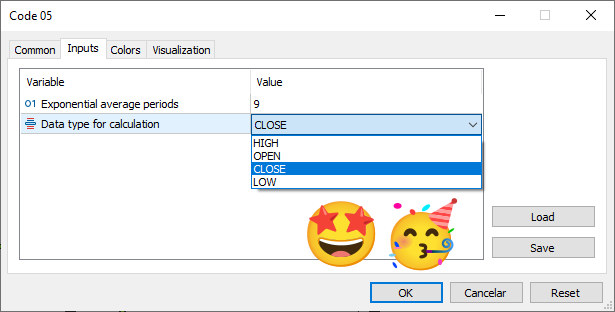
Figure 08
Look how this works. But it isn't just about that. Since the compiler understood what we wanted to do, we can also select items using the same text from the enumeration declared in line 10 of code 08. However, note this: unlike in earlier years, when we relied on MetaTrader 5's support, now we are on our own. In other words, simply configuring everything as described above isn't enough to make it work immediately. We need to modify the event handler. In this case, we proceed to the next step, which is to make our code use the user's selection. To do this, we simply change the code as follows:
01. //+------------------------------------------------------------------+
02. #property copyright "Daniel Jose"
03. //+------------------------------------------------------------------+
04. #property indicator_type1           DRAW_LINE
05. #property indicator_color1          clrBlack
06. //+----------------+
07. #property indicator_buffers         1
08. #property indicator_plots           1
09. //+----------------+
10. enum Enum_TypeInput {
11.             HIGH,
12.             OPEN,
13.             CLOSE,
14.             LOW
15.                     };
16. //+----------------+
17. input uchar             user01 = 9;             //Exponential average periods
18. input Enum_TypeInput    user02 = CLOSE;         //Data type for calculation
19. //+----------------+
20. double   gl_buffer[];
21. //+------------------------------------------------------------------+
22. int OnInit()
23. {
24.    SetIndexBuffer(0, gl_buffer, INDICATOR_DATA);
25.
26.    return INIT_SUCCEEDED;
27. };
28. //+------------------------------------------------------------------+
29. int OnCalculate(const int rates_total, const int prev_calculated, const datetime &Time[], const double &Open[], const double &High[], const double &Low[], const double &Close[], const long &TickVolume[], const long &Volume[], const int &Spread[])
30. {
31.    double   k = 2. / (1 + user01),
32.             price = 0;
33.
34.    for (int c = (prev_calculated > 0 ? prev_calculated - 1 : 0); c < rates_total; c++)
35.    {
36.         switch (user02)
37.         {
38.             case HIGH   :
39.                 price = High[c];
40.                 break;
41.             case OPEN   :
42.                 price = Open[c];
43.                 break;
44.             case CLOSE  :
45.                 price = Close[c];
46.                 break;
47.             case LOW    :
48.                 price = Low[c];
49.                 break;
50.         }
51.         gl_buffer[c] = (c ? ((price - gl_buffer[c - 1]) * k) + gl_buffer[c - 1] : price * k);
52.    }
53.
54.    return rates_total;
55. };
56. //+------------------------------------------------------------------+
Code 10
In this code, we see that in line 32 we added a new variable. Its purpose is to make it easier for us to manage all elements. In line 36, we add a switch statement to determine the value that will be placed in the price variable. This does not require many changes to the calculation code, as we only need to adjust the calculation line to use the price variable, as seen in line 51. Great, right? But before concluding this article, we can do one more thing.
Notice that in the enumeration declared in line 10, there are several values that are clear and can be used directly in the interface. However, one might prefer a different code. How, then, can we clarify the situation for future users and for ourselves? After all, this would make it easy to understand which value will be used in the calculation. To do this, we do something similar to what we do with input lines—we add a string comment. The resulting code looks like this:
01. //+------------------------------------------------------------------+
02. #property copyright "Daniel Jose"
03. //+------------------------------------------------------------------+
04. #property indicator_type1           DRAW_LINE
05. #property indicator_color1          clrBlack
06. //+----------------+
07. #property indicator_buffers         1
08. #property indicator_plots           1
09. //+----------------+
10. enum Enum_TypeInput {
11.             en_HIGH,           //Use maximum prices
12.             en_OPEN,           //Use opening prices
13.             en_CLOSE,          //Use closing prices
14.             en_LOW             //Use minimum prices
15.                     };
16. //+----------------+
17. input uchar             user01 = 9;             //Exponential average periods
18. input Enum_TypeInput    user02 = en_CLOSE;      //Data type for calculation
19. //+----------------+
20. double   gl_buffer[];
21. //+------------------------------------------------------------------+
22. int OnInit()
23. {
24.    SetIndexBuffer(0, gl_buffer, INDICATOR_DATA);
25.
26.    return INIT_SUCCEEDED;
27. };
28. //+------------------------------------------------------------------+
29. int OnCalculate(const int rates_total, const int prev_calculated, const datetime &Time[], const double &Open[], const double &High[], const double &Low[], const double &Close[], const long &TickVolume[], const long &Volume[], const int &Spread[])
30. {
31.    double   k = 2. / (1 + user01),
32.             price = 0;
33.
34.    for (int c = (prev_calculated > 0 ? prev_calculated - 1 : 0); c < rates_total; c++)
35.    {
36.         switch (user02)
37.         {
38.             case en_HIGH   :
39.                 price = High[c];
40.                 break;
41.             case en_OPEN   :
42.                 price = Open[c];
43.                 break;
44.             case en_CLOSE  :
45.                 price = Close[c];
46.                 break;
47.             case en_LOW    :
48.                 price = Low[c];
49.                 break;
50.         }
51.         gl_buffer[c] = (c ? ((price - gl_buffer[c - 1]) * k) + gl_buffer[c - 1] : price * k);
52.    }
53.
54.    return rates_total;
55. };
56. //+------------------------------------------------------------------+
Code 11
Look at the final result. This code will be included in the appendix and will give you the opportunity to learn and practice. After running it, you will see the following in the MetaTrader 5 terminal.
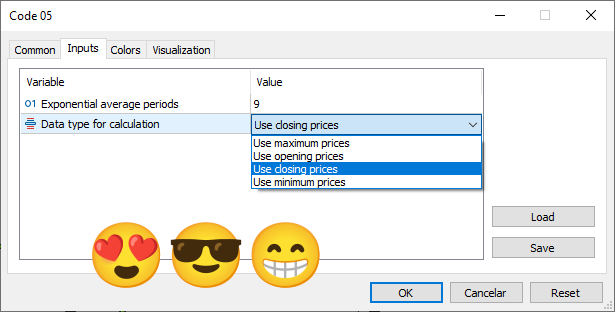
Figure 09
As mentioned above, we have simply hidden from the user all information related to the internal structure of the code. For the user, nothing changes. However, for you, this code will be a bit more complex to implement, as we have many rules and less assistance from MetaTrader 5 than before. But since each case is somewhat different, you now know how to implement a simple indicator that, nonetheless, can teach you many other things.
Concluding thoughts
In this article, we have shown how to relatively easily implement a simple indicator by following a series of steps. I did not cover things like moving the plot line, but since it is very simple (just add another constant to the code and use it in the OnCalculate event function), we will not go into how it is done. Let's leave such tasks for those who want to practice and try to understand more about indicators.
In the next article, we will look at something else, also related to indicators. So, see you later.
Translated from Portuguese by MetaQuotes Ltd.
Original article: https://www.mql5.com/pt/articles/15802
Warning: All rights to these materials are reserved by MetaQuotes Ltd. Copying or reprinting of these materials in whole or in part is prohibited.
This article was written by a user of the site and reflects their personal views. MetaQuotes Ltd is not responsible for the accuracy of the information presented, nor for any consequences resulting from the use of the solutions, strategies or recommendations described.

- Free trading apps
- Over 8,000 signals for copying
- Economic news for exploring financial markets
You agree to website policy and terms of use
Hi!
Loved the article!
I think it would be more enjoyable using more images to describe what are you doing trough each step.
Oi!
Adorei o artigo!
Acho que seria mais interessante usar mais imagens para descrever o que você está fazendo em cada etapa.