
From Basic to Intermediate: Indicator (III)

In the previous article "From Basic to Intermediate: Indicators (II)", we learned a lot, as we demonstrated how to implement a moving average in a very simple, practical, and fully functional way. However, what was shown can be considered only a brief introduction to the world of MQL5 programming, since the material is quite basic, simple, and straightforward. But we can do much more.
So, make an effort to understand the concepts presented here. Don't just copy the code, and don't think that if you can't do it, no one else can either. Understanding the concept is more important than understanding the code itself, because the code can change depending on who writes it, while the concept will always remain. We will start with something very simple, because what you will see can become very complex if we suddenly apply certain functionalities.
One Indicator and Multiple Graphical Representations
You have likely already seen someone programming or even trying to create a system or operational setup to earn money in the financial markets. It's not uncommon for many of these systems to use various moving averages, which in many cases are applied in reverse order. Additionally, there are channel systems, such as the famous Bollinger Bands, which are based on two moving averages: one representing the upper band and the other the lower band. But we are not here to explain how such a system can be used for trading in the market. Our goal is to show how something similar can be done in a simple and practical way.
In the case of Bollinger Bands, which we are using as an example (but it could be anything else), we have two lines (sometimes three), where one represents the inner average of the channel. But we'll keep it simple and work with two lines, making it easier to understand how to implement any number of lines. To begin, we will use the code below.
01. //+------------------------------------------------------------------+
02. #property copyright "Daniel Jose"
03. //+------------------------------------------------------------------+
04. #property indicator_type1           DRAW_LINE
05. #property indicator_color1          clrBlack
06. //+----------------+
07. #property indicator_buffers         1
08. #property indicator_plots           1
09. //+----------------+
10. double   gl_buffer[];
11. //+------------------------------------------------------------------+
12. int OnInit()
13. {
14.    SetIndexBuffer(0, gl_buffer, INDICATOR_DATA);
15.
16.    return INIT_SUCCEEDED;
17. };
18. //+------------------------------------------------------------------+
19. int OnCalculate(const int rates_total, const int prev_calculated, const datetime &Time[], const double &Open[], const double &High[], const double &Low[], const double &Close[], const long &TickVolume[], const long &Volume[], const int &Spread[])
20. {
21.    for (int c = (prev_calculated > 0 ? prev_calculated - 1 : 0); c < rates_total; c++)
22.        gl_buffer[c] = High[c];
23.
24.    return rates_total;
25. };
26. //+------------------------------------------------------------------+
Code 01
I don't think it's necessary to show what this code will do when run and placed on a chart, as it was explained in detail in the previous two articles. All we need to do is look at what is done in the event handler function, in this case, the OnCalculate function. You can see that here we are explicitly using the maximum value. In other words, we will have a graphical representation line that follows the high of each bar, since we are not performing any smoothing calculations. And yes, moving average calculations are precisely aimed at smoothing the curve that will be graphically displayed on the screen, creating an average among multiple values used in the calculation. But that requires explaining mathematical material, which is beyond the scope of this article.
Alright, this indicator, shown in code 01, works perfectly. Please note that we are using the extended version of the OnCalculate function. The reason for this will become clear now. Now, I have a question for you: how can we add a second graphical representation line to the chart? The goal is to display, for example, the lows of each bar. You might say it's enough to create a new indicator and change line 22 of the code to use Low instead of High. And you would be right. This idea is by no means wrong—it works.
However, this would complicate things, since you would end up with two separate indicators on the chart. One minor point: each indicator would handle only one graphical representation line. However, we can do better—combine these two indicators into a single code. Demonstrating how to do this is the goal of this topic. I know it might seem complicated at first, but if you understand what is shown, you will be able to create any indicator with multiple graphical representation lines. Remember, for now, we are looking at the simplest way to do this. Later, if you wish, we will explore a more advanced form.
So, we will modify code 01 to create a second graphical representation line. We'll do this step by step so everyone can follow along and understand how it happens.
The first thing to do is create a new buffer that will hold the new graphical representation data. Recall that the DRAW_LINE type we are using requires one buffer for each piece of graphical representation information. As a result, we will have the following:
01. //+------------------------------------------------------------------+
02. #property copyright "Daniel Jose"
03. //+------------------------------------------------------------------+
04. #property indicator_type1           DRAW_LINE
05. #property indicator_color1          clrBlack
06. //+----------------+
07. #property indicator_buffers         1
08. #property indicator_plots           1
09. //+----------------+
10. double   gl_buff_max[],
11.          gl_buff_min[];
12. //+------------------------------------------------------------------+
                   .
                   .
                   .
Code 02
Code 02 shows part of what we are about to implement, as we will do it step by step—this will be easier. Please note that we have changed the buffer name in line 10 and added a new one in line 11. This way, we are beginning to implement the second graphical representation line. We will proceed with the next step more quickly to ensure everything is done correctly. After that, we will obtain the following code:
01. //+------------------------------------------------------------------+
02. #property copyright "Daniel Jose"
03. //+------------------------------------------------------------------+
04. #property indicator_type1           DRAW_LINE
05. #property indicator_color1          clrBlack
06. //+----------------+
07. #property indicator_buffers         1
08. #property indicator_plots           1
09. //+----------------+
10. double   gl_buff_max[],
11.          gl_buff_min[];
12. //+------------------------------------------------------------------+
13. int OnInit()
14. {
15.    SetIndexBuffer(0, gl_buff_max, INDICATOR_DATA);
16.    SetIndexBuffer(1, gl_buff_min, INDICATOR_DATA);
17.
18.    return INIT_SUCCEEDED;
19. };
20. //+------------------------------------------------------------------+
21. int OnCalculate(const int rates_total, const int prev_calculated, const datetime &Time[], const double &Open[], const double &High[], const double &Low[], const double &Close[], const long &TickVolume[], const long &Volume[], const int &Spread[])
22. {
23.    for (int c = (prev_calculated > 0 ? prev_calculated - 1 : 0); c < rates_total; c++)
24.    {
25.       gl_buff_max[c] = High[c];
26.       gl_buff_min[c] = Low[c];
27.    }
28.
29.    return rates_total;
30. };
31. //+------------------------------------------------------------------+
Code 03
Alright, this is the main part. However, this code has a small issue that we still need to resolve. But first, we need to understand what this issue is and why it arises. Note that in line 16, we create a new index. Every buffer used in the indicator that MetaTrader 5 will need to maintain and monitor requires a unique index. Once line 16 is defined, the buffer can be used as shown in line 26.
This buffer, used in the graphical representation system, can serve various functions. For now, we will only use the type that is intended to contain data used for representing certain elements on the chart. Alright, Code 03 can be compiled. However, when applied to the chart, the result is as follows:
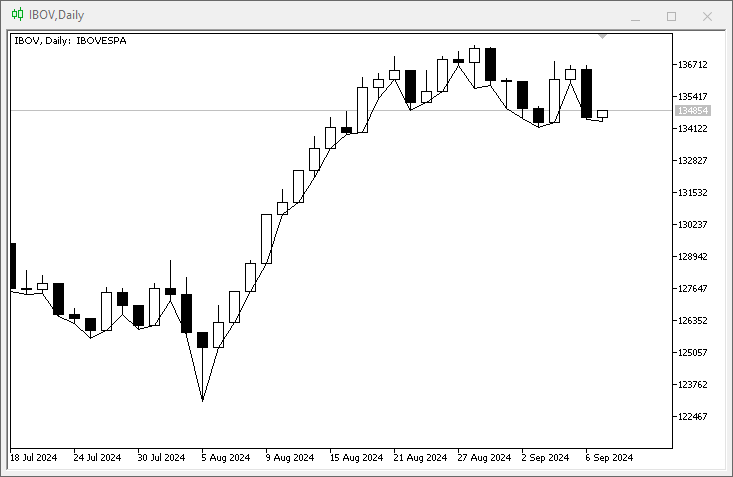
Figure 01
«But what happened here? I don't understand why we only see the graphical representation line for the minimum values?» The reason is that we are telling MetaTrader 5 that the indicator contains only one graphical representation buffer and its information. You can see this in lines 07 and 08. Since we actually have two buffers and two lines, we only need to change the information mentioned in lines 07 and 08. In this case, let's modify the code as shown below:
01. //+------------------------------------------------------------------+
02. #property copyright "Daniel Jose"
03. //+------------------------------------------------------------------+
04. #property indicator_type1           DRAW_LINE
05. #property indicator_color1          clrBlack
06. //+----------------+
07. #property indicator_buffers         2
08. #property indicator_plots           2
09. //+----------------+
10. double   gl_buff_max[],
11.          gl_buff_min[];
12. //+------------------------------------------------------------------+
                   .
                   .
                   .
Code 04
Please note that we only changed the lines mentioned above. However, when the indicator is applied to the chart, the result is as follows:
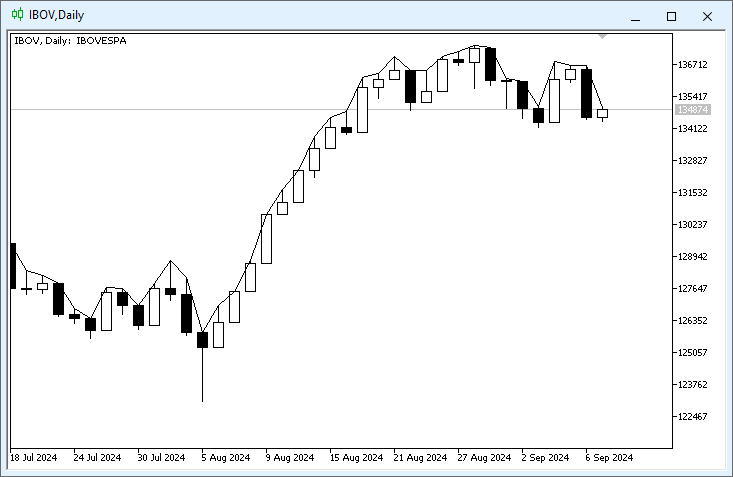
Figure 02
«Again? Now I really don't understand. Shouldn't the code have graphically displayed two lines? Why do I only see one?» Calm down, dear readers. Be patient. Don't worry. The reason you only see one line is that no color is applied to the second line. To clarify this, look at how the indicator is configured:
Animation 01
Please note that THERE IS NO COLOR FOR THE SECOND LINE. Even when trying to assign a color value to it, it does not appear. To solve this problem, you need to instruct the compiler to reserve and create the second line. To do this, you need to modify the code once again, as shown below:
01. //+------------------------------------------------------------------+
02. #property copyright "Daniel Jose"
03. //+------------------------------------------------------------------+
04. #property indicator_type1           DRAW_LINE
05. #property indicator_color1          clrRed
06. //+----------------+
07. #property indicator_type2           DRAW_LINE
08. #property indicator_color2          clrGreen
09. //+----------------+
10. #property indicator_buffers         2
11. #property indicator_plots           2
12. //+----------------+
13. double   gl_buff_max[],
14.          gl_buff_min[];
15. //+------------------------------------------------------------------+
                   .
                   .
                   .
Code 05
Let's look at what was added to the code, which you can see here in Code 05. To make it more visual, we used different colors. Thus, when you place the indicator on a chart, you can see this:
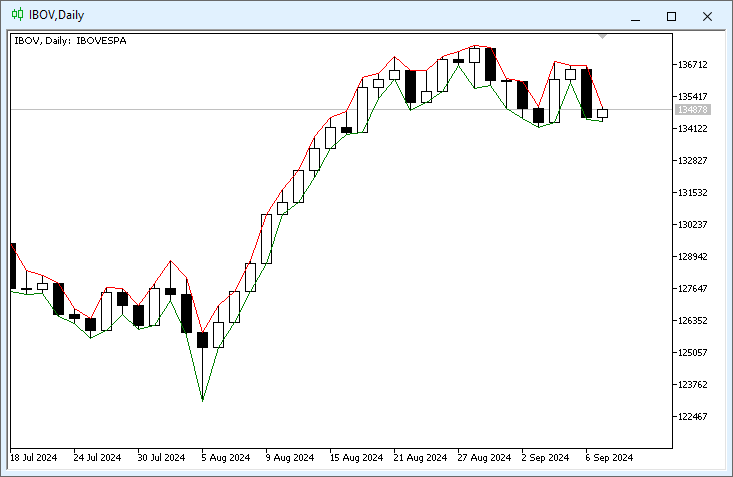
Figure 03
See how easy it is to implement different graphical representation lines in the same indicator? All you need to do is gradually add elements, knowing what you are doing. Since we are not performing any calculations here, the lines will never intersect. It would be roughly the same as if we were implementing band indicators. The difference is that one line would receive values from one band, and the other from another, creating something similar to the famous Bollinger Bands. This is a very interesting topic, isn't it?
I believe that now you will be able to create different types and styles of indicators based solely on this knowledge. But before we delve deeper into this topic—since this part of programming is very interesting—wouldn't you like to modify the indicator in image 03 so that the lines are colored? «It looks difficult». But is it really difficult, or do you still not know how to proceed? Let's see. For this, we are moving on to a new topic.
Colored lines in graphical representation
One point that captures people's attention and excites them the most is an indicator with lines that change color. Up until now, we have created a very simple system where either one color or another can be used—but what about switching colors? «It seems very complicated to implement, especially for someone like me who is just starting to learn MQL5 programming». I understand, my dear reader. But the fact that you are just starting doesn't mean you can't be interested in what will be shown here. And NO, creating an indicator whose lines are graphically represented in multiple colors is not difficult—it's just a bit different.
To give you an idea of what we're talking about, let's take the code implemented in the previous topic. To display the result of image 03, it should contain something very similar to what we see below:
//+------------------------------------------------------------------+
#property copyright "Daniel Jose"
//+------------------------------------------------------------------+
#property indicator_type1           DRAW_LINE
#property indicator_color1          clrRed
//+----------------+
#property indicator_type2           DRAW_LINE
#property indicator_color2          clrGreen
//+----------------+
#property indicator_buffers         2
#property indicator_plots           2
//+----------------+
double   gl_buff_max[],
         gl_buff_min[];
//+------------------------------------------------------------------+
int OnInit()
{
   SetIndexBuffer(0, gl_buff_max, INDICATOR_DATA);
   SetIndexBuffer(1, gl_buff_min, INDICATOR_DATA);

   return INIT_SUCCEEDED;
};
//+------------------------------------------------------------------+
int OnCalculate(const int rates_total, const int prev_calculated, const datetime &Time[], const double &Open[], const double &High[], const double &Low[], const double &Close[], const long &TickVolume[], const long &Volume[], const int &Spread[])
{
   for (int c = (prev_calculated > 0 ? prev_calculated - 1 : 0); c < rates_total; c++)
   {
      gl_buff_max[c] = High[c];
      gl_buff_min[c] = Low[c];
   }

   return rates_total;
};
//+------------------------------------------------------------------+
Code 06
Code 06 is the result of all the modifications made to Code 01, allowing us to plot two lines on the chart. Now, to make these lines multi-colored, we simply need to follow these steps.
01. //+------------------------------------------------------------------+
02. #property copyright "Daniel Jose"
03. //+------------------------------------------------------------------+
04. #property indicator_type1           DRAW_COLOR_LINE
05. #property indicator_color1          clrMaroon, clrTomato, clrBlue
06. //+----------------+
07. #property indicator_type2           DRAW_COLOR_LINE
08. #property indicator_color2          clrGreen, clrPaleGreen
09. //+----------------+
                   .
                   .
                   .
Code 07
Now let's compare Code 06 with Code 07. Please note that we changed the type of object used in the graphical representation from DRAW_LINE to DRAW_COLOR_LINE. After this, we can specify more than one color in the color property for each of the lines. The number of colors is completely arbitrary and, according to the MQL5 documentation, can have a maximum of 64 values. In fact, in one line we declared three colors, and in the other — two. However, you can use any colors of your choice. But this is not enough. We need to implement a few more things for MetaTrader 5 to understand what we want to do.
And now, pay attention. When using a multi-color graphical system, we need an additional buffer, as seen in the image below, which can be found in the documentation.
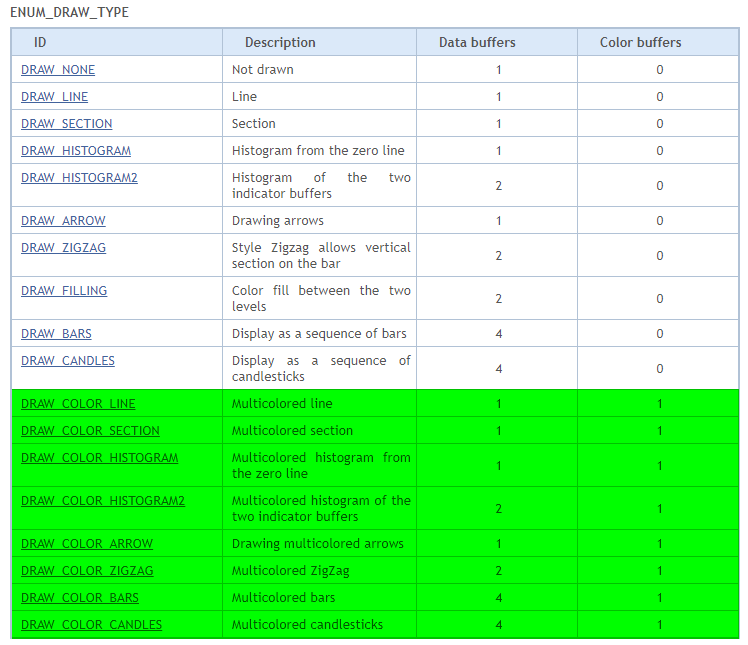
Figure 04
As you can see, all these highlighted points require a color buffer. Without this buffer, MetaTrader 5 will not know which color to use. Therefore, the next change we need to make is in the buffer declaration. This can be seen in the code snippet below:
                   .
                   .
                   .
09. //+----------------+
10. #property indicator_buffers         4
11. #property indicator_plots           2
12. //+----------------+
13. double   gl_buff_max[],
14.          gl_buff_min[],
15.          gl_color_max[],
16.          gl_color_min[];
17. //+------------------------------------------------------------------+
                   .
                   .
                   .
Code 08
In code snippet 08, we actually define our buffers. Please note that in line 10, we specify that we need four buffers.But why exactly four, if we are only going to plot two lines graphically? The reason is that we need one buffer for the represented values and another buffer for each color. Imagine a small two-value structure. Although MetaTrader 5 doesn't use a structure for this, we must think of it that way. And since MetaTrader 5 doesn't use structures for such modeling, we end up needing two buffers. But since we need to plot two lines, we ultimately require four buffers. They are declared starting from line 30 onwards, as seen in code snippet 08.
Great, now only the final step remains. We demonstrate this in the snippet below:
                   .
                   .
                   .
17. //+------------------------------------------------------------------+
18. int OnInit()
19. {
20.     SetIndexBuffer(0, gl_buff_max, INDICATOR_DATA);
21.     SetIndexBuffer(1, gl_color_max, INDICATOR_COLOR_INDEX);
22.     SetIndexBuffer(2, gl_buff_min, INDICATOR_DATA);
23.     SetIndexBuffer(3, gl_color_min, INDICATOR_COLOR_INDEX);
24.
25.     return INIT_SUCCEEDED;
26. };
27. //+------------------------------------------------------------------+
28. int OnCalculate(const int rates_total, const int prev_calculated, const datetime &Time[], const double &Open[], const double &High[], const double &Low[], const double &Close[], const long &TickVolume[], const long &Volume[], const int &Spread[])
29. {
30.     double  mhs = 0,
31.             mhi = 0,
32.             ml = 0;
33.     const double desv = 0.01;
34.
35.     for (int c = (prev_calculated > 0 ? prev_calculated - 1 : 0); c < rates_total; c++)
36.     {
37.         gl_color_max[c] = (mhi > High[c] ? 0 : (mhs < High[c] ? 1 : 2));
38.         mhs = mhi = gl_buff_max[c] = High[c];
39.         mhs += (mhs * desv);
40.         mhi -= (mhi * desv);
41.         gl_color_min[c] = (ml < Low[c] ? 0 : 1);
42.         ml = gl_buff_min[c] = Low[c];
43.     }
44.
45.     return rates_total;
46. };
47. //+------------------------------------------------------------------+
Code 09
Before explaining what we are doing in code snippet 09, let's look at the result of this indicator when applied to the chart of any instrument. This can be seen in the image below:
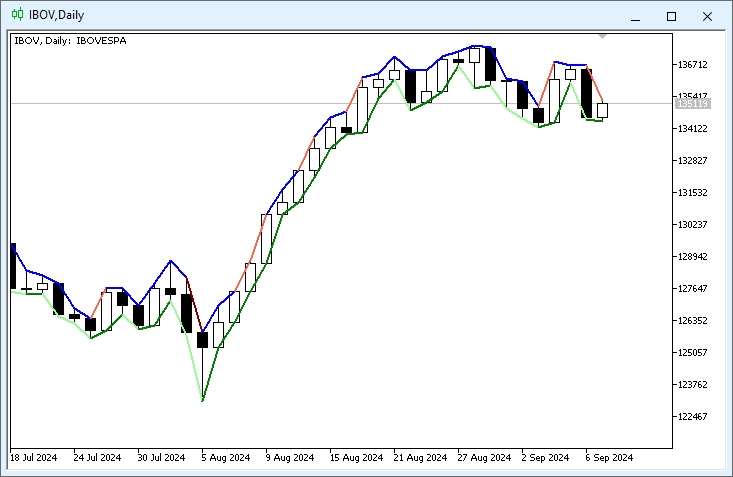
Figure 05
What we see is for demonstration purposes only, as this indicator was created purely for educational reasons. However, it is evident that the code for the indicator initialization phase has hardly changed—only lines 21 and 23 were added. Yet, it is crucial that you understand what each of these new lines does. First, note that each buffer has its own identifier. It doesn't matter what we intend to store in them; each must have its own identifier, otherwise MetaTrader 5 will get confused when using them.
In this case, it is very important to declare everything in a specific order. That is, BEFORE declaring the next data buffer, we must declare all data buffers that will be used in a given graphical representation line. Here, that includes the color buffer. If we declare data or color buffers in an illogical order, YOU WILL NOT achieve the desired result. Therefore, be careful when declaring elements here. The order of things affects the final outcome. After initialization, we can focus on the procedure that will handle the Calculate event triggered by MetaTrader 5.
Note that in this case, we perform some calculations and checks. This is because we need to tell MetaTrader 5 which of the colors defined in code 07 will be used when drawing the line on the screen. «But wait, I don’t understand how this is done. Here we only have numbers, while in code 07 there were color values. How will MetaTrader 5 know which color to use?»
Well, my dear reader, at this stage it is important to understand what was already explained in another article:what arrays are. What we have in code 07 are color arrays. Each color will be located at a specific array index. Therefore, in lines 21 and 23, we use the enumeration INDICATOR_COLOR_INDEX. WE ARE NOT SPECIFYING WHICH COLOR TO USE, but rather the index of the color in a specific array. But which array? If we have two arrays in code 07, how will MetaTrader 5 know which one to use?
This is where another recently discussed topic comes into play. In other words, the order of components affects the final result. Since we typically use this type of graphical representation in a singular form (i.e., one indicator, one line), MetaTrader 5 will use the color scheme directly associated with the identifier of the represented type. I know this might seem confusing, but note that in lines 04 and 05, we have an identifier value—in this case, the number one. In lines 07 and 08, we have another identifier—the number two. Thus, when we link a value to an indicator that is to be represented graphically, the compiler will use this identifier to know which color scheme to apply.
To demonstrate this, we defined a different number of colors in each declaration found in code 07, so you can grasp this when you start practicing with real code.
Although this part is a bit confusing—precisely because we are using everything statically and placing more than one graphical representation line simultaneously—in practice, you will find that it is actually quite straightforward to understand how to declare and use such elements.
In any case, when the user wants to change the color scheme, they will access an interface similar to this:
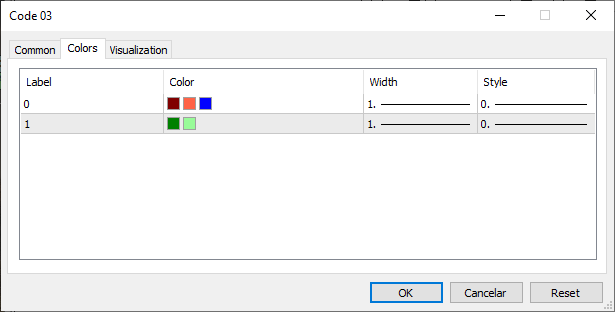
Figure 06
Note that, thanks to the declarations made in lines 05 and 08 of code 07, the user will be able to configure more than one color. Therefore, it is advisable for the interface to be as clear and simple as possible. Otherwise, even though the code may be quite useful for certain types of operations, the user will have a poor experience using it.
The codes will be provided in the appendix so you can study how to handle such situations. But before concluding today's article, I would like to discuss another indicator that lies somewhere between these two concepts, depending on how we apply it—it could be a band indicator or even a moving average crossover indicator. However, to avoid confusion, we will explore this in a new topic.
The DRAW_FILLING Indicator
This indicator is quite interesting because, depending on how it is implemented, it can result in a moving average crossover indicator or even a band indicator. However, novice programmers often find it confusing precisely because of how it needs to be declared. To help you understand how simple it is to declare and use this type of indicator, we will take code 06, provided at the beginning of the article, as our starting point. From there, it will be much easier to grasp what we are trying to achieve with the DRAW_FILLING indicator.
Taking code 06 as our starting point, we will modify it to understand the DRAW_FILLING indicator. Essentially, code 06 will look like this:
01. //+------------------------------------------------------------------+
02. #property copyright "Daniel Jose"
03. //+------------------------------------------------------------------+
04. #property indicator_type1           DRAW_FILLING
05. #property indicator_color1          clrRed, clrGreen
06. //+----------------+
07. #property indicator_buffers         2
08. #property indicator_plots           1
09. //+----------------+
10. double   gl_buff_max[],
11.          gl_buff_min[];
12. //+------------------------------------------------------------------+
13. int OnInit()
14. {
15.     SetIndexBuffer(0, gl_buff_max, INDICATOR_DATA);
16.     SetIndexBuffer(1, gl_buff_min, INDICATOR_DATA);
17.
18.     return INIT_SUCCEEDED;
19. };
20. //+------------------------------------------------------------------+
21. int OnCalculate(const int rates_total, const int prev_calculated, const datetime &Time[], const double &Open[], const double &High[], const double &Low[], const double &Close[], const long &TickVolume[], const long &Volume[], const int &Spread[])
22. {
23.     for (int c = (prev_calculated > 0 ? prev_calculated - 1 : 0); c < rates_total; c++)
24.     {
25.         gl_buff_max[c] = Open[c];
26.         gl_buff_min[c] = Close[c];
27.     }
28.
29.     return rates_total;
30. };
31. //+------------------------------------------------------------------+
Code 10
«Interesting. To my knowledge, code 06 has undergone very few changes. But I have some doubts regarding a few aspects, for example: why in the procedure handling the Calculate event are we using the open and close prices?» This is done to trigger a reversal or crossover of the maximum and minimum values, as they are called in code 10. Please note, dear readers: from time to time, we have a Sell bar, and from time to time—a Buy bar.
Now imagine that this DRAW_FILLING indicator is like a fabric with a print on both sides. When the values in the buffers defined in lines 15 and 16 cross, a reversal occurs, causing MetaTrader 5 to show one side of the fabric or the other. The information that will be displayed or printed on the fabric is declared in line 05. Thus, we can color the area in one color or another. If there were no crossover or reversal, we would see only one of the prints or colors defined in line 05.
However, we must consider a small detail: despite the extreme simplicity of code 10, when applied to a chart, it looks as shown in the figure below:
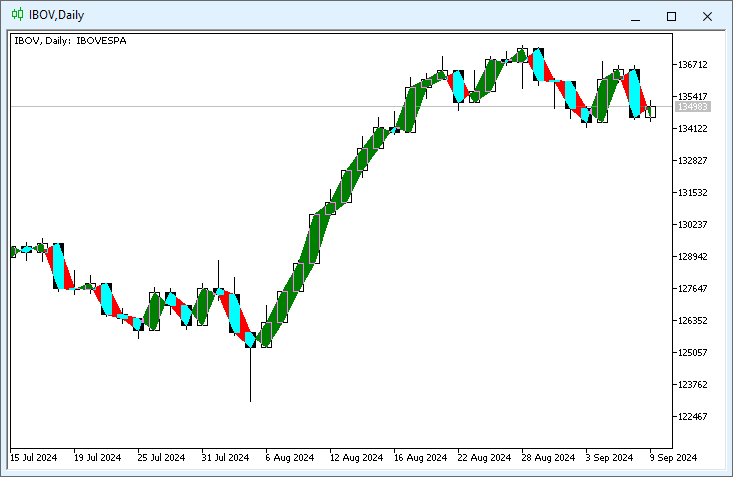
Figure 07
It doesn’t look very appealing and, in fact, can be quite confusing depending on the type of information being calculated and represented graphically. However, in line 05, the user will have the ability to configure some data, as shown in the figure below:
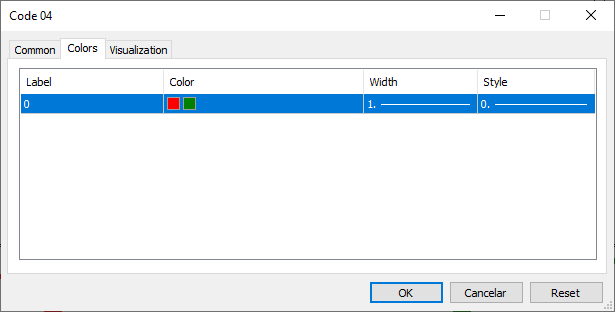
Figure 08
That is, depending on the type of work planned, this DRAW_FILLING type indicator can be quite interesting. However, precisely because of what is noticeable in Figure 07, this indicator is most often displayed not directly on the main chart, but in a separate window. Then a person might start to think: «My friend, everything is getting very complicated. I've barely learned how to create a colored indicator, and now you're starting to talk about placing it in another window? You’re presenting so much information that I’ll have to study hard».
Don’t worry, it’s not as daunting as it seems. In fact, MQL5, designed for programming in MetaTrader 5, offers many interesting and practical features.
Among them is the ability to place an indicator in a separate window. However, this window would still be linked to the main chart. One of the simplest and easiest ways to achieve this is to instruct the compiler to generate the indicator code in such a way that when applied to a chart, MetaTrader 5 understands that it needs to open a new window or sub-window. This is done by adding a single line to the indicator code. Thus, Code 10, shown earlier, will look like this:
01. //+------------------------------------------------------------------+
02. #property copyright "Daniel Jose"
03. //+------------------------------------------------------------------+
04. #property indicator_separate_window
05. //+----------------+
06. #property indicator_type1           DRAW_FILLING
07. #property indicator_color1          clrRed, clrGreen
08. //+----------------+
09. #property indicator_buffers         2
10. #property indicator_plots           1
11. //+----------------+
12. double   gl_buff_max[],
13.          gl_buff_min[];
14. //+------------------------------------------------------------------+
15. int OnInit()
16. {
17.     SetIndexBuffer(0, gl_buff_max, INDICATOR_DATA);
18.     SetIndexBuffer(1, gl_buff_min, INDICATOR_DATA);
19.
20.     return INIT_SUCCEEDED;
21. };
22. //+------------------------------------------------------------------+
23. int OnCalculate(const int rates_total, const int prev_calculated, const datetime &Time[], const double &Open[], const double &High[], const double &Low[], const double &Close[], const long &TickVolume[], const long &Volume[], const int &Spread[])
24. {
25.     for (int c = (prev_calculated > 0 ? prev_calculated - 1 : 0); c < rates_total; c++)
26.     {
27.         gl_buff_max[c] = Open[c];
28.         gl_buff_min[c] = Close[c];
29.     }
30.
31.     return rates_total;
32. };
33. //+------------------------------------------------------------------+
Code 11
Please note that the only difference between Code 10 and Code 11 lies precisely in line 04, which is absent in Code 10 but present in Code 11. After compiling this code, you can ask MetaTrader 5 to add it to the chart. As a result, Image 07, which might have been quite confusing before, will now look like this:
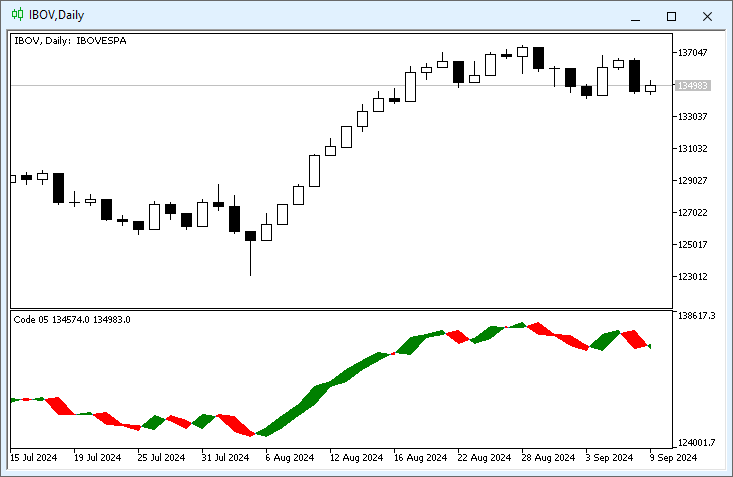
Figure 09
Figure 09 is certainly much simpler, although it might initially confuse some users when interpreting this chart.
Concluding thoughts
In this article, we have shown how to work with two different types of indicators that can be adapted in various ways. The goal is to create an application suited to one's own needs. Despite the seemingly simple material, I believe that with creativity and curiosity, one can understand that this content can be extended to other types of indicators: DRAW_SECTION, DRAW_HISTOGRAM, DRAW_ARROW, DRAW_ZIGZAG, DRAW_BARS, and DRAW_CANDLES. All of them function similarly to what we've seen in this article, although we only covered two—or three, if we count the DRAW_COLOR_LINE type. But that's just a minor detail.
What's truly important is that you practice and understand that everything displayed on a chart, no matter how complex it may appear, is quite simple in its construction. Essentially, you just need to instruct the compiler on how the indicator should be created, using a fully static implementation. Creating static indicators is straightforward and even enjoyable, but the real fun can be found in dynamic indicators. We will explore that very soon. In the meantime, you can study and apply what we've seen in this article, as we will soon make this type of implementation much more exciting and interesting.
Translated from Portuguese by MetaQuotes Ltd.
Original article: https://www.mql5.com/pt/articles/15828
Warning: All rights to these materials are reserved by MetaQuotes Ltd. Copying or reprinting of these materials in whole or in part is prohibited.
This article was written by a user of the site and reflects their personal views. MetaQuotes Ltd is not responsible for the accuracy of the information presented, nor for any consequences resulting from the use of the solutions, strategies or recommendations described.

- Free trading apps
- Over 8,000 signals for copying
- Economic news for exploring financial markets
You agree to website policy and terms of use
I am trying to build Custom indicator base on iBand.
After alot of searching I decide to Post here may be someone can help me.
Here is the full indicator. Very easy I just want to enable user to show or hide individual line such as BASE_LINE,UPPER_BAND,LOWER_BAND and Custom color only.
Problem 1 is:
You can see in picture attach, I don't know why I have green under chart.
Caros.
Estou tentando criar um indicador personalizado baseado no iBand.
Depois de muita pesquisa, decidi postar aqui, talvez alguém possa me ajudar.
Aqui está o indicador completo. Muito simples, eu só quero permitir que o usuário mostre ou oculte linhas individuais, como BASE_LINE, UPPER_BAND, LOWER_BAND e apenas a cor personalizada.
O problema 1 é:
Como você pode ver na imagem em anexo, não sei por que há uma área verde embaixo do gráfico.