How we developed the MetaTrader Signals service and Social Trading
MetaTrader Social Trading appeared in the summer of 2012. That's when we finally decided to launch a new service for automatic trade copying - Trading Signals. The idea of this project was to make trading a more widespread phenomenon: the target audience was novice traders with no experience or special skills. The stringent requirements were set for the new service: clarity, maximum availability regardless of skills and knowledge, a transparent operation mechanism and protection of subscribers.
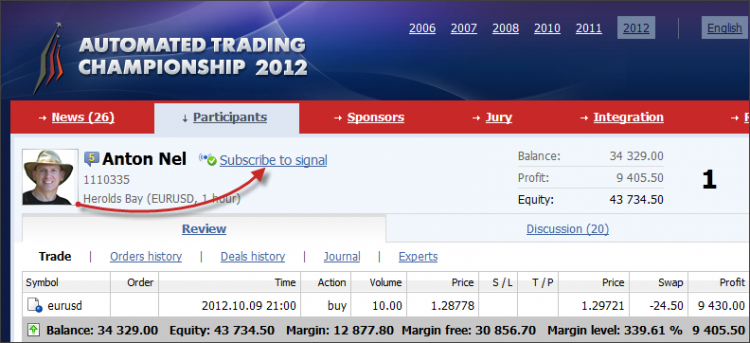
The deadline for launch was the beginning of October, on the start of the Automated Trading Championship 2012. This online competition was the most ideal venue for introducing and testing the new service, because it always attracted the attention of a great number of traders. Indeed, the signals were welcomed by traders: the launch of the service during the Championship enabled users to copy trading of successful participants on their own MetaTrader 5 accounts. This was a brand new feature at the competition.
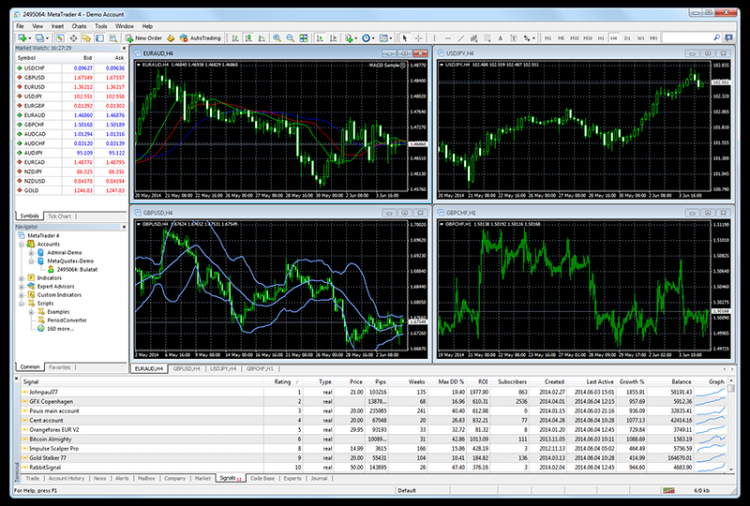
A month later, in November 2012, support for trading signals appeared in the MetaTrader 4 platform. Suppliers of signals received access to an audience of millions of potential investors, and the service began to gain momentum. At the beginning of November, about 10 signals were added daily; at the end of the month up to 25 were registered each day.
Subscriber Security
At the initial stage our task was to create a massive service for signal distribution, which would protect subscribers from connecting to unprofitable signals. Trader's protection was the top priority, as we understood the danger of copy trading, which could lead to loss of money. So we decided to distribute signals on the principle of quality rating, which is calculated based on a variety of parameters. The higher the quality rating, the higher the position of the signal in the list, and the greater its credibility among potential subscribers. In this scheme, potentially dangerous signals appear at the end of the list.
However, not only the rating protects users from the danger of subscribing to a losing signal. Depending on the degree of risk, the subscription option can be disabled for some signals. In special cases, a warning message is shown, like 'A large drawdown may occur on the account again', 'This is a newly opened account, and the trading results may be of random nature', 'Low trading activity - only 3 trades detected in the last month', etc.
We also implemented additional security measures: signal suppliers do
not know who their subscribers are (they known only the number of
signal subscribers), every deal carries a unique digital signature,
service developers do not collect personal information of subscribers
and do not have access to their accounts. We have done everything to
ensure security and help you enjoy the service, being confident that
your account is protected.
Signals Statistics
Much work has been done to improve the statistics of the signals.
When selecting a suitable signal, a trader primarily checks the
statistics carefully to understand how successfully the signal provider
trades and how reliable the signals are. Therefore, it was important to
provide adequate demonstration of trade statistics.
At the start of the Signals service in the autumn of 2012, only the two basic charts of growth and balance were available. The first one showed deposit growth in percentage terms calculated based on the results of trading operations, the second chart showed the amount of funds on the account without floating unfixed profit of current open positions.
A little later, in early 2013, we added a new chart of Distribution that showed the distribution of the symbols and the Sell/Buy ratio. This allowed the service users to get a better understanding of the trading strategy of a selected signals vendor.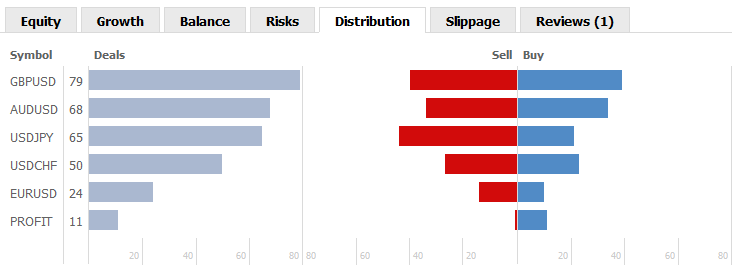
In the summer of 2013 we added the "Equity" chart to show the account equity taking into account the current open positions. A few months later the statistics again were significantly expanded: a vertical line appeared in the growth and balance charts to divide trading before connection to the monitoring and after that, color change was introduced for every non-trade transactions (depositing or withdrawal), a new option for tracking the best and worst trade series was added to the statistics. The aim of these changes in statistics was to provide potential subscribers with a complete picture of the signals offered by suppliers.
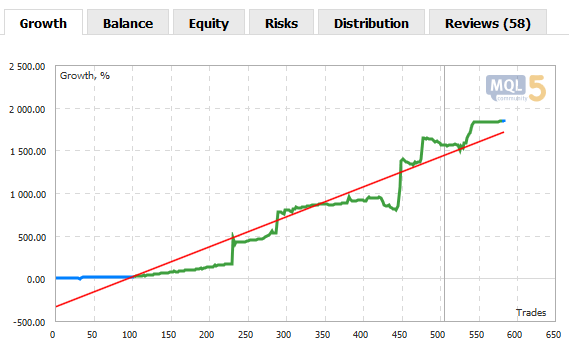
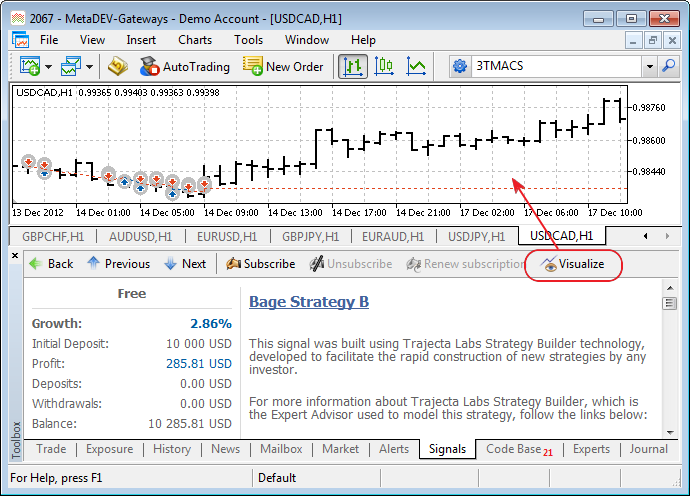
With the same purpose in mind, a little earlier, in January 2013, we introduced a unique innovation for the entire industry - visualization on charts. This new feature made the service even more convenient for traders, because now they can see the entire history of signal trading on charts. A single button opens charts of all currency pairs, which were traded on the signal account. Despite the unique nature of this service, traders very quickly got used to it and began to perceive it as an integral part of copy trading. This is a good example of how we set the standard for excellence in social trading. The main competitor of MetaQuotes is MetaQuotes, so the development of the service is similar to a race with ourselves. Where others would have rested on their laurels of first small achievements, we are always a step ahead and constantly strive to improve copy trading mechanisms.
Signals in MetaTrader are like a living organism, they evolve in
accordance with the laws dictated by the developers. We are not in
content with the current situation, and we constantly review the quality
ratings, select signal evaluation criteria and change the calculation
formula. These actions are intended to feature only the best and proven
to succeed signals in the top list.
Compatibility of trading conditions of the subscriber and the signal provider
Another important aspect of the Signals service is compatibility of the trading conditions of the subscriber and the signal provider. This is a critical element for the normal operation of the service, since differences in conditions may lead to a worse copy quality or even complete inability to copy trades. If trading conditions are incompatible, a signal is either invisible to the subscriber, or is in the list of prohibited subscription. It is important that the subscriber is always informed of the differences with the provider's trading conditions, both when subscribing and during each synchronization of the terminal with the signal server.
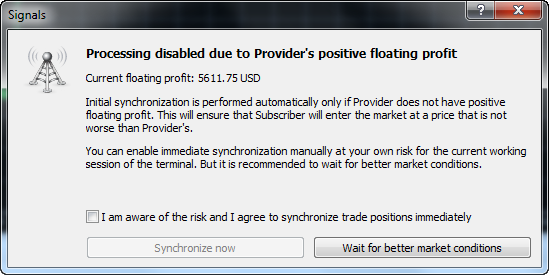
Over time, we have enhanced this element further. It started as a comparison of the subscriber's account settings with those of the signal provider (deposit currency and leverages), then the comparison of settings of each trading instrument was introduced. From the comparison of trading conditions in the subscriber's terminal, we then proceeded to provide this comparison for subscriptions that were performed mql5.com site. After some time, we added mapping of instruments - now without defining the matching of an instrument, the service can find the most appropriate one.
For example, if the subscriber does not have EURUSD, which is traded by the provider, signals can be copied for EURUSD.m, if the subscriber has this one. Mapping has greatly expanded the possibilities of copy trading, as even on different servers of the same broker names of instruments may vary.
We continue to improve the Signals Service
We continue to enhance the Signals service, improve the mechanisms, add new functions and fix flaws. The MetaTrader Signals Service of 2012 and the current MetaTrader Signals Service are like two completely different services. Currently, we are implementing A Virtual Hosting Cloud service which consists of a network of servers to support specific versions of the MetaTrader client terminal. Traders will need to complete only 5 steps in order to rent the virtual copy of their terminal with minimal network latency to their broker's trade server directly from the MetaTrader client terminal. This will provide round the clock operation of the terminal where traders copy trades of signal providers. Furthermore, we are planning to introduce even better statistics of signals and provide a new option for traders to form their own portfolio of signals.
Translated from Russian by MetaQuotes Ltd.
Original article: https://www.mql5.com/ru/articles/1400
Warning: All rights to these materials are reserved by MetaQuotes Ltd. Copying or reprinting of these materials in whole or in part is prohibited.
 Indicator for Constructing a Three Line Break Chart
 Regression Analysis of the Influence of Macroeconomic Data on Currency Prices Fluctuation
 MQL5 Cookbook - Multi-Currency Expert Advisor and Working with Pending Orders in MQL5
- Free trading apps
- Over 8,000 signals for copying
- Economic news for exploring financial markets
You agree to website policy and terms of use
