
Working with currency baskets in the Forex market

Introduction
Every day we read multiple financial news from global markets containing such phrases as "The dollar has weakened against the major currencies..." This means that the status of one currency has changed relative to a group of other currencies. The constant use of such verbal constructions generates a need for arranging the entire list of currency pairs by dividing them into groups and subgroups.
The materials devoted to various methods of symbol division into groups, or "baskets" are not uncommon on various trader forums. Currency pair division by "baskets" is made to accurately analyze the joint behavior of the symbols adjacent to each other in the "basket". It is assumed that these currency pairs usually behave in similar way forming extreme values at roughly the same time and moving mostly in the same direction. Such a symbol group (or a "basket") is represented as an average virtual currency pair that can be properly analyzed.
Principles and definitions
The entire idea is based on re-grouping currency pairs by attributes important for traders. Some attributes of this kind are well-known to everyone, for example correlation between oil prices and the rate of the ruble or correlation between EURUSD and USDCHF. Therefore, we can combine them into a group (currency basket). After defining the basket contents, we can plan possible actions with it including actions affecting all pairs within the basket simultaneously (these are EURUSD and USDCHF in our case). We can both track the pairs' behavior and perform trade operations.
Buying or selling a currency basket involves simultaneous trade operations with each currency within it. In this case, a basket of oppositely directed orders based on the "one currency pair — one order" principle is composed. Conditions, at which trade operations are performed, characterize the currency basket status.
Natural and obvious principle of grouping currency pairs can be applied for further work. All twenty-eight major currency pairs are divided into baskets according to their base currencies (or quote currencies) that should be present in each pair. A basket is named in accordance with a base currency (see an example in Table 1). In this case, the basket status is defined by its base currency status. The status parameters include overbought/oversold state and other similar attributes. They are provided by the same means of technical analysis that we use to evaluate ordinary currency pairs.
Main currency baskets
Let's divide the entire pool of currency pairs according to the principle stated above. As a result, we get eight currency baskets containing seven currency pairs each:
| Number | Basket name | Basket currency | Basket currency pairs |
|---|---|---|---|
| 1 |
AUD basket |
AUD |
AUDUSD, AUDNZD, AUDJPY, AUDCAD, AUDCHF, EURAUD, GBPAUD |
| 2 |
CAD basket |
CAD |
USDCAD, AUDCAD, NZDCAD, GBPCAD, EURCAD, CADCHF, CADJPY |
| 3 |
CHF basket |
CHF |
CHFJPY, USDCHF, GBPCHF, EURCHF, AUDCHF, NZDCHF, CADCHF |
| 4 |
EUR basket |
EUR |
EURUSD, EURJPY, EURCHF, EURGBP, EURNZD, EURCAD, EURAUD |
| 5 |
GBP basket |
GBP |
EURGBP, GBPAUD, GBPCAD, GBPCHF, GBPJPY, GBPNZD, GBPUSD |
| 6 |
JPY basket |
JPY |
AUDJPY, CADJPY, CHFJPY, EURJPY, GBPJPY, NZDJPY, USDJPY |
| 7 |
NZD basket |
NZD |
NZDUSD, AUDNZD, NZDJPY, NZDCAD, NZDCHF, EURNZD, GBPNZD |
| 8 |
USD basket |
USD |
EURUSD, GBPUSD, AUDUSD, NZDUSD, USDCAD, USDCHF, USDJPY |
Table 1. Currency baskets
Now that we have defined the contents of the baskets, it is time to clarify the main trading operations with them. Let's assume that buying and selling a basket means buying and selling its currency.
Suppose that positive news about the yen arrive hinting at its possible strengthening. A trader decides to buy JPY. According to our paradigm, the trader should enter a SHORT trade at all its currency pairs to buy the JPY basket. In the opposite case, the trader should enter a buy trade at all basket pairs to sell the JPY basket.
The case does not look so confusing when dealing with the EUR basket. If the trader wants to buy the EUR basket, it enters a buy trade at all its pairs and vice versa. For EUR and JPY, the order basket consists of unidirectional orders.
Let's arrange the following table to avoid confusion with trading operations:
| Number | Basket name | Trading operation with the basket currency |
Trading operation with the basket currency pairs | ||||||
|---|---|---|---|---|---|---|---|---|---|
1 |
AUD basket |
|
AUDUSD | AUDNZD | AUDJPY | AUDCAD | AUDCHF | EURAUD | GBPAUD |
| SELL | sell | sell | sell | sell | sell | buy | buy | ||
| BUY | buy | buy | buy | buy | buy | sell | sell | ||
2 |
CAD basket |
|
USDCAD | AUDCAD | NZDCAD | GBPCAD | EURCAD | CADCHF | CADJPY |
| SELL | buy | buy | buy | buy | buy | sell | sell | ||
| BUY | sell | sell | sell | sell | sell | buy | buy | ||
3 |
CHF basket |
|
CHFJPY | USDCHF | GBPCHF | EURCHF | AUDCHF | NZDCHF | CADCHF |
| SELL | sell | buy | buy | buy | buy | buy | buy | ||
| BUY | buy | sell | sell | sell | sell | sell | sell | ||
4 |
EUR basket |
|
EURUSD | EURJPY | EURCHF | EURGBP | EURNZD | EURCAD | EURAUD |
| SELL | sell | sell | sell | sell | sell | sell | sell | ||
| BUY | buy | buy | buy | buy | buy | buy | buy | ||
5 |
GBP basket |
|
EURGBP | GBPAUD | GBPCAD | GBPCHF | GBPJPY | GBPNZD | GBPUSD |
| SELL | buy | sell | sell | sell | sell | sell | sell | ||
| BUY | sell | buy | buy | buy | buy | buy | buy | ||
6 |
JPY basket |
|
AUDJPY | CADJPY | CHFJPY | EURJPY | GBPJPY | NZDJPY | USDJPY |
| SELL | buy | buy | buy | buy | buy | buy | buy | ||
| BUY | sell | sell | sell | sell | sell | sell | sell | ||
7 |
NZD basket |
|
NZDUSD | AUDNZD | NZDJPY | NZDCAD | NZDCHF | EURNZD | GBPNZD |
| SELL | sell | buy | sell | sell | sell | buy | buy | ||
| BUY | buy | sell | buy | buy | buy | sell | sell | ||
8 |
USD basket |
|
EURUSD | GBPUSD | AUDUSD | NZDUSD | USDCAD | USDCHF | USDJPY |
| SELL | buy | buy | buy | buy | sell | sell | sell | ||
| BUY | sell | sell | sell | sell | buy | buy | buy | ||
Table 2. Trading operations with the baskets
Basket currency status
How should we decide on performing a trading operation with a currency basket? It would be quite difficult to do so based solely on currency pairs behavior due to the large size of the baskets. We need additional technical data on basket currency status parameters. Let's focus our attention on the RSI indicator graph for the three currency pairs from the GBP basket, namely GBPUSD, GBPJPY and GBPCHF. D1 graph is displayed in the image below:
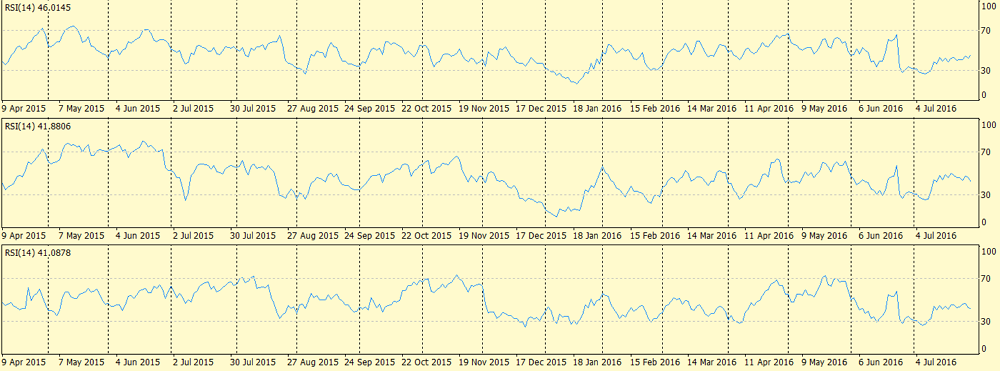
As you can see, these three graphs have much in common: many extreme values are located similarly, while up and down intervals also have much in common. This similarity can be explained by the same basket currency — the British pound. Its strengthening and weakening lead to such up and down intervals.
Differences in all three graphs are largely explained by the different behavior of currency quotes. In this case, the influence of the different behavior can be seen in "extra" local extreme values, various gradients of descending and ascending movements, as well as local direction changes.
If we define the behavior of the common parameter (shared by all pairs of a basket) and eliminate its differences between the pairs, we will accomplish our main objective — the parameter visualization. In the current example, GBP overbought/oversold status is a common currency status parameter acting as a "unified RSI" showing the status of the basket currency instead of a currency pair.
Of course, we do not have to limit ourselves by RSI only. There may be other similar indicators based on standard ones. Let's call them "unified indicators".
Methods of calculating basket currency status parameters
In order to solve the task, we need to consider the already existing ones and try to act similarly. The first thing that comes to mind in this regard is the USD index. As we remember, it shows USD status against six other major currencies. First, let's pay attention to the calculation equation. This is a geometric mean with weight ratios. We will try to apply this principle to our USD basket by using a custom set of currency pairs. Let's accept another assumption — remove weight ratios and reduce the equation to calculating a normal geometric mean. We implement these changes to apply the geometric mean principle to perform calculations at all baskets. In real practice, we will have no knowledge of weight ratios for any currency pair.
Let's see if our changes have any effect. To do this, we will use a simple indicator:
#property copyright "Copyright 2016, MetaQuotes Software Corp."
#property link      "http://www.mql5.com"
#property version   "1.00"
#property strict

#property indicator_separate_window
#property indicator_buffers 1

input int     iBarsTotal=300;

string pair[]={"EURUSD","GBPUSD","AUDUSD","NZDUSD","USDCAD","USDCHF","USDJPY"};
bool bDirect[]={false,false,false,false,true,true,true};
int iCount=7;
//+------------------------------------------------------------------+
//|                                                                  |
//+------------------------------------------------------------------+
double GetValue(int shift)
  {
   double res=1.0,t;
   for(int i=0; i<iCount; i++)
     {
      t=iClose(pair[i],0,shift);
      if(!bDirect[i]) t=1/t;
      res*=t;
     }//end for (int i = 0; i < iCount; i++)
   return (NormalizeDouble(MathPow (res, (double)1/iCount), _Digits) );
  }

double upp[];
//+------------------------------------------------------------------+
//|                                                                  |
//+------------------------------------------------------------------+
int OnInit()
  {
   IndicatorShortName("testBasket");
   IndicatorDigits(_Digits);
   SetIndexStyle(0,DRAW_LINE,STYLE_SOLID,2,clrGreen);
   SetIndexBuffer(0,upp);
   SetIndexLabel(0,"testBasket");

   return(INIT_SUCCEEDED);
  }
//+------------------------------------------------------------------+
//|                                                                  |
//+------------------------------------------------------------------+
int OnCalculate(const int rates_total,
                const int prev_calculated,
                const datetime &time[],
                const double &open[],
                const double &high[],
                const double &low[],
                const double &close[],
                const long &tick_volume[],
                const long &volume[],
                const int &spread[])
  {
   if(prev_calculated==0)
     {

      int total;
      if(iBarsTotal==0) total=rates_total;
      else total= MathMin(iBarsTotal,rates_total);
      for(int i = 0; i<total; i++) upp[i] = GetValue(i);
     }//end if (prev_calculated == 0)
   else
     {
      upp[0]=GetValue(0);
     }
   return(rates_total);
  }
For comparison, we use free USDX.mq4 indicator drawing USD index the standard way. Below are the results (H1 timeframe):
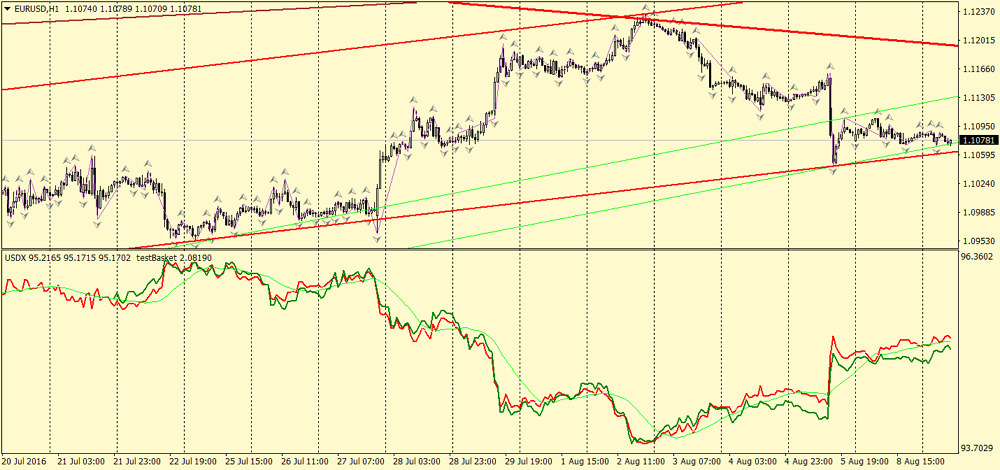
testBasket.mq4 indicator is shown in dark green in the image, while USDX.mq4 indicator is shown in red and light green (average). We may notice a very good match on H1 timeframe. Movement directions at most segments coincide, as do the vast majority of local extreme points.
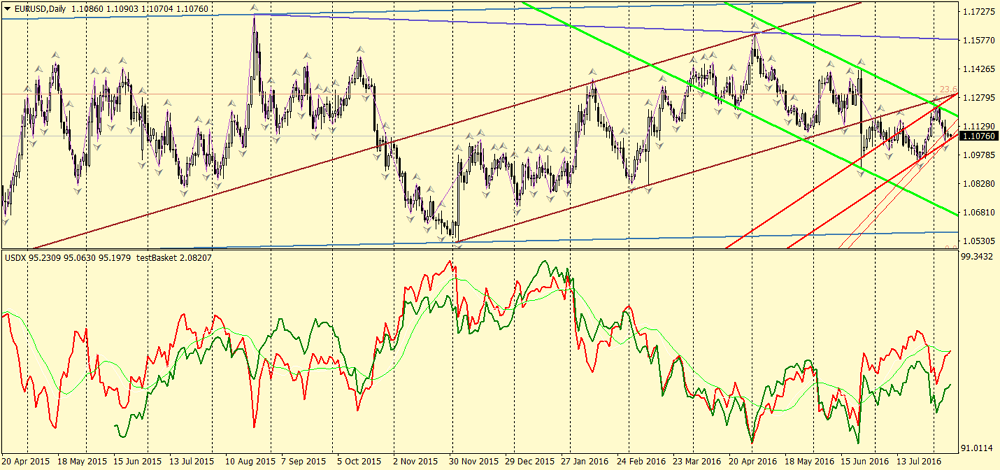
On D1, the picture is less favorable but still quite acceptable. The positions of the majority of local extreme points are the same, as is the movement direction in most areas. Differences in some areas can be easily explained by the lack of weight ratios and a different set of currency pairs. Besides, the scales of the charts superimposed on each other are different.
On the basis of the obtained results, we consider the geometric mean calculation equation acceptable for calculating different basket currency status parameters. We will call it the method #1 further on. However, we should also be aware about the equation limitations. More specifically, it would be a bad idea to use it with arguments that can take negative values. There are quite a lot of such arguments in technical indicators. In addition, calculating the geometric mean may considerably load the terminal if such calculations are not in a separate library.
We can apply another equation, say, the common arithmetic mean, to eliminate the limitation on the use of negative values as arguments. Let's create yet another test indicator for calculations based on that equation. Stochastic indicator values are used as arguments:
#property copyright "Copyright 2016, MetaQuotes Software Corp."
#property link      "http://www.mql5.com"
#property version   "1.00"
#property strict

#property indicator_separate_window
#property indicator_minimum    0
#property indicator_maximum    100

#property indicator_buffers 2

input int     iBarsTotal=3000;

string pair[]={"EURUSD","EURJPY","EURCHF","EURGBP","EURNZD","EURCAD","EURAUD"};
int iCount=7;
//+------------------------------------------------------------------+
//|                                                                  |
//+------------------------------------------------------------------+
void GetValue(int shift,double &s1,double &s2)
  {
   s1=0; s2=1;
   for(int i=0; i<iCount; i++)
     {
      s1 += iStochastic(pair[i],0,5,3,3,MODE_SMA,0,0,shift);
      s2 *= iStochastic(pair[i],0,5,3,3,MODE_SMA,0,0,shift);
     }
   s1 = NormalizeDouble(s1/iCount, _Digits);
   s2 = NormalizeDouble(MathPow (s2, (double)1/iCount), _Digits);
  }

double upp[],upp1[];
//+------------------------------------------------------------------+
//|                                                                  |
//+------------------------------------------------------------------+
int OnInit()
  {
   IndicatorShortName("testBasketS");
   IndicatorDigits(_Digits);
   SetIndexStyle(0,DRAW_LINE,STYLE_SOLID,2,clrRed);
   SetIndexBuffer(0,upp);
   SetIndexLabel(0,"testBasketSA");
   SetIndexStyle(1,DRAW_LINE,STYLE_SOLID,2,clrGreen);
   SetIndexBuffer(1,upp1);
   SetIndexLabel(1,"testBasketSG");

   return(INIT_SUCCEEDED);
  }
//+------------------------------------------------------------------+
//|                                                                  |
//+------------------------------------------------------------------+
int OnCalculate(const int rates_total,
                const int prev_calculated,
                const datetime &time[],
                const double &open[],
                const double &high[],
                const double &low[],
                const double &close[],
                const long &tick_volume[],
                const long &volume[],
                const int &spread[])
  {
   if(prev_calculated==0)
     {

      int total;
      if(iBarsTotal==0) total=rates_total;
      else total= MathMin(iBarsTotal,rates_total);
      for(int i = 0; i<total; i++) GetValue(i,upp[i],upp1[i]);
     }//end if (prev_calculated == 0)
   else
     {
      GetValue(0,upp[0],upp1[0]);
     }
   return(rates_total);
  }
Download this indicator to EURGBP D1 chart. The obtained result is shown below:
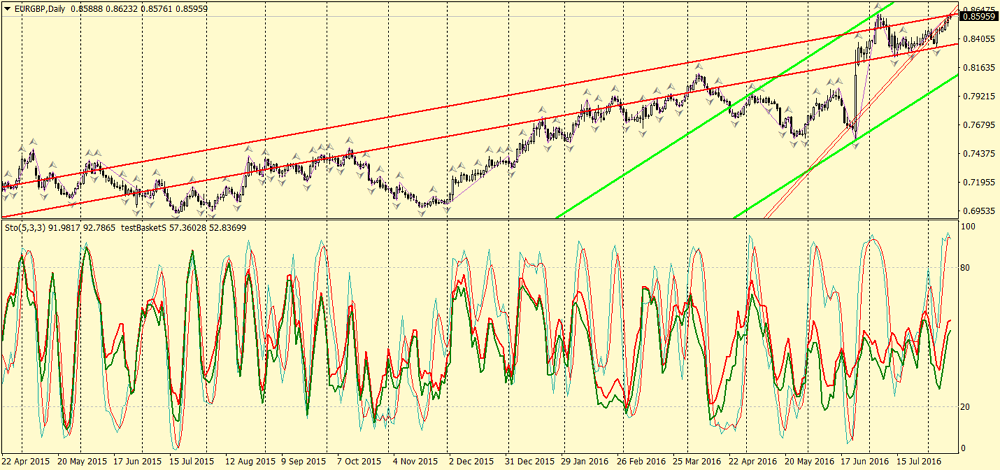
Thin lines stand for the original Stochastic, the red double-width line is a new unified Stochastic based on the arithmetic mean equation, while the green double-width line shown for comparison is based on the geometric mean.
Analyzing the equations, we can see that they yield very similar results. The graph based on the geometric mean has more visible extreme points, while the one based on the arithmetic mean is more smoothed. Although, this may be nothing more but our subjective impression. Limitations associated with negative arguments and PC computing power seem to be the most critical factors affecting the practical application. Generally, the arithmetic mean can also be applied for calculations as the method #2.
Initial practical conclusions
After having read the previous paragraphs, you may ask yourself "What is the need of all of this?" We have obtained the new indicator drawing a graph similar to the USD index one, as well as another indicator drawing a Stochastic-like graph. We can also obtain another indicator drawing the chart similar to the standard RSI. But we already have conventional RSI and Stochastic. Why do we need other ones? Let's try to answer this question.
- The unified indicators provide data on a basket currency status allowing traders to forecast the movements of all currency pairs within the basket. In turn, such a forecast allows trading operations with all currency pairs within the basket.
- The combination of indicators similar to the conventional ones (like on the last image containing Stochastic) forms a filter that helps traders avoid entries on certain pairs within the basket, analyze graph crossing points and detect divergences.
- Let us not forget that two currencies form a pair, and each of them has its own basket. Traders can obtain data on each of them and plan their further actions using the unified indicators.
Any of these points can serve as a basis for developing an efficient trading system. Besides, unified indicators can be used in conjunction with other trading systems. However, this topic exceeds the boundaries of the present introductory article.
Conclusion
Keep in mind that trading decisions should be made based on several signals, unless you apply a non-indicator trading method. The present article has described the method of obtaining such signals in a relatively new way. However, it should not be considered as a complete replacement of standard means. The use of unified RSI, Stochastic and other indicators together with standard ones can provide enough high-quality confirmation signals, thus improving your trading efficiency.
Translated from Russian by MetaQuotes Ltd.
Original article: https://www.mql5.com/ru/articles/2660
Warning: All rights to these materials are reserved by MetaQuotes Ltd. Copying or reprinting of these materials in whole or in part is prohibited.
This article was written by a user of the site and reflects their personal views. MetaQuotes Ltd is not responsible for the accuracy of the information presented, nor for any consequences resulting from the use of the solutions, strategies or recommendations described.

 Statistical Distributions in MQL5 - taking the best of R and making it faster
 The Easy Way to Evaluate a Signal: Trading Activity, Drawdown/Load and MFE/MAE Distribution Charts
 Neural network: Self-optimizing Expert Advisor
 Portfolio trading in MetaTrader 4
- Free trading apps
- Over 8,000 signals for copying
- Economic news for exploring financial markets
You agree to website policy and terms of use
Multi pair indicators usually never work in strategy tester because it needs too many other chart feeds.
Strategy tester does not provide all needed data.
Don't know if this is too late, being like 5 years ago lol, but your indicator has a major flaw. It's assuming that ALL of the data that you've got for all of your currency pairs is exact. Meaning the time in AUDUSD 10 bars ago is the exact same time as the time from AUDNZD 10 bars ago. Unless you go to each one and make sure all of the data is downloaded, that would cause issues when loading the indicator. Also, there can be problems/gaps in history, which would also cause (compounding) issues. If just one is off, then it will be off the rest of the candles going back, and will get even more off as others aren't exact.
You need to use iBarShift with the current time of the bar that you're working on to get the actual shift of the bar in different currency pairs. basically if "i" is your working bar, then..
barShift = iBarShift("AUDNZD",_Period,Time[i]);
Then check to see if it's returned an error, and if not..
otherOpen = iOpen("AUDNZD",_Period,barShift);
That will guarantee you're getting the correct value instead of blindly walking backwards and building something that probably isn't totally accurate.
Don't know if this is too late, being like 5 years ago lol, but your indicator has a major flaw. It's assuming that ALL of the data that you've got for all of your currency pairs is exact. Meaning the time in AUDUSD 10 bars ago is the exact same time as the time from AUDNZD 10 bars ago. Unless you go to each one and make sure all of the data is downloaded, that would cause issues when loading the indicator. Also, there can be problems/gaps in history, which would also cause (compounding) issues. If just one is off, then it will be off the rest of the candles going back, and will get even more off as others aren't exact...
Of course, I completely agree with you) But this article did not imply the development of indicators. This is just a theoretical basis. The indicators accompanying this article are for educational purposes and are for illustration purposes only. They cannot be used for real work.
Indicators that can be used on real accounts are much more complicated. This is a completely different task.
Don't know if this is too late, being like 5 years ago lol, but your indicator has a major flaw. It's assuming that ALL of the data that you've got for all of your currency pairs is exact. Meaning the time in AUDUSD 10 bars ago is the exact same time as the time from AUDNZD 10 bars ago. Unless you go to each one and make sure all of the data is downloaded, that would cause issues when loading the indicator. Also, there can be problems/gaps in history, which would also cause (compounding) issues. If just one is off, then it will be off the rest of the candles going back, and will get even more off as others aren't exact.
You need to use iBarShift with the current time of the bar that you're working on to get the actual shift of the bar in different currency pairs. basically if "i" is your working bar, then..
barShift = iBarShift("AUDNZD",_Period,Time[i]);
Then check to see if it's returned an error, and if not..
otherOpen = iOpen("AUDNZD",_Period,barShift);
That will guarantee you're getting the correct value instead of blindly walking backwards and building something that probably isn't totally accurate.
error in data feed must always be checked! Do not trust broker data. Its only something like 95-99%.
error in data feed must always be checked! Do not trust broker data. Its only something like 95-99%.
Of course, Bernhard . Thanks )
Checks are absolutely essential