Discussion of article "Canvas based indicators: Filling channels with transparency"
Good day!
Is it realistic to realise that when scrolling the chart, the frame follows the candlesticks without delay as in the case with objects?
Good time!
Is it realistic to realise that when scrolling the chart, the frame follows the candlesticks without delay as in the case with objects?
It is possible to fiddle with OBJ_BITMAP, when the upper left corner of the picture is bound to the price-time with overlapping of the window itself, i.e. when the size of the canvas is larger than the size of the window itself.
In this case you can achieve almost complete absence of delay.
But there arises the problem of changing the vertical scale and the event model becomes much more complicated.
That's why I personally wouldn't do this.
There is another alternative - to disable the native chart and form your own one on the canvas. But it is suitable if you don't need to use other indicators on this chart.
Great job Samuel!
But I saw a situation here: using it in my indicator, every time the PRICES axis re-scales, we see that CANVAS does not update itself.
See the images:
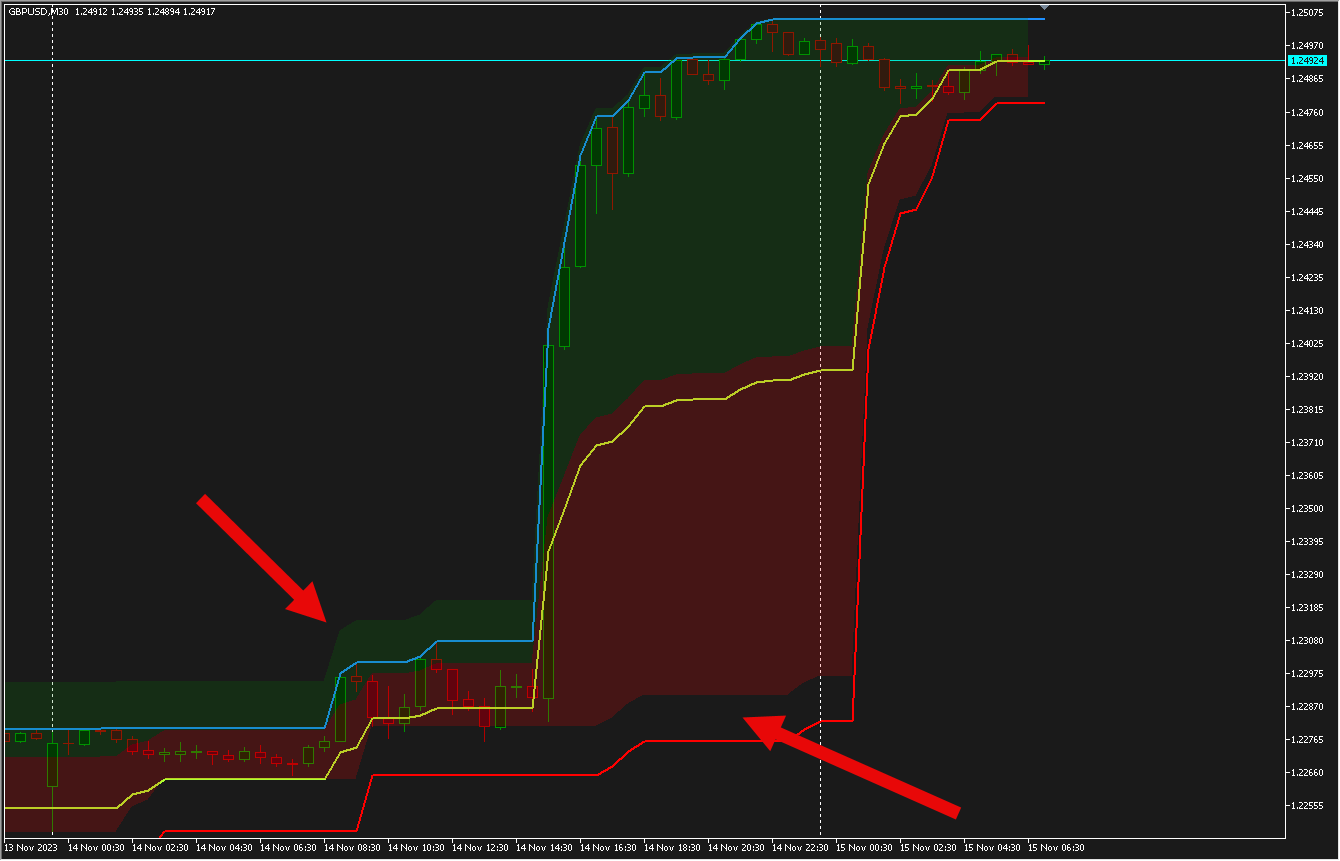
and here, after I resize manually the window and everything had been fixed automatically, when the current candle crossed the bounds the chart causing a complete re-scaling of candles, the CANVAS did not re-scale again, as it should:
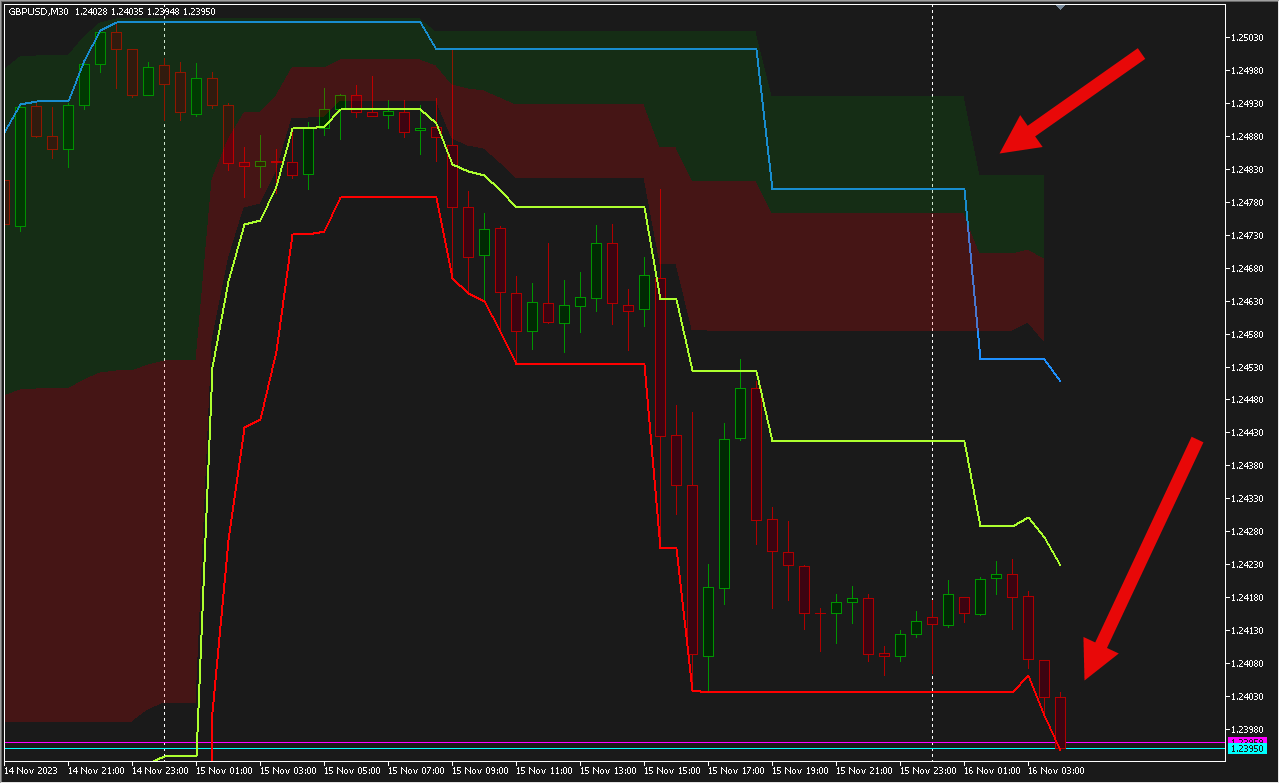
Also, I can see that the DrawFilling function consumes a lot of time if we use it twice, I mean, to plot 2 colors among three lines (see above). I guess it would be interesting if we could optimize the routine for speed.
Anyway, great job and article - congrats!
- Free trading apps
- Over 8,000 signals for copying
- Economic news for exploring financial markets
You agree to website policy and terms of use
New article Canvas based indicators: Filling channels with transparency has been published:
In this article I'll introduce a method for creating custom indicators whose drawings are made using the class CCanvas from standard library and see charts properties for coordinates conversion. I'll approach specially indicators which need to fill the area between two lines using transparency.
Now we will make some small updates to get it working.
And that is done. You can see how it looks now with two Envelopes with different periods and one rectangle object.
Author: Samuel Manoel De Souza