Nine Lives of Moving Averages MT5
- Indikatoren
- Version: 4.11
- Aktualisiert: 18 November 2021
- Aktivierungen: 5

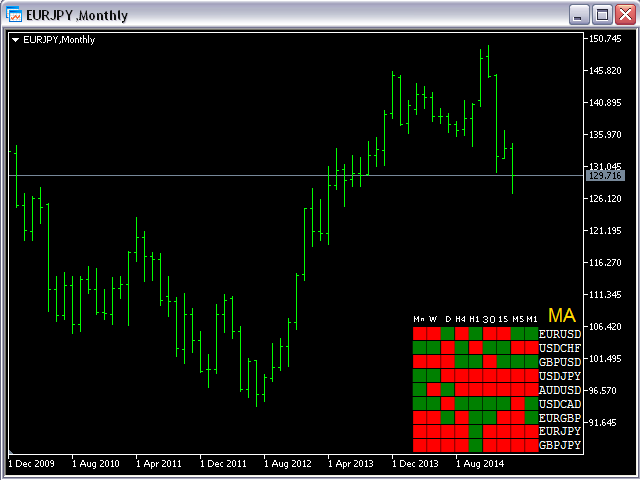
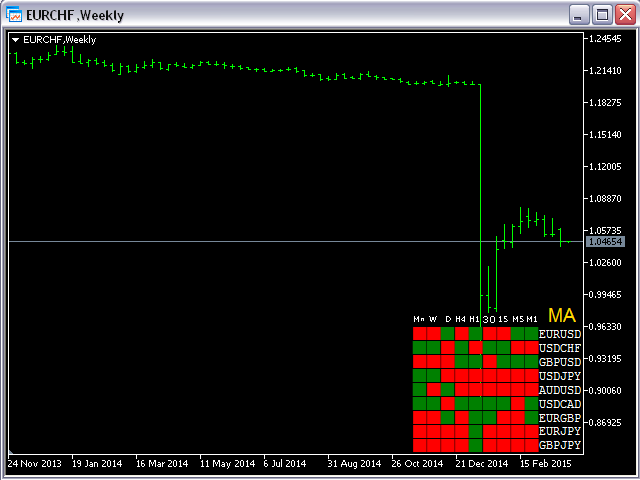
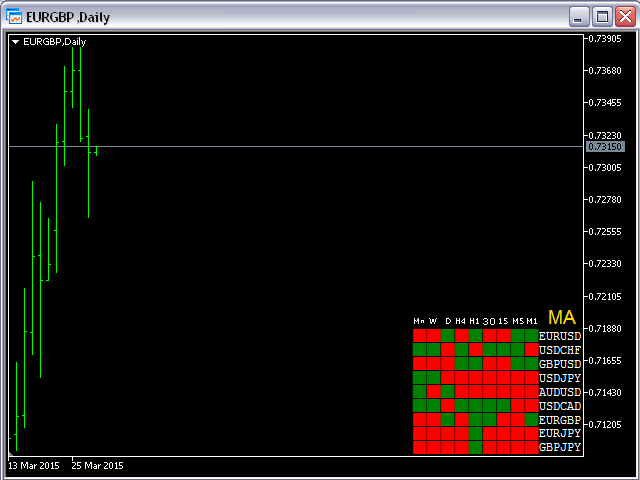
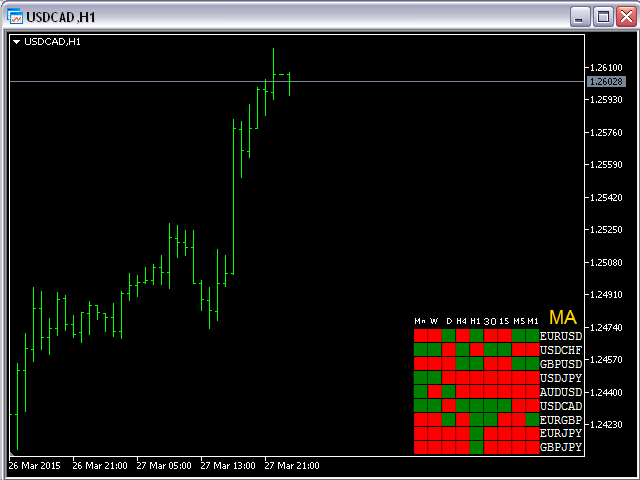
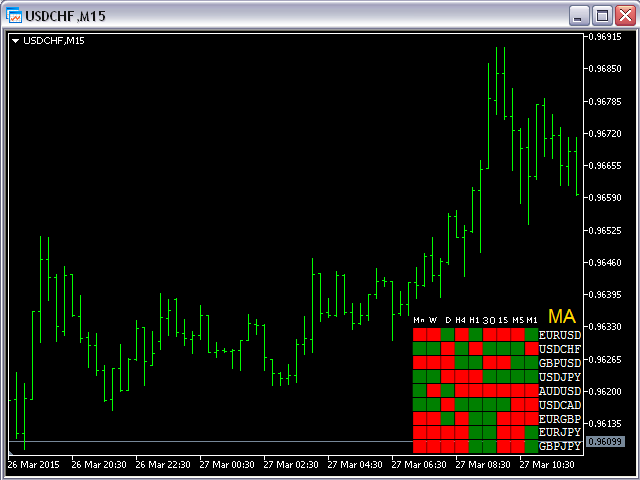
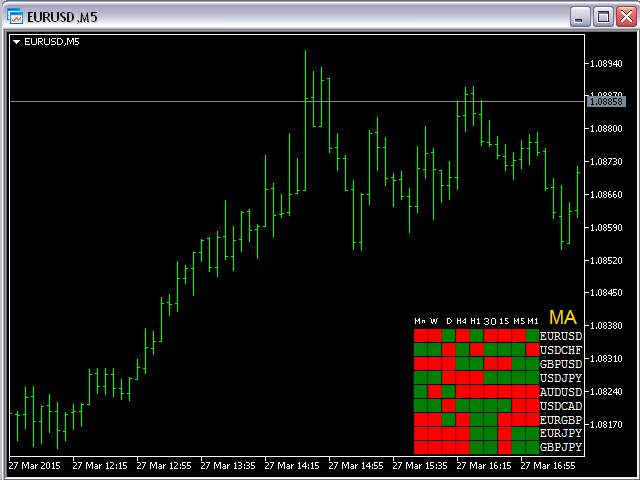
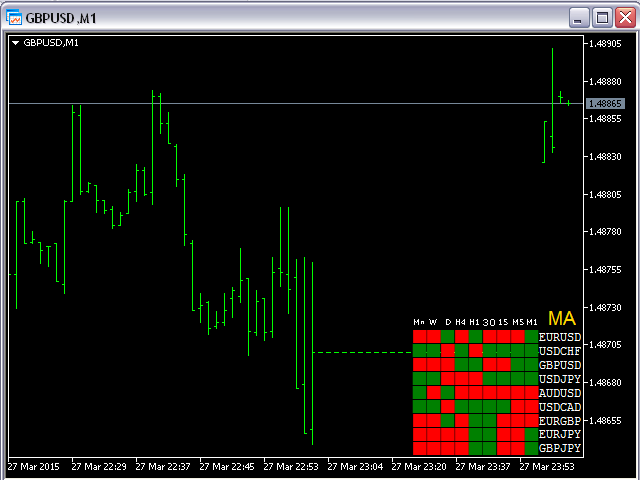
Dieser Indikator zeigt einen Aufwärtstrend (grünes Quadrat), wenn der schnelle MA über dem langsamen MA liegt, und einen Abwärtstrend (rotes Quadrat), wenn der schnelle MA unter dem langsamen MA liegt, und zwar in allen Zeitrahmen für jedes Währungspaar.
Eingabeparameter
- Von Symb1 bis Symb9 - Sie können jedes dieser Symbole in ein beliebiges legales Währungspaar ändern, das auf Ihrer Plattform existiert.
- Period_Fast=5 - Mittelungsperiode für den ersten MA1.
- Method_Fast=MODE_EMA - Glättungsart für MA1.
- Price_Fast=PRICE_CLOSE - Der für MA1 verwendete Preis.
- Period_Slow=21 - Mittelungszeitraum für den ersten MA2.
- Method_Slow=MODE_SMA - Glättungsart für MA2.
- Price_Slow=PRICE_TYPICAL - Der für MA2 verwendete Preis.
Achtung
Bevor Sie diesen Indikator verwenden, müssen Sie alle Charts (alle TF) für alle 9 Währungspaare öffnen.