Nine Lives of Moving Averages MT5

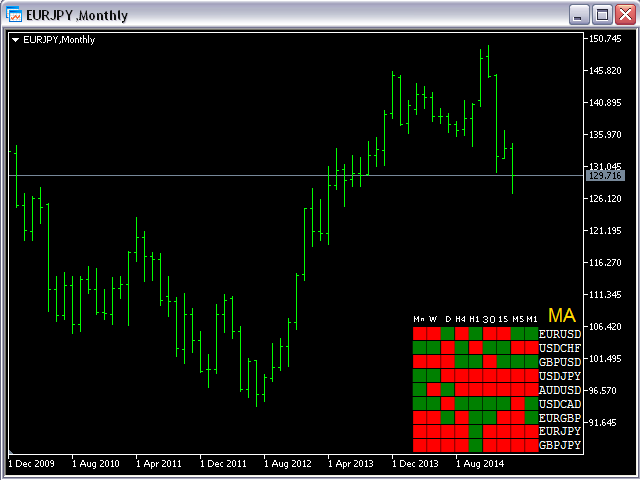
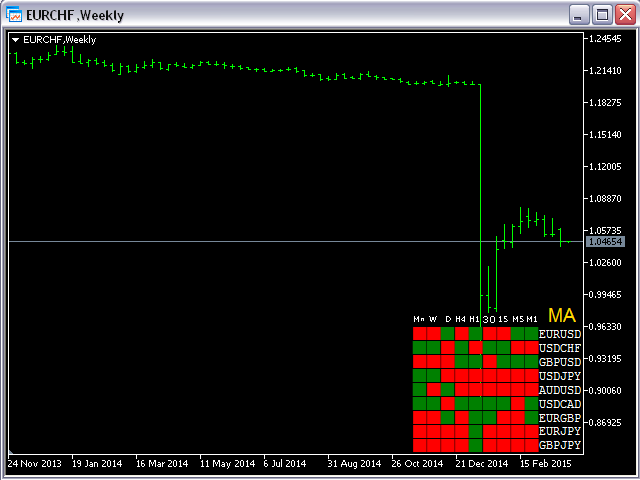
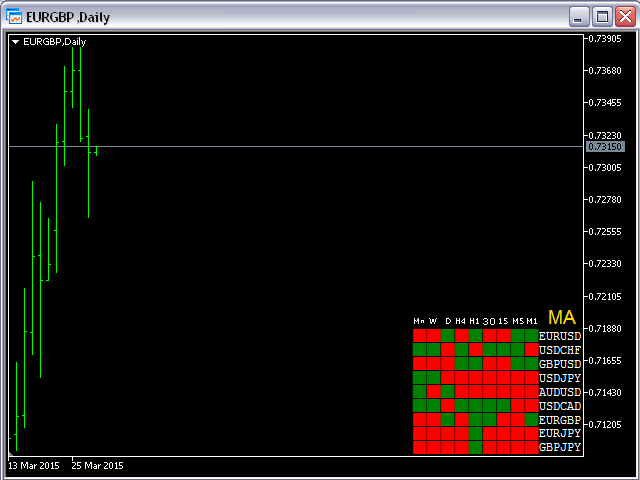
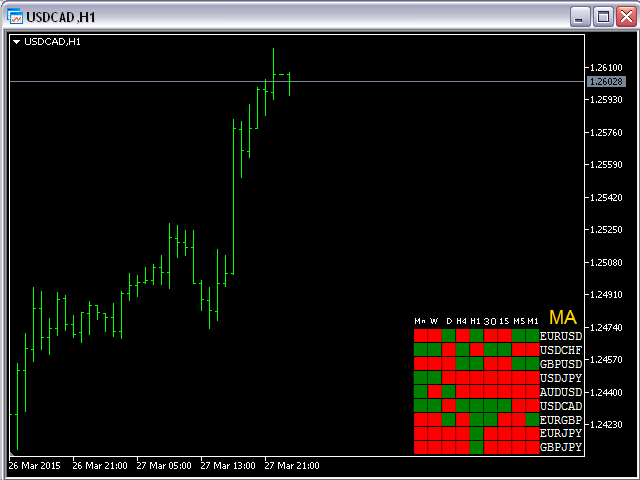
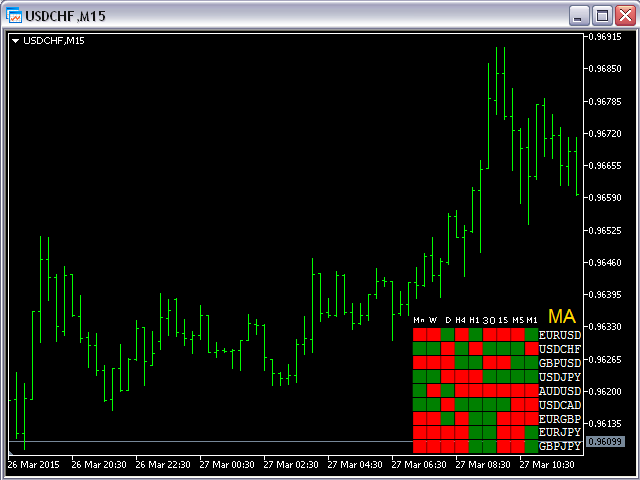
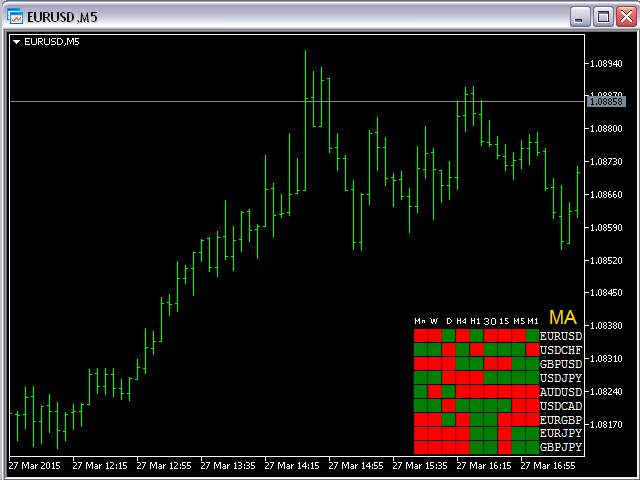
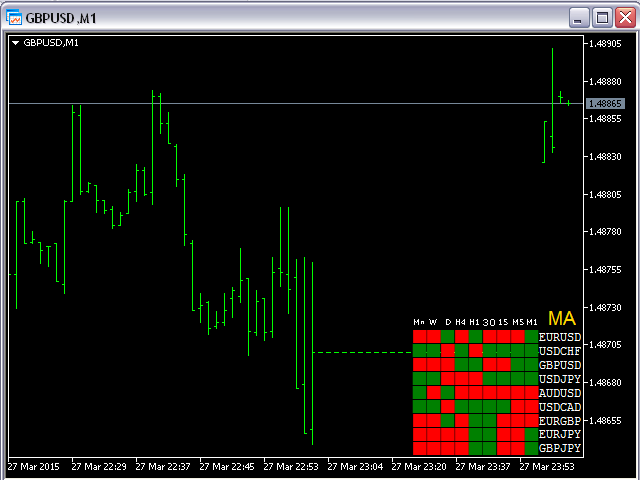
This indicator shows an Up trend (Green square) if a fast MA is above slow MA and Down trend (Red square) if a fast MA is below a slow MA from all Time Frame for each currency pairs.

Input parameters

  • From Symb1 to Symb9 — You may change any of these Symbols to any legal currency pair existed on your platform.
  • Period_Fast=5 — Averaging period for the first MA1.
  • Method_Fast=MODE_EMA — Smoothing type for MA1.
  • Price_Fast=PRICE_CLOSE — The price used for MA1.
  • Period_Slow=21 — Averaging period for the first MA2.
  • Method_Slow=MODE_SMA — Smoothing type for MA2.
  • Price_Slow=PRICE_TYPICAL — The price used for MA2.

Attention

Before using this indicator you have to open all charts (all TF) for all 9 currency pairs.

Produits recommandés
HMA Trend Professional MT5
Pavel Zamoshnikov
4.25 (4)
Improved version of the free HMA Trend indicator (for MetaTrader 4) with statistical analysis. HMA Trend is a trend indicator based on the Hull Moving Average (HMA) with two periods. HMA with a slow period identifies the trend, while HMA with a fast period determines the short-term movements and signals in the trend direction. The main differences from the free version: Ability to predict the probability of a trend reversal using analysis of history data. Plotting statistical charts for analyzi
The rubdfx divergence indicator is a technical analysis tool that compares a security's price movement. It is used to identify potential changes in the price trend of a security. The indicator can be applied to any type of chart, including bar charts and candlestick charts. The algorithm is based on MACD, which has been modified to detect multiple positive and negative divergences. Settings  ___settings___ * fastEMA * slowEMA * signalSMA *Alerts:   True/False     #Indicator Usage Buying :
Stratégie de Flèche RSI Bandes de Bollinger (RSI Bollinger Bands Arrow Strategy) La Stratégie de Flèche RSI Bandes de Bollinger est un indicateur technique propre et efficace, conçu pour identifier les points de retournement à haute probabilité en utilisant la combinaison du RSI et des Bandes de Bollinger. Cette stratégie utilise l'indicateur RSI avec les Bandes de Bollinger pour: Vendre lorsque le prix est au-dessus de la Bande de Bollinger supérieure. Acheter lorsque le prix est en dessous de
Noize Absorption Index - is the manual trading system that measures the difference of pressure between bears forces and bulls forces. Green line - is a noize free index that showing curent situation. Zero value of index shows totally choppy/flat market.Values above zero level shows how powerfull bullish wave is and values below zero measures bearish forces.Up arrow appears on bearish market when it's ready to reverse, dn arrow appears on weak bullish market, as a result of reverse expectation.
The chaos wave
Letlhogo Mokgatle
This is the best indicator we have created by far, this indicator replicates the well known heiken ashi indicator,  but with a more precise entry point, this indicator can work on all time-frames and is strong on all the time frames , this indicator does not repaint nor does it lag , this indicator strategy combined with price action will change your trading experience , elevate your experience to the next level.
Indicateur pour déterminer plat et tendance. Si le prix est inférieur à l'un des deux histogrammes et des deux lignes (rouge et bleu), il s'agit d'une zone de vente. Lors de l'achat de cette version de l'indicateur, version MT4 pour un compte réel et un compte démo - en cadeau (pour recevoir, écrivez-moi un message privé) ! Si le prix est au-dessus de l'un des deux histogrammes et des deux lignes (rouge et bleue), il s'agit d'une zone d'achat. Version MT4 : https://www.mql5.com/en/market/pro
Owl Smart Levels MT5
Sergey Ermolov
4.03 (32)
Version MT4   |  FAQ L' indicateur Owl Smart Levels est un système de trading complet au sein d'un seul indicateur qui comprend des outils d'analyse de marché populaires tels que les fractales avancées de Bill Williams , Valable ZigZag qui construit la structure d'onde correcte du marché et les niveaux de Fibonacci qui marquent les niveaux exacts d'entrée. sur le marché et les endroits où prendre des bénéfices. Description détaillée de la stratégie Mode d'emploi de l'indicateur Conseiller-Assis
There are many linear regression indicators out there, most of them draw lines or channels, but this one actually draws a chart. The beauty of the indicator like Heiken Ashi is it removes a lot of market noise. 4 (OHLC) arrays are filled with Linear Regression(LR) values of each price for the LR period (default=14). The period of the Linear Regression is adjustable dependant on the market conditions. The SMA (default=14) also has period adjustment. Candles are generated with Green for 'Up' cand
Over Trend MT5
Mansour Babasafary
Trend based indicator Identify trends with this indicator A simple-to-use trend indicator No complicated settings Attributes: Can be used in all symbols Can be used in all time frames Relatively high signals No complicated settings Specific to the trend Lifetime support Settings: Alarm Show Alert: By activating these settings, after receiving the signal, you will receive an alarm in Metatrader Alarm Show Notification: By activating these settings, after receiving the signal, you will receive a
Scanner and Dashboard for Money Flow Index MT5 The Money Flow Index (MFI) is a technical oscillator that uses price and volume data for identifying overbought or oversold signals in an asset. It can also be used to spot divergences which warn of a trend change in price. The oscillator moves between 0 and 100. Advantages of the Scanner: - Full Alert Options. - Multi Timefrare  - Works for all instruments including Currencies, Indices, Commodities, Cryptocurrencies and Stocks. - Fully customisabl
Description: Index Trend with Signal:   is the Best working on DE40, USTEC, US30, US500 index on H-1 time chart with default settings. You don't need to change any settings. Easy to install and ready to start working. First of all this Index Trend with Signal Indicator is Non-Repainting, Non-Redrawing Indicator, which is best tool for Index Traders.  For limited time only 50% OFF,  Now 51$ only. 10 purchases left & the price increases to 30$ and final price will be 300$ Contact me right after th
Directional Force Histogram (DFH) Indicateur de pression de marché et d’état du momentum Directional Force Histogram (DFH) est un indicateur basé sur un histogramme, conçu pour refléter l’état réel du marché et aider le trader à interpréter clairement la pression directionnelle, la force du mouvement et les phases de ralentissement ou de transition . DFH ne fournit pas de signaux automatiques d’achat ou de vente . Son objectif est d’apporter du contexte de marché , afin d’améliorer la qualité de
The Antique Trend Indicator is a revolutionary trend trading and filtering solution with all the important features of a trend tool built into one tool! The Antique Trend indicator is good for any trader, suitable for any trader both for Forex and binary options. There is no need to configure anything, everything has been perfected by time and experience, it works great during flats and trends. The Antique Trend indicator is a tool for technical analysis of financial markets, reflecting curren
Universal Soul Reaper
Pieter Gerhardus Van Zyl
Universal Soul Reaper is an atmospheric market-flow oscillator designed to interpret price behavior as a cycle of spiritual energy. Instead of reacting to raw price alone, it visualizes the state of the market’s soul —revealing when momentum is awakening, stabilizing, or fading. The indicator operates in a separate window and presents three interwoven entities: the Ectoplasmic Veil , the Spirit Boundary , and the Soul Core . Together, they form a living framework that helps traders sense pressu
Trade Filter is a tool designed primarily for traders using many Expert Advisors on the same currency pair and/or grid systems creating many simultaneous trading operations. By adding the filter (as an indicator) to a given chart, must select a magic number of the EA and only its trades remain visible. Numerous settings for colors, line styles, font sizes and others have been added, through which you can adjust the display according to your preferences. Set files also can be created and loaded.
The new update makes this indicator a complete tool for studying, analyzing and operating probabilistic patterns. It includes: On-chart Multi-asset percentage monitor. Configurable martingales. Twenty-one pre-configured patterns, including Mhi patterns and C3. An advanced pattern editor to store up to 5 custom patterns. Backtest mode to test results with loss reports. Trend filter. Hit operational filter. Martingale Cycles option. Various types of strategies and alerts. Confluence between patter
Gobbo MT5
Alessandro Grossi
Gobbo è un indicatore professionale che evidenzia il trend del mercato con un aspetto grafico chiaro e comprensibile, è basato sulla Moving Average e può essere impostato su qualsiasi periodo di intervallo, di default impostato sul periodo 14, scegliendo un periodo più alto evidenzierà meno cambi di tendenza per un approccio sul medio o lungo periodo, con un periodo più basso più cambi di tendenza per un approccio sul breve termine L'aggiornamento e l'adattamento al time frame scelto avviene in
Order Flow Strength
Vincent Jose Proenca
Order Flow Strength (OFS) Description : Indicateur mesurant la force du flux d’ordres en analysant la position de la clôture dans la plage de chaque bougie, pondérée par le volume . Permet de visualiser la pression acheteuse (vert) et vendeuse (rouge) dans une fenêtre séparée. Formule Order Flow Strength = Close − Low High − Low × Volume \text{Order Flow Strength} = \frac{\text{Close} - \text{Low}}{\text{High} - \text{Low}} \times \text{Volume} Order Flow Strength = High − Low Close − Low ​ × V
Trade history
Andriy Konovalov
5 (2)
The indicator plots charts of profit taken at the Close of candles for closed (or partially closed) long and short positions individually. The indicator allows to filter deals by the current symbol, specified expert ID (magic number) and the presence (absence) of a substring in a deal comment, to set the start time and the periodicity of profit reset (daily, weekly or monthly) to calculate the profit chart. The indicator also displays the floating (not fixed) profit of the opened positions at th
Identify precise entry and exit points with AB=CD patterns This indicator finds AB=CD retracement patterns. The AB=CD Retracement pattern is a 4-point price structure where the initial price segment is partially retraced and followed by an equidistant move from the completion of the pullback, and is the basic foundation for all harmonic patterns. [ Installation Guide | Update Guide | Troubleshooting | FAQ | All Products ] Customizable pattern sizes Customizable AC and BD ratios Customizable b
L'indicateur SMC Venom Model BPR est un outil professionnel pour les traders travaillant dans le concept Smart Money (SMC). Il identifie automatiquement deux modèles clés sur le graphique des prix: FVG   (Fair Value Gap) est une combinaison de trois bougies, dans laquelle il y a un écart entre la première et la troisième bougie. Forme une zone entre les niveaux où il n'y a pas de support de volume, ce qui conduit souvent à une correction des prix. BPR   (Balanced Price Range) est une combinaiso
First Dawn MT5
Innovicient Limited
The First Dawn indicator uses a unique mechanism to search and plot signals. This keeps searching for signals, making it a great indicator for scaping and identification of changes in direction, swing trading and trend trading. The    First Dawn     helps you get early signals. The backtest gives the true picture of how the indicator works with real/demo accounts. Although this is a tiny indicator it is packed with advantageous settings that will help you whether you desire to: Snap the Peaks a
Indicateur unique qui met en œuvre une approche professionnelle et quantitative pour signifier le trading de réversion. Il capitalise sur le fait que le prix dévie et revient à la moyenne de manière prévisible et mesurable, ce qui permet des règles d'entrée et de sortie claires qui surpassent largement les stratégies de trading non quantitatives. [ Installation Guide | Update Guide | Troubleshooting | FAQ | All Products ] Des signaux de trading clairs Étonnamment facile à échanger Couleurs et t
Indicador visual que mostra a direção de um ativo em diferentes times frames. Acompanhe em tempo real a variação de direção dos preços nos últimos 3 candles. É possível escolher o ativo a ser mostrado e quais times frames deseja acompanhar. Excelente para operações Day Trade. Facilita a visualização de vários times frames auxiliando assim na tomada de decisão rápida. Parâmetros de fácil configuração.
This trading indicator is non-repainting, non-redrawing, and non-lagging, making it an ideal choice for both manual and automated trading. It is a Price Action–based system that leverages price strength and momentum to give traders a real edge in the market. With advanced filtering techniques to eliminate noise and false signals, it enhances trading accuracy and potential. By combining multiple layers of sophisticated algorithms, the indicator scans the chart in real-time and translates comple
Buy CTS scalping indicator, provide buying and selling signals, automatic channeling and sending signals to mobile phones Using technical analysis and price action methods and modern methods, CTS indicator can draw price channels and recognize price trends with high accuracy and issue entry and exit signals according to them. Traders can easily fluctuate using this indicator in different time frames and in different markets. With the CTS indicator, you can signal in different ways. This indicato
"GoldenSwing" is a comprehensive MetaTrader 5 indicator meticulously crafted by Southern Star Trading, designed to enhance your trading strategies with precision swing high and swing low identification. Harnessing the power of swing analysis, this indicator provides traders with invaluable insights into market reversals and trend continuations, enabling them to make informed trading decisions. With its advanced algorithm, GoldenSwing detects significant swing highs and swing lows in real-time,
Adjustable Consecutive Fractals  looks for 2 or more fractals in one direction and sends out a on screen alert, sound alert and push notification, for strong reversal points . Adjustable Consecutive Fractals, shows the fractals on chart along with a color changing text for buy and sell signals when one or more fractals appear on one side of price. Adjustable Consecutive Fractals is based Bill Williams Fractals . The standard Bill Williams fractals are set at a non adjustable 5 bars, BUT withe th
Indicateur Crypto_Forex Motif PINBAR pour MT5, sans refonte, sans délai. - L'indicateur « Motif PINBAR » est un indicateur très performant pour le trading Price Action. - L'indicateur détecte les PinBars sur le graphique : - PinBar haussière : signal de flèche bleue sur le graphique (voir images). - PinBar baissière : signal de flèche rouge sur le graphique (voir images). - Avec alertes PC et mobile. - L'indicateur « Motif PINBAR » est idéal pour combiner les niveaux de support et de résistanc
Les acheteurs de ce produit ont également acheté
Si vous achetez cet indicateur, vous recevrez mon Gestionnaire de Trading Professionnel + EA  GRATUITEMENT. Tout d'abord, il convient de souligner que ce système de trading est un indicateur non repeint, non redessiné et non retardé, ce qui le rend idéal pour le trading manuel et automatisé. Cours en ligne, manuel et téléchargement de préréglages. Le "Système de Trading Smart Trend MT5" est une solution de trading complète conçue pour les traders débutants et expérimentés. Il combine plus de 10
ARIPoint
Temirlan Kdyrkhan
1 (1)
ARIPoint is a powerful trading companion designed to generate high-probability entry signals with dynamic TP/SL/DP levels based on volatility. Built-in performance tracking shows win/loss stats, PP1/PP2 hits, and success rates all updated live. Key Features: Buy/Sell signals with adaptive volatility bands Real-time TP/SL/DP levels based on ATR Built-in MA Filter with optional ATR/StdDev volatility Performance stats panel (Success, Profit/Loss, PP1/PP2) Alerts via popup, sound, push, or email Cu
SuperScalp Pro
Van Minh Nguyen
5 (2)
SuperScalp Pro – Système d’indicateur de scalping avancé multi-filtres SuperScalp Pro est un système d’indicateur de scalping avancé qui combine le Supertrend classique avec plusieurs filtres de confirmation intelligents. L’indicateur fonctionne efficacement sur toutes les unités de temps de M1 à H4 et est particulièrement adapté à XAUUSD, BTCUSD et aux principales paires Forex. Il peut être utilisé comme système autonome ou intégré de manière flexible dans des stratégies de trading existantes.
Entry In The Zone and SMC Multi Timeframe is a real-time market analysis tool developed based on Smart Money Concepts (SMC). It is designed to analyze market structure, price direction, reversal points, and key zones across multiple timeframes in a systematic way. The system displays Points of Interest (POI) and real-time No Repaint signals, with instant alerts when price reaches key zones or when signals occur within those zones. It functions as both an Indicator and a Signal System (2-in-1), c
Game Changer est un indicateur de tendance révolutionnaire, conçu pour être utilisé sur tout instrument financier et transformer votre MetaTrader en un puissant analyseur de tendances. L'indicateur ne se redessine pas et est sans latence. Il fonctionne sur n'importe quelle unité de temps et facilite l'identification des tendances, signale les retournements potentiels, agit comme un stop suiveur et fournit des alertes en temps réel pour une réaction rapide du marché. Que vous soyez un trader expé
Divergence Bomber
Ihor Otkydach
4.89 (82)
Chaque acheteur de cet indicateur reçoit également gratuitement : L’outil exclusif « Bomber Utility », qui accompagne automatiquement chaque opération de trading, fixe les niveaux de Stop Loss et de Take Profit, et clôture les positions selon les règles de la stratégie Des fichiers de configuration (set files) pour adapter l’indicateur à différents actifs Des set files pour configurer le Bomber Utility selon différents modes : « Risque Minimum », « Risque Équilibré » et « Stratégie d’Attente » U
Power Candles MT5
Daniel Stein
5 (5)
Power Candles – Signaux d’entrée basés sur la force pour tous les marchés Power Candles intègre l’analyse de force éprouvée de Stein Investments directement dans le graphique des prix. Au lieu de réagir uniquement au prix, chaque bougie est colorée en fonction de la force réelle du marché, ce qui permet d’identifier instantanément les phases de momentum, l’accélération de la force et les transitions de tendance propres. Une logique unique pour tous les marchés Power Candles fonctionne automatiqu
Azimuth Pro
Ottaviano De Cicco
5 (3)
LAUNCH PROMO Azimuth Pro price is initially set at 299$ for the first 100 buyers. Final price will be 499$ . THE DIFFERENCE BETWEEN RETAIL AND INSTITUTIONAL ENTRIES ISN'T THE INDICATOR — IT'S THE LOCATION. Most traders enter at arbitrary price levels, chasing momentum or reacting to lagging signals. Institutions wait for price to reach structured levels where supply and demand actually shift. Azimuth Pro maps these levels automatically: swing-anchored VWAP, multi-timeframe structure lines, an
FX Power MT5 NG
Daniel Stein
5 (31)
FX Power : Analysez la force des devises pour des décisions de trading plus intelligentes Aperçu FX Power est l'outil essentiel pour comprendre la force réelle des principales devises et de l'or, quelles que soient les conditions du marché. En identifiant les devises fortes à acheter et les faibles à vendre, FX Power simplifie vos décisions de trading et révèle des opportunités à forte probabilité. Que vous suiviez les tendances ou anticipiez les retournements à l'aide de valeurs extrêmes de D
TrendMaestro5
Stefano Frisetti
note: this indicator is for METATRADER4, if you want the version for METATRADER5 this is the link:  https://www.mql5.com/it/market/product/108106 TRENDMAESTRO ver 2.5 TRENDMAESTRO recognizes a new TREND from the start, he never makes mistakes. The certainty of identifying a new TREND is priceless. DESCRIPTION TRENDMAESTRO identifies a new TREND in the bud, this indicator examines the volatility, volumes and momentum to identify the moment in which there is an explosion of one or more of these da
Atomic Analyst MT5
Issam Kassas
4.07 (28)
Tout d'abord, il convient de souligner que cet indicateur de trading n'est ni repainting, ni redrawing et ne présente aucun délai, ce qui le rend idéal à la fois pour le trading manuel et automatisé. Manuel de l'utilisateur : réglages, entrées et stratégie. L'Analyste Atomique est un indicateur d'action sur les prix PA qui utilise la force et le momentum du prix pour trouver un meilleur avantage sur le marché. Équipé de filtres avancés qui aident à éliminer les bruits et les faux signaux, et à
Grabber System MT5
Ihor Otkydach
4.82 (22)
Je vous présente un excellent indicateur technique : Grabber, qui fonctionne comme une stratégie de trading "tout-en-un", prête à l'emploi. En un seul code sont intégrés des outils puissants d'analyse technique du marché, des signaux de trading (flèches), des fonctions d'alerte et des notifications push. Chaque acheteur de cet indicateur reçoit également gratuitement : L'utilitaire Grabber : pour la gestion automatique des ordres ouverts Un guide vidéo étape par étape : pour apprendre à installe
Super Signal – Skyblade Edition Système de signaux de tendance professionnel sans repaint / sans latence, avec un taux de réussite exceptionnel | Pour MT4 / MT5 Il fonctionne mieux sur des unités de temps inférieures, comme 1 minute, 5 minutes et 15 minutes. Caractéristiques principales : Super Signal – Skyblade Edition est un système de signaux intelligent conçu spécifiquement pour le trading de tendance. Il utilise une logique de filtrage multicouche pour détecter uniquement les mouvements d
Smart Stop Indicator – Précision intelligente du stop-loss directement sur votre graphique Présentation Smart Stop Indicator est la solution idéale pour les traders qui souhaitent placer leur stop-loss de manière claire et méthodique, sans deviner ni suivre leur intuition. Cet outil combine la logique classique de price action (succession de plus hauts et de plus bas) avec une reconnaissance moderne des cassures pour identifier le prochain niveau de stop réellement logique. Que le marché soit
Trend Screener Pro MT5
STE S.S.COMPANY
4.84 (100)
Indicateur de tendance, solution unique révolutionnaire pour le trading et le filtrage des tendances avec toutes les fonctionnalités de tendance importantes intégrées dans un seul outil ! Il s'agit d'un indicateur multi-période et multi-devises 100 % non repeint qui peut être utilisé sur tous les symboles/instruments : forex, matières premières, crypto-monnaies, indices et actions. Trend Screener est un indicateur de suivi de tendance efficace qui fournit des signaux de tendance fléchés avec des
RelicusRoad Pro : Système d'Exploitation Quantitatif du Marché 70% DE RÉDUCTION ACCÈS À VIE (DURÉE LIMITÉE) - REJOIGNEZ 2 000+ TRADERS Pourquoi la plupart des traders échouent-ils même avec des indicateurs "parfaits" ? Parce qu'ils tradent des concepts isolés dans le vide. Un signal sans contexte est un pari. Pour gagner, il faut de la CONFLUENCE . RelicusRoad Pro est un Écosystème Quantitatif complet . Il cartographie la "Fair Value Road", distinguant le bruit des cassures structurelles. Arrête
Dark Support Resistance  is an Indicator for intraday trading. This Indicator is programmed to identify  Support and Resistance Lines , providing a high level of accuracy and reliability. Key benefits Easily visible lines Only the most important levels will be displayed Automated adjustment for each timeframe and instrument Easy to use even for beginners Never repaints, never backpaints, Not Lag 100% compatible with Expert Advisor development All types of alerts available: Pop-up, Email, Push
Quantum TrendPulse
Bogdan Ion Puscasu
5 (20)
Présentation de   Quantum TrendPulse   , l'outil de trading ultime qui combine la puissance de   SuperTrend   ,   RSI   et   Stochastic   dans un seul indicateur complet pour maximiser votre potentiel de trading. Conçu pour les traders qui recherchent précision et efficacité, cet indicateur vous aide à identifier les tendances du marché, les changements de dynamique et les points d'entrée et de sortie optimaux en toute confiance. Caractéristiques principales : Intégration SuperTrend :   suivez f
TPSproTREND PrO MT5
Roman Podpora
4.74 (19)
TPSproTrend PRO identifie le moment précis où le marché change de direction et constitue un point d'entrée au début du mouvement. Vous entrez sur le marché lorsque le prix commence tout juste à bouger, et non après que le mouvement ait déjà eu lieu.   Indicateur       Il ne redessine pas les signaux et affiche automatiquement les points d'entrée, le Stop Loss et le Take Profit, rendant ainsi le trading clair, visuel et structuré. INSTRUCTIONS RUS   -   VERSION MT4 Principaux avantages Signalisa
The AX Forex Indicator MT5 is a sophisticated trading tool designed to provide traders with a comprehensive analysis of multiple currency pairs. This   powerful indicator   simplifies the complex nature of the forex market, making it accessible for both novice and experienced traders. AX Forex Indicator uses   advanced algorithms   to detect trends, patterns and is an essential tool for traders aiming to enhance their forex trading performance. With its robust features, ease of use, and reliabl
Trend indicator AI mt5
Ramil Minniakhmetov
5 (14)
L'indicateur Trend Ai est un excellent outil qui améliorera l'analyse du marché d'un trader en combinant l'identification des tendances avec des points d'entrée exploitables et des alertes d'inversion. Cet indicateur permet aux utilisateurs de naviguer dans les complexités du marché forex avec confiance et précision Au-delà des signaux primaires, l'indicateur Trend Ai identifie les points d'entrée secondaires qui surviennent lors des retraits ou des retracements, permettant aux traders de capit
Weis Wave with Alert MT5
Trade The Volume Waves Single Member P.C.
4.94 (17)
Rental/Lifetime Package Options and Privileges  Rent Monthly Six Months   Yearly/Lifetime Weis Wave with Speed with Alert+Speed Index x x x Manual  x x x Quick Set up Video x x x Blog x x x Lifetime Updates x x x Setup and Training Material x x Discord Access Channel "The SI traders"          x Rectangle Break Alert Tool      x How to trade with it:    http://www.tradethevolumewaves.com   ** If you purchase please contact me to setup your  : Training Room and  complete manual access.  Wei
CRT Liquidity Pro
Juan Pablo Castro Forero
5 (1)
Inquiet pour votre prochain trade ? Fatigué de ne pas savoir si votre stratégie fonctionne vraiment ? Avec CRT Liquidity Pro, vous tradez avec des statistiques réelles, pas des émotions. Connaissez vos probabilités, suivez vos performances et tradez avec confiance — basé sur la Puissance de 3, la détection intelligente de liquidité et les confirmations CRT. Voulez-vous voir la réalité de la stratégie CRT Liquidity ? Après votre achat, contactez-nous et nous vous offrirons gratuitement l’un de n
Advanced Supply Demand MT5
Bernhard Schweigert
4.5 (14)
La meilleure solution pour tout commerçant débutant ou expert ! Cet indicateur est un outil de trading unique, de haute qualité et abordable car nous avons intégré un certain nombre de fonctionnalités propriétaires et une nouvelle formule. Avec cette mise à jour, vous pourrez afficher des zones à double horaire. Vous pourrez non seulement afficher un TF plus élevé, mais afficher les deux, le graphique TF, PLUS le TF supérieur : AFFICHAGE DES ZONES NICHÉES. Tous les traders Supply Demand vont ado
El magiciann
Abdelhak Benazizi
EL MAGICIAN – Indicateur professionnel des zones d’offre et de demande Un indicateur professionnel multi-timeframe qui détecte automatiquement des zones d’offre et de demande à haute probabilité sur n’importe quelle paire de devises, éliminant totalement la subjectivité et les approximations du tracé manuel. Qu’est-ce que EL MAGICIAN ? EL MAGICIAN est un indicateur de niveau professionnel qui identifie automatiquement et avec précision les zones institutionnelles d’offre et de demande. Il suppri
FX Volume MT5
Daniel Stein
4.79 (24)
FX Volume : Découvrez le Sentiment du Marché tel que perçu par un Courtier Présentation Rapide Vous souhaitez faire passer votre approche de trading au niveau supérieur ? FX Volume vous fournit, en temps réel, des informations sur la manière dont les traders particuliers et les courtiers sont positionnés—bien avant la publication de rapports retardés comme le COT. Que vous visiez des gains réguliers ou recherchiez simplement un avantage plus solide sur les marchés, FX Volume vous aide à repére
ARIScalping
Temirlan Kdyrkhan
ARIScalp is a powerful trading companion designed to generate high-probability entry signals with dynamic TP/SL/DP levels based on volatility. Built-in performance tracking shows win/loss stats, PP1/PP2 hits, and success rates all updated live. Key Features: Buy/Sell signals with adaptive volatility bands Real-time TP/SL/DP levels based on ATR Built-in MA Filter with optional ATR/StdDev volatility Performance stats panel (Success, Profit/Loss, PP1/PP2) Alerts via popup, sound, push, or email Cus
M1 Scalper Pro MT5
Elif Kaya
4.64 (11)
- Real price is 80$ - 45% Discount (It is 45$ now) Contact me for extra bonus   indicator, instruction or any questions! - Lifetime update free - Non-repaint - Related product: Gann Gold EA - I just sell my products in Elif Kaya Profile, any other websites are stolen old versions, So no any new updates or support. Advantages of  M1 Scalper Pro  Profitability: M1 Scalper Pro is highly profitable with a strict exit strategy. Frequent Opportunities: M1 Scalper Pro  takes advantage of numerous smal
Algo Pumping
Ihor Otkydach
4.75 (20)
PUMPING STATION – Votre stratégie personnelle «tout compris» Nous vous présentons PUMPING STATION – un indicateur Forex révolutionnaire qui transformera votre façon de trader en une expérience à la fois efficace et passionnante. Ce n’est pas seulement un assistant, mais un véritable système de trading complet, doté d’algorithmes puissants pour vous aider à trader de manière plus stable. En achetant ce produit, vous recevez GRATUITEMENT : Fichiers de configuration exclusifs : pour un réglage auto
PillowIndicator
Sergey Shevchenko
Si vous avez besoin d’un indicateur qui montre les points d’entrée sur le marché, alors c’est votre indicateur.  L'indicateur n'est pas redessiné. Affiche les points d'achat et de vente pour n'importe quel TF (période) et n'importe quelle paire de devises. Les paramètres sont réglables pour tous les instruments. Vous pouvez configurer chaque paramètre pour n'importe quel courtier, pour n'importe quel compte. C'est un OREILLER confortable :)) Il suffit de le vérifier.....
Plus de l'auteur
This indicator is based on a classic  DeMarker indicator. Multi TimeFrame indicator MTF-DeMarker shows data from the 4 timeframes by your choice. By default this indicator has external parameters: TF1 = 1; TimeFrame2b = true; TF2 = 5; TimeFrame3b = true; TF3 = 15; TimeFrame4b = true; TF4 = 60; InpPeriod = 14; You can change TF1-TF4 in the next limits: TF1 from M1 (1) to H4 (240) TF2 from M5 (5) to D1 (1440) TF3 from M15 (15) to W1 (10080) TF4 from M30 (30) to MN1 (43200) All chosen TFs should be
This is a self-explanatory indicator - do nothing when the current price in the "fence" (flat) mode. Definition of a flat market: A market price that is neither Up nor Down. The input parameter  counted_bars  determines on how many bars the indicator's lines will be visible starting from the current Bar backward. The input parameter  barsNum  is used as a Period for aqua "fence" calculation.
This Multi TimeFrame indicator is based on the "Fractals" classical indicator. 2 Inputs: TimeFrame1; TimeFrame2; You can put any available TimeFrame values (from M1 (Period_M1) to MN1 (Period_MN1)) equal or greater ( >= ) than the Period of the current Time Frame. The last Fractals will shown as color lines (Dots Line) of Support and Resistance for the Price moving.
This is a Multi-Time indicator which allows to display RSI and Stochastic indicators from upper timeframes on a single chart. As an example: a single chart EURUSD M5 and RSI (blue line) and Stochastic (yellow line) from H1. Red Histogram is representing Lower trend and Green Histogram is representing Upper trend.
When you put this Multi TimeFrame Parabolic SAR indicator on the chart it will automatically use Parabolic SAR from next available 3 timeframes. Green arrow will show the beginning of Up trend and Red arrow will show the beginning of Down trend. If AlertsEnabled = true, the indicator will show the Alert (message window) with a text like this: "Price going Down on ", Symbol(), " - ", Period(), " min", " price = ", Bid; If eMailEnabled = true the Indicator will send you an eMail with the same text
The zero line is characterized the Flat trend. V-shaped impulse indicates the entrance to the opposite direction. U-shaped impulse = entry orders in the same direction. If AlertsEnabled = true, the indicator will show the Alert (message window) with a text like this: "Price going Down on ", Symbol(), " - ", Period(), " min", " price = ", Bid; If eMailEnabled = true the indicator will send you an eMail with the same text an Alert message with subject: "Trinity-Impolse" (of course you have to chec
The indicator displays the usual Moving Average with input parameters: maPeriod_1; maMethod_1; maAppPrice_1. Then it calculates and displays MA on MA1 with input parameters: maPeriod_2; maMethod_2. Then it calculates and displays MA on MA2 with input parameters: maPeriod_3; maMethod_3. If AlertsEnabled = true the Indicator will show the Alert (message window) with a text like this: "Price going Down on ", Symbol(), " - ", Period(), " min", " price = ", Bid; If eMailEnabled = true the Indicator w
Multi TimeFrame Indicator "MTF CCI Trigger" based on the Commodity Channel Index from the upper TF (input parameter "TimeFrame") yellow line. Aqua line is representing ATR envelopes from the current TF. Green and Red arrows is triggered by CCI and represented UP and DOWN trends accordingly.
The BBImpulse indicator is based on the standard Moving Average indicator. You have MA input parameters: maPeriod - Moving Average period; maMODE - Moving Average mode (0 = MODE_SMA; 1 = MODE_EMA; 2 = MODE_SMMA; 3 = MODE_LWMA); maPRICE - Applied price (0=PRICE_CLOSE; 1=PRICE_OPEN; 2=PRICE_HIGH; 3=PRICE_LOW; 4=PRICE_MEDIAN; 5=PRICE_TYPICAL; 6=PRICE_WEIGHTED). Green Histogram is representing an UP-trend, Red Histogram is representing a Down-trend.
Multi TimeFrame indicator MTF ADX with Histogram shows ADX indicator data from the TF by your choice. You may choose a TimeFrame equal or greater than current TF. Yellow line is representing a price trend from the upper TF. Green line is representing +DI from the upper TF. Red line is representing -DI from the upper TF. Green histogram is displaying an Up-trend. Red histogram is displaying a Down-trend.
This Indicator creates 2 white lines based on Exponential Moving Averag e of High and Low prices. You can regulate how many bars will be involved in the calculation with input parameter HL_Period. Red and Blue arrows are displaying the moment to go Short and Long trades accordingly.
The most common way to interpreting the price Moving Average is to compare its dynamics to the price action. When the instrument price rises above its Moving Average, a buy signal appears, if the price falls below its moving average, what we have is a sell signal. To avoid a spontaneous entries one may use this update from Moving Average Indicator = Stepper-MA.
Envelopes technical Indicator is formed with two Moving Averages one of which is shifted upward and another one is shifted downward. Envelopes define the upper and the lower margins of the price range. Signal to sell appears when the price reaches the upper margin of the band; signal to buy appears when the price reaches the lower margin. To avoid a spontaneous entries one may use this update from Envelopes Indicator = Envelopes-Stepper.
The interpretation of the Bollinger Bands is based on the fact that the prices tend to remain in between the top and the bottom line of the bands. Abrupt changes in prices tend to happen after the band has contracted due to decrease of volatility; If prices break through the upper band, a continuation of the current trend is to be expected; If the pikes and hollows outside the band are followed by pikes and hollows inside the band, a reverse of trend may occur; The price movement that has starte
Fibonacci sequence is defined by integer sequence: 0, 1, 1, 2, 3, 5, 8, 13, 34, 55, 89, 144, ... By definition, it starts from 0 and 1, the next number is calculated as a sum of two previous numbers. Instead of the standard moving average, the indicator uses the caluclation of average price in form: Bar0 + Bar1 + Bar2 + Bar3 + Bar5 + Bar8 + Bar13 +... Input parameters:  FiboNumPeriod (15) - Fibonacci period; nAppliedPrice (0) - applied price (PRICE_CLOSE=0; PRICE_OPEN=1; PRICE_HIGH=2; PRICE_LOW=
This indicator present a main Moving Average line with input parameters maPeriod_1, maMethod_1 and maAppPrice_1. The second line will be a calculation of the Moving Average data of a first line with input parameters maPeriod_2, maMethod_2. The third line will be a calculation of the Moving Average data of a second line with input parameters maPeriod_3, maMethod_3. To avoid a spontaneous entries one may use this indicator-stepper.
This indicator (as almost all others) is based on classical Moving Averages. It shows the Average Bar under the current bar colored in aqua or over the current bar colored in orange. Input Parameters: ma_Period and ma_Method. The Average Bar maybe helpful to predict where the price will move in the nearest future. Of course, this "near future" depends of the current time frame.
Buy when the market is falling and sell when the market is rising. When the market is moving down you start observing and looking for buy signals. When the market is moving up you start looking for sell signals. This indicator points to the moments to Buy (Blue arrow) and to Sell (Orange arrow). Two input parameters: barsNumber and step for optimization (depending on symbol and Time Frame).
This indicator shows: A green light in case the price goes up; A red light in case the price goes down; A yellow light in case there are a sideways trend. A sideways trend is the horizontal price movement that occurs when the forces of supply and demand are nearly equal. This typically occurs during a period of consolidation before the price continues a prior trend or reverses into a new trend
This indicator is created for M1 timeframe. It shows how many ticks has occurred during current minute and ( after the slash) the sum of points Up (aqua color) and Down (orange color). In times of a high trading activity a grow up number of ticks Up and Down will signal of a big move of the price in the near future. In times of a high trading activity a grow up number of sum of points Up and Down will signal of a big move of the price in the near future too.
Two yellow lines. This is similar to classical Envelopes but with automatic deviation. The Envelopes indicator is   a tool that attempts to identify the upper and lower bands of a trading range. Aqua line. This is a classical Commodity Channel Index added to the Envelopes on the chart, not in a separate window. The Commodity Channel Index ( CCI ) is a technical   indicator   that measures the difference between the current price and the historical average price.
Probability deals with the likelihood of an event happening.   Forex   probability indicates a possibility at a specific time. This is because the forex market is highly volatile, and predicting future events affecting it is impossible. This indicator will show a positive number above the current High or negative number under the current Low as a probability of the trend. Higher time frames usually show a higher probability, even more then 100%.
Envelopes is an excellent indicator when the market is trending. Open Long position when the ClosePrice crossed the upper Aqua band. Close Long position when the Price crossed the upper Yellow band moving down. Open Short position when the ClosePrice crossed the lower Aqua band. Close Short position when the Price crossed the lower Yellow band moving up.
Moving Average Bars is a self-explanatory indicator with one input parameter: nPeriod. When the previous Price Close is above the previous indicator Bar, the probability to go Long is very high.   When the previous Price Close is under the previous indicator Bar, the probability to go Short is very high.
This indicator is based on the same idea as https://www.mql5.com/en/market/product/2406 , but instead of Average Bars it uses series or Fibonacci sequence. When the previous Price Close is above the previous indicator Bar, the probability to go Long is very high. When the previous Price Close is under the previous indicator Bar, the probability to go Short is very high.
This indicator is based on two ideas: Correlations between 5 main currency pairs: EURUSD, GBPUSD, USDCHF, USDJPY, USDCAD; US Dollar Index = the value of the United States dollar relative to a basket of foreign currencies. The use of the indicator is the same as classical  Commodity Channel Index  (CCI) indicator. CCI is calculated with the following formula:  (Typical Price - Simple Moving Average) / (0.015 x Mean Deviation) (Typical Price - Simple Moving Average) / (0.015 x Mean Deviation)
A  tick  is a measure of the minimum upward or downward movement in the  price  of a security. A  tick  can also refer to the change in the  price  of a security from one trade to the next trade.  This indicator will show amounts of ticks when the price goes up and down. This indicator is designed for M1 time frame and shows: Sum of points when the price goes up (Green Histogram). Sum of points when the price goes down (Red Histogram). 
This indicator is a combination of 2 classical indicators MA and RVI. The Relative Vigor Index (RVI) is a momentum indicator used in technical analysis that measures the strength of a trend by comparing a security's closing price to its trading range while smoothing the results using a simple moving average   The input parameter  counted_bars  determines how many bars the indicator's lines will be visible. The input parameter MaRviPeriod  is used for MA and RVI calculation.
This indicator is a combination of 2 classical indicators: MA and Force Index. The input parameter  counted_bars  determines on how many bars the indicator lines will be visible. The input parameter  MaForcePeriod  is used for MA and Force calculation. You may go Long if the current price crossed Up the Ribbon (HISTOGRAM)  and you may go Short if the current price crossed Down the Ribbon (HISTOGRAM)
This indicator is a combination of 2 classical indicators: MA and CCI. Two moving averages form Upper and Lower bands. The input parameter  counted_bars  determines on how many bars the indicator's lines will be visible. The input parameter  barsNum  is used for MA and CCI calculation.
Filtrer:
Aucun avis
Répondre à l'avis